

The DOI matches its Crossref record; 105 of the 105 references it cites were found in a registry or an index; 73 of the 85 sources its claims cite were checked for support.
The APOE-R136S mutation protects against APOE4-driven tau pathology, neurodegeneration, and neuroinflammation
Open accessAbstract
Apolipoprotein E4 ( APOE4 ) is the strongest genetic risk factor for late-onset Alzheimer’s disease (LOAD), leading to earlier age of clinical onset and exacerbating pathologies. There is a critical need to identify protective targets. Recently, a rare APOE variant, APOE3-R136S (Christchurch), was found to protect against early-onset AD in a PSEN1-E280A carrier. In this study, we sought to determine if the R136S mutation also protects against APOE4-driven effects in LOAD. We generated tauopathy mouse and human iPSC-derived neuron models carrying human APOE4 with the homozygous or heterozygous R136S mutation. We found that the homozygous R136S mutation rescued APOE4-driven Tau pathology, neurodegeneration and neuroinflammation. The heterozygous R136S mutation partially protected against APOE4-driven neurodegeneration and neuroinflammation but not Tau pathology. Single-nucleus RNA sequencing revealed that the APOE4-R136S mutation increased disease-protective and diminished disease-associated cell populations in a gene dose-dependent manner. Thus, the APOE-R136S mutation protects against APOE4-driven AD pathologies, providing a target for therapeutic development against AD.
Overview
AI snapshot
Written from the paper’s full text.
TL;DR
The APOE4-R136S mutation protects against APOE4-driven tau pathology, neurodegeneration, and neuroinflammation in PS19 tauopathy mice and human iPSC-derived neurons, with homozygous R136S generally required for full rescue. Heterozygous R136S partially protects against neurodegeneration and neuroinflammation but not tau pathology, and snRNA-seq shows gene-dose-dependent increases in disease-protective and decreases in disease-associated cell populations.
Key findings
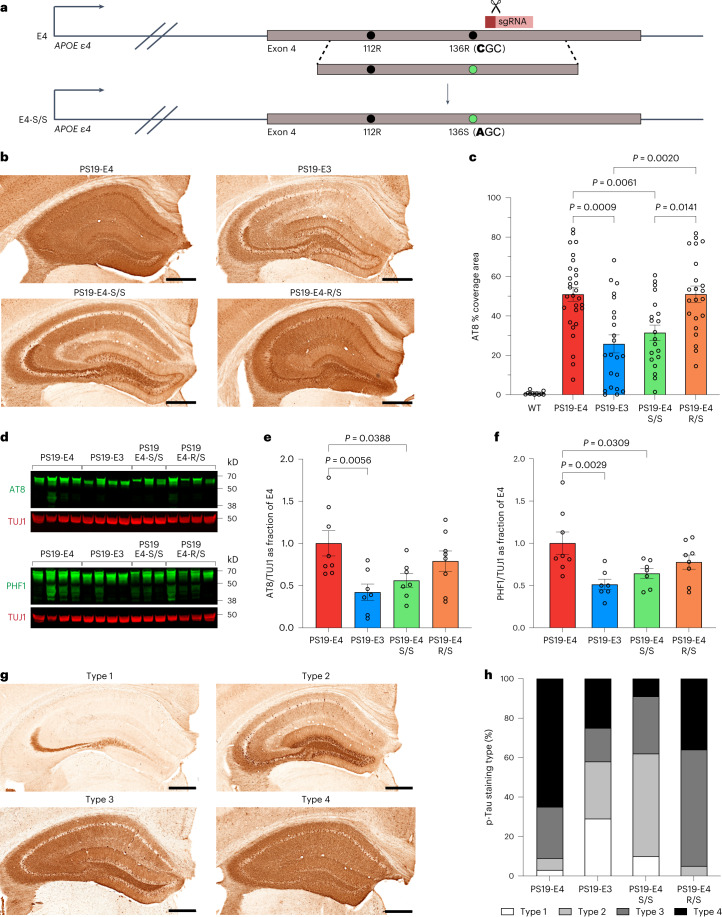
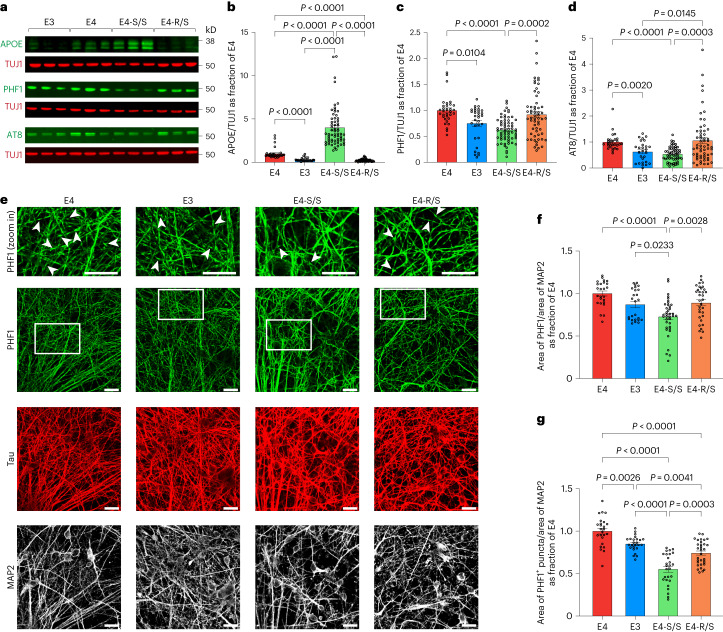
- Homozygous E4-S/S reduced hippocampal p-Tau: PS19-E4 mice had roughly two-fold higher AT8+ coverage than PS19-E3 mice, while PS19-E4-S/S fell to PS19-E3 levels; PS19-E4-R/S did not show this reduction. In human neurons, E4-S/S showed ~40% lower p-Tau by western blot and ~35% lower PHF1+ p-Tau by immunostaining versus E4, whereas E4-R/S showed no reduction.
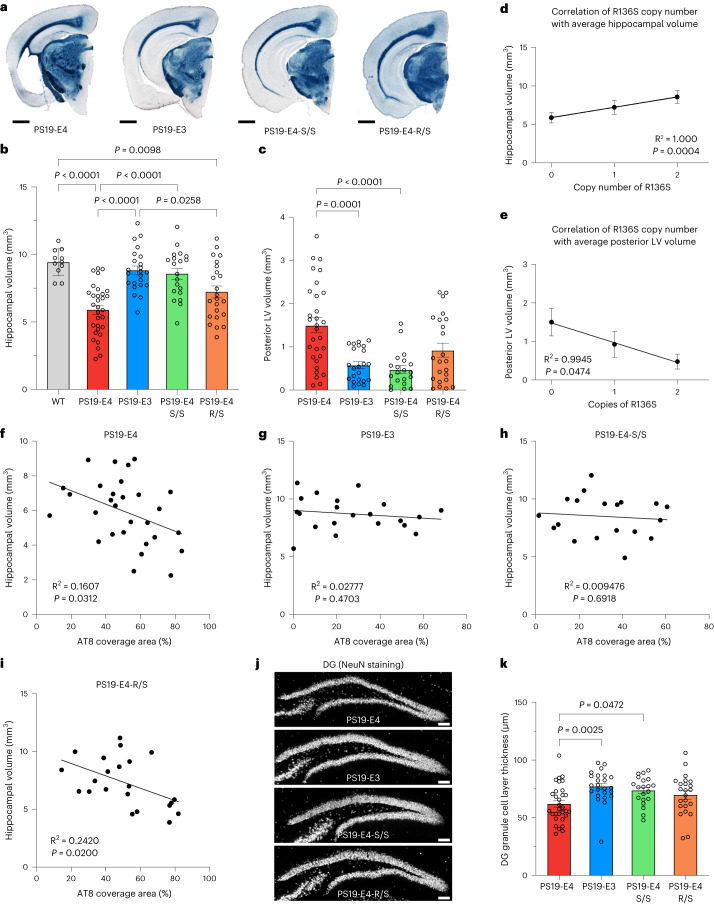
- Neurodegeneration was rescued by homozygous R136S: PS19-E4-S/S hippocampal atrophy was reduced to WT/PS19-E3 levels, with partial rescue in PS19-E4-R/S; DG GC layer thickness increased ~20% in PS19-E3 and PS19-E4-S/S over PS19-E4, while PS19-E4-R/S showed a non-significant 12% increase. R136S copy number correlated with hippocampal volume and posterior lateral ventricle volume.
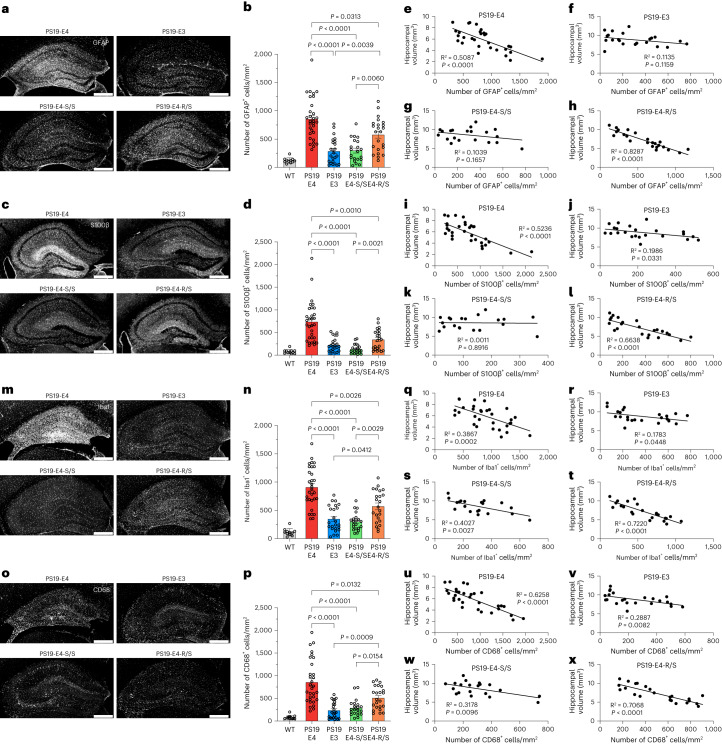
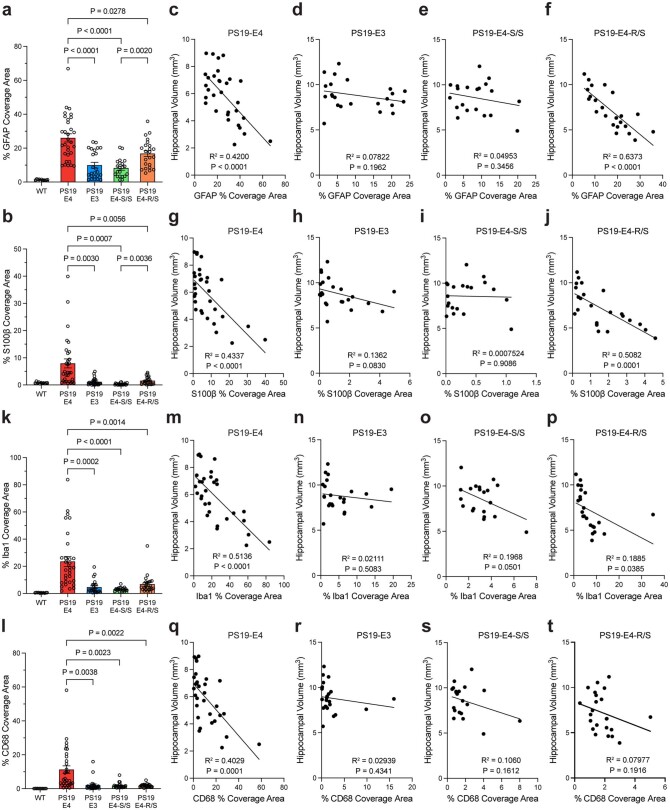
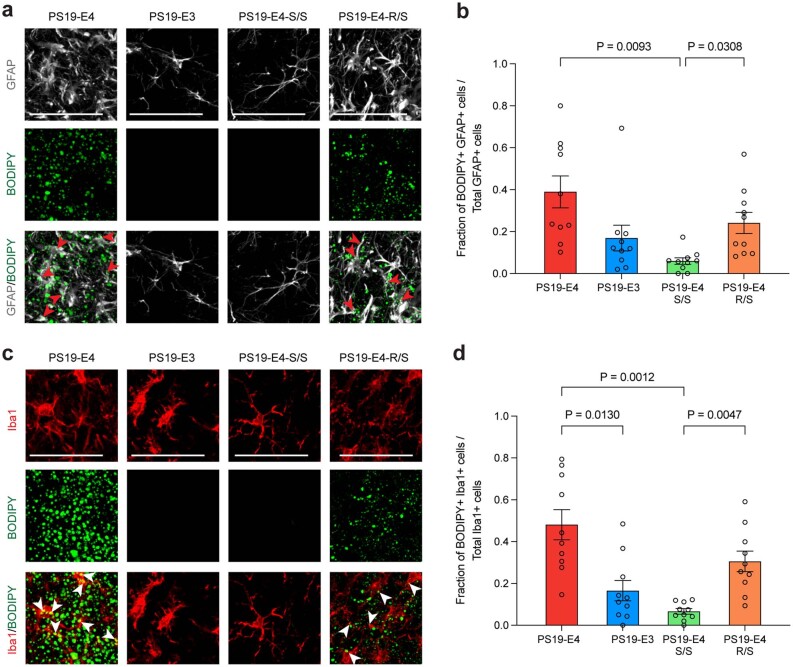
- Neuroinflammation was reduced in a gene-dose-dependent manner: PS19-E4-S/S and PS19-E3 had lower GFAP+ and S100β+ astrocytosis and lower Iba1+ and CD68+ microgliosis than PS19-E4; PS19-E4-R/S showed intermediate protection, with significantly higher Iba1+ and CD68+ cell numbers than PS19-E4-S/S.
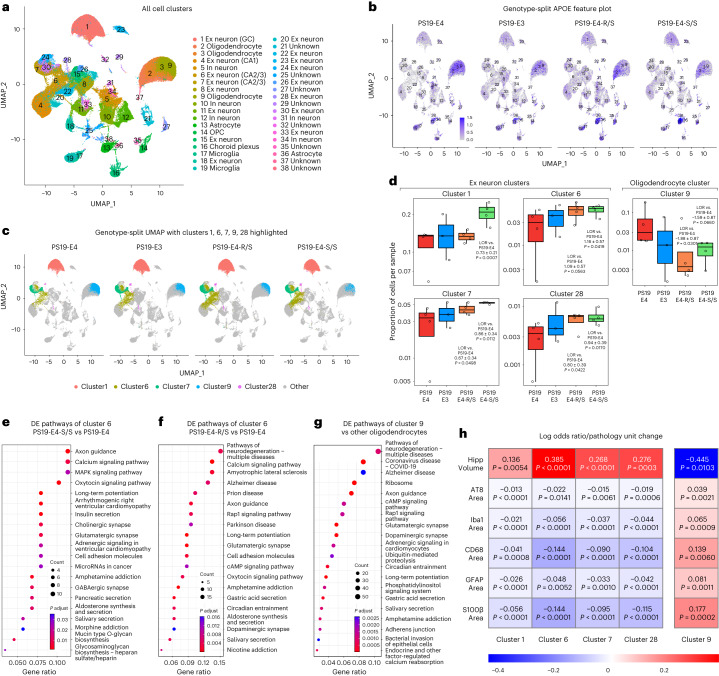
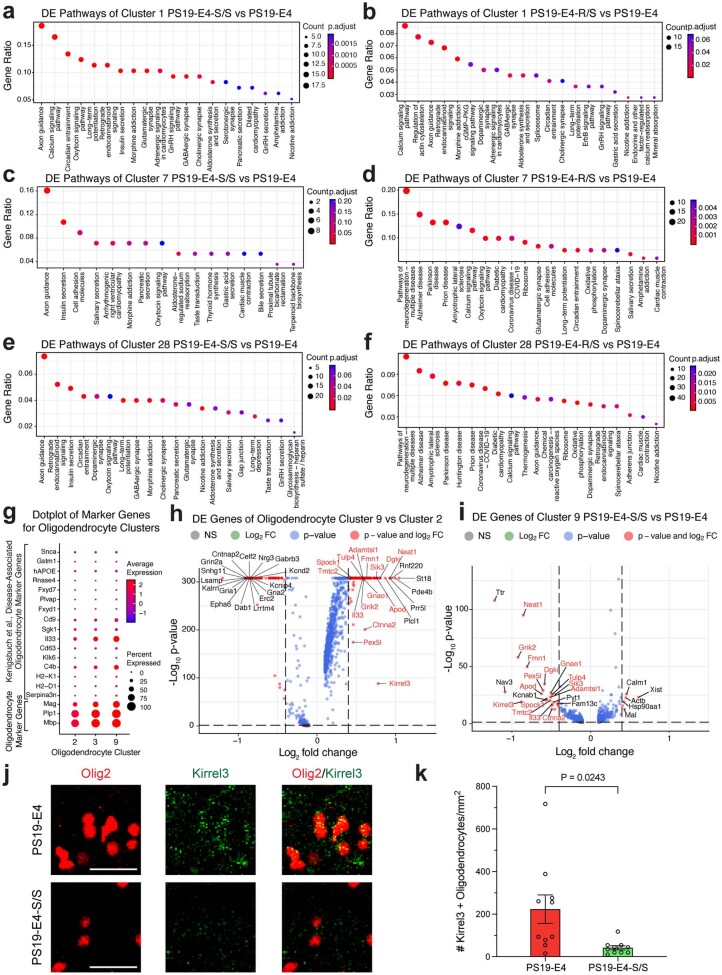
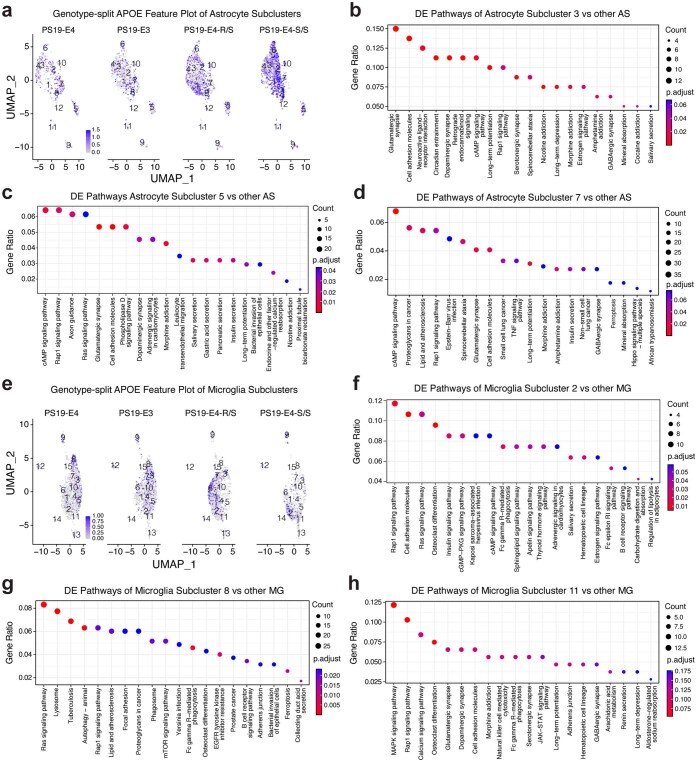
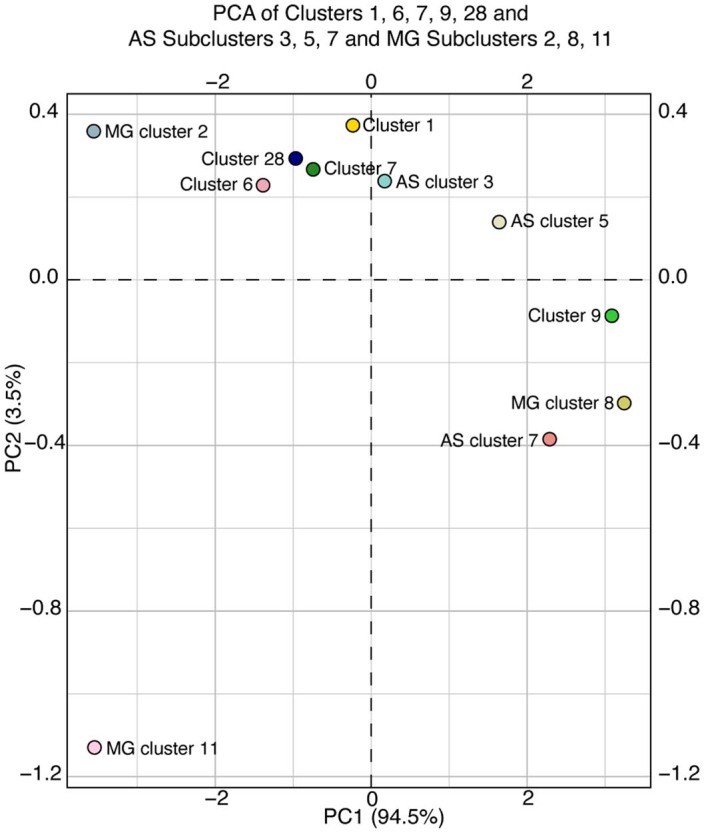
- snRNA-seq of 175,080 nuclei and 38 clusters showed E4-S/S increased disease-protective neuronal clusters 1, 6, 7, and 28 and homeostatic astrocyte subcluster 3 and microglia subclusters 2 and 11, while decreasing disease-associated oligodendrocytes (cluster 9), astrocytes (subclusters 5 and 7), and microglia (subcluster 8). E4-R/S also reduced DAA subcluster 7 (LOR −1.57 ± 0.57) and DAM subcluster 8 (LOR −2.58 ± 1.02), but less than E4-S/S (subcluster 7 LOR −2.75 ± 0.62; subcluster 8 LOR −3.36 ± 1.17).
Methods
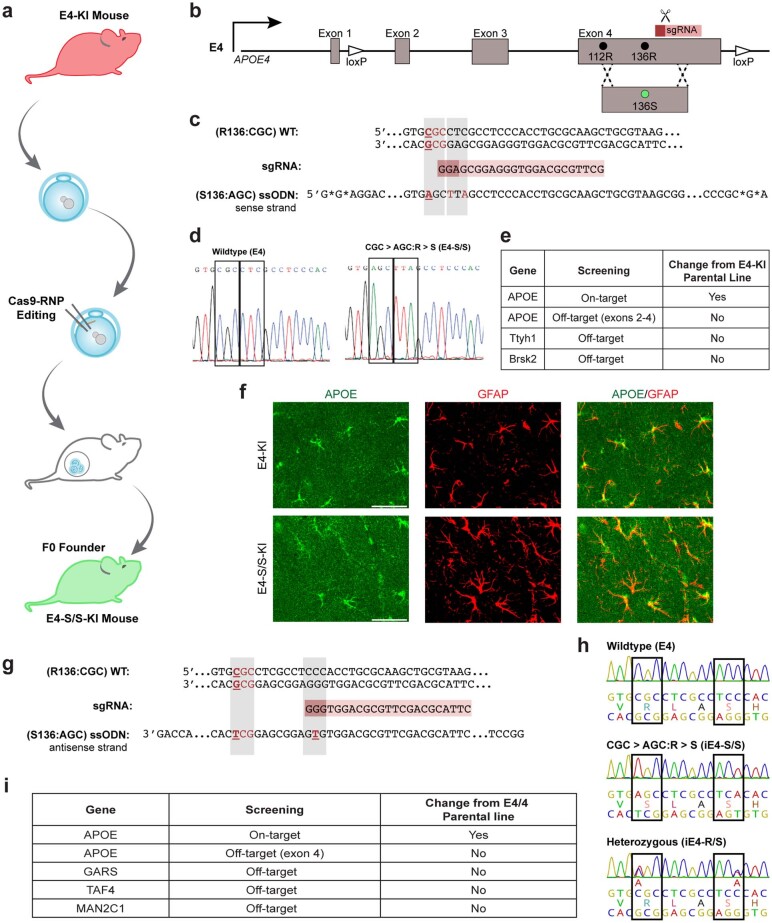
- CRISPR–Cas9 was used to introduce R136S into human APOE4 knock-in mice, which were crossed with PS19 Tau-P301S mice to generate PS19-E4, PS19-E3, PS19-E4-S/S, and PS19-E4-R/S groups; mice were analyzed at ~10 months, with some 6-month comparisons, using both sexes.
- Isogenic hiPSC lines from an APOE4/4 Alzheimer’s disease patient were edited to E4-S/S and E4-R/S, alongside E4, E3, and APOE-knockout lines, and differentiated into neurons for western blot, immunostaining, Tau-488 uptake flow cytometry with/without heparin, long-term heparin treatment, and E4-conditioned medium experiments.
- Hippocampal snRNA-seq from 10-month PS19 mice was analyzed with Seurat clustering, differential expression, KEGG pathway enrichment, and generalized linear mixed-effects models for associations with genotype and histopathology.
Limitations
- Stated in the paper: the models do not exhibit extensive Aβ pathology, so the study does not address whether APOE-R136S protects against Aβ-mediated neuroinflammatory and neurodegenerative effects.
- Stated in the paper: the study focused on APOE4; future studies are needed to test whether R136S also protects in the context of APOE3.
- Evident from the text: mouse tissue studies used one cohort; snRNA-seq had 3–4 mice per group and one PS19-E3 sample was excluded after quality control; hiPSC experiments used biological replicates over two or three independent differentiations; no randomization was used for group assignment, and snRNA-seq investigators were not blinded.
Model-written summary. Check it against the paper before relying on it.
Integrity signals
Registry
Cites
Statistics
Figures
Verification
Claims the paper makes
131 Own result · 61 Own interpretation · 34 Own method · 18 Partly supported · 15 Supported · 3 Mixed support · 2 Not supported · 2 No full text of the sources · 1 Couldn’t confirm · 1 Not checked yet · 1 No basis given · accuracy not yet measured
Some cited sources support this claim and some don’t — read each source’s verdict below.
In the paper
“Notably, the APOE-R136S has severely reduced binding affinity to heparin, as the mutation occurs within the receptor-binding region of APOE36,45,58.”
§ The APOE-R136S mutation protects against APOE4-driven Tau pathology, neurodegeneration and neuroinflammation > Results > E4-S/S reduces HSPG-mediated Tau uptake by human neurons
What the sources say
- Supportedcites [36] Arboleda-Velasquez, J. F. et al. Resistance to autosomal dominant Alzheimer’s disease in an APOE3 Christchurch homozygote: a case report. Nat. Med. 25, 1680–1683 (2019). source
The Abstract identifies R136S in a region involved in lipoprotein-receptor binding and reports that ApoE3 Christchurch had the lowest heparin-binding ability of the ApoE isoforms compared. This supports the claim of markedly reduced heparin binding, although the passage does not quantify that reduction. (LLM, conf=0.92)
- Disputedcites [45] Wardell, M. R., Brennan, S. O., Janus, E. D., Fraser, R. & Carrell, R. W. Apolipoprotein E2-Christchurch (136 Arg–Ser). New variant of human apolipoprotein E in a patient with type III hyperlipoproteinemia. J. Clin. Invest. 80, 483–490 (1987). sourceExperimental — accuracy not yet measured
The Discussion (page unavailable) places residue 136 outside the recognized receptor-binding domain, contrary to the citing sentence’s explanation. It reports that APOE-R136S had the same heparin affinity as another APOE2 variant under denaturing conditions; it does not report severely reduced heparin affinity relative to normal APOE. (LLM, conf=0.84)
Checked by a reasoning model — may be wrong.
- Not checked — no full text of the sourcecites [58] Lalazar, A. et al. Site-specific mutagenesis of human apolipoprotein E. Receptor binding activity of variants with single amino acid substitutions. J. Biol. Chem. 263, 3542–3545 (1988). source
plaindirect- Asserted: passes — The authors put it forward as true.
- Checkable: passes — It can be checked against evidence.
- Load-bearing: passes — The paper’s conclusions depend on it.
- Based: passes — The paper gives a reason why it holds.
- Supported
At least one cited source doesn’t support this claim or points to a different paper, and none confirmed it — see the verdicts below.
In the paper
“The early p-Tau staining types 1 and 2 were enriched in PS19-E3 mice (Fig. 1h), as seen previously7.”
§ The APOE-R136S mutation protects against APOE4-driven Tau pathology, neurodegeneration and neuroinflammation > Results > E4-S/S reduces Tau pathology in tauopathy mice
What the sources say
- Disputedcites [7] Shi, Y. et al. ApoE4 markedly exacerbates tau-mediated neurodegeneration in a mouse model of tauopathy. Nature 549, 523–527 (2017). sourceExperimental — accuracy not yet measured
The paper’s discussion of p-tau staining patterns (section labeled Abstract; page unavailable) says types 1 and 2 were enriched in TEKO mice, not TE3 mice, and type 4 was enriched in TE4 mice. It describes these patterns in 9-month-old mice; it does not identify types 1 and 2 as early-age staining. (LLM, conf=0.88)
Checked by a reasoning model — may be wrong.
plaincorrelational- Asserted: passes — The authors put it forward as true.
- Checkable: passes — It can be checked against evidence.
- Load-bearing: unclear — It is unclear whether the paper’s conclusions depend on it.
- Based: passes — The paper gives a reason why it holds.
- Rests on an assumption: The PS19 tauopathy mouse model crossed with human APOE4-KI mice recapitulates APOE4-driven AD tau pathology sufficiently to test protection by R136S.
- Disputed
Some cited sources support this claim and some don’t — read each source’s verdict below.
In the paper
“By contrast, APOE4 has increased binding affinity (up to two-fold) for heparin and HSPG over APOE3 (refs. 32–35).”
§ The APOE-R136S mutation protects against APOE4-driven Tau pathology, neurodegeneration and neuroinflammation > Results > E4-S/S reduces HSPG-mediated Tau uptake by human neurons
What the sources say
- Not checked — no full text of the sourcecites [32] Mahley, R. W. & Rall, S. C. Apolipoprotein E: far more than a lipid transport protein. Annu. Rev. Genom. Hum. Genet. 1, 507–537 (2000). source
- Disputedcites [33] Ji, Z.-S., Pitas, R. E. & Mahley, R. W. Differential cellular accumulation/retention of apolipoprotein E mediated by cell surface heparan sulfate proteoglycans. Apolipoproteins E3 and E2 greater than E4. J. Biol. Chem. 273, 13452–13460 (1998). sourceExperimental — accuracy not yet measured
In the ‘Metabolism of ¹²⁵I-apoE3- and ¹²⁵I-apoE4-enriched β-VLDL’ section (page unavailable), similar amounts of the two isoforms bound to wild-type CHO cells; the paper reports greater subsequent retention of apoE3. It does not report a two-fold greater apoE4 binding affinity for heparin or HSPG. The cell-binding experiment is not a direct affinity measurement, but its reported comparison runs contrary to the cited claim. (LLM, conf=0.78)
Checked by a reasoning model — may be wrong.
- Partly supportedcites [34] Libeu, C. P. et al. New insights into the heparan sulfate proteoglycan-binding activity of apolipoprotein E. J. Biol. Chem. 276, 39138–39144 (2001). sourceExperimental — accuracy not yet measured
The surface plasmon resonance passage (indexed as Abstract; page unavailable) gives heparin-binding dissociation constants of 0.15 µM for apoE4 and 0.32 µM for apoE3, consistent with approximately twofold higher affinity for heparin, although the authors describe them as very similar. The cited passages do not establish a corresponding apoE4-versus-apoE3 affinity difference for HSPG. (LLM, conf=0.84)
- Partly supportedcites [35] Yamauchi, Y. et al. Role of the N- and C-Terminal domains in binding of apolipoprotein E isoforms to heparan sulfate and dermatan sulfate: a surface plasmon resonance study. Biochemistry 47, 6702–6710 (2008). sourceExperimental — accuracy not yet measured
The Results (page unavailable) report that apoE4 showed two- or three-fold higher binding to heparan sulfate (HS) and dermatan sulfate than apoE3. But this study does not establish the claimed increase in affinity for heparin or intact HSPG; it also says equilibrium affinity for HS did not differ much among the lipidated isoforms. The reported binding increase is not limited to two-fold. (LLM, conf=0.90)
plaindirect- Asserted: passes — The authors put it forward as true.
- Checkable: passes — It can be checked against evidence.
- Load-bearing: passes — The paper’s conclusions depend on it.
- Based: passes — The paper gives a reason why it holds.
The cited sources support only part of this claim — read each source’s verdict below.
In the paper
“Apolipoprotein E4 (APOE4) is the strongest genetic risk factor for late-onset Alzheimer’s disease (LOAD)1–3.”
§ The APOE-R136S mutation protects against APOE4-driven Tau pathology, neurodegeneration and neuroinflammation > Main
What the sources say
- Supportedcites [1] Huang, Y. & Mucke, L. Alzheimer mechanisms and therapeutic strategies. Cell 148, 1204–1222 (2012). source
In “Genetics, Epigenetics, and Epidemiology,” the review calls apoE4 the top late-onset AD gene in GWAS across populations and says other identified genes contribute moderately by comparison. This supports the claim that APOE4 is the strongest genetic risk factor for late-onset Alzheimer’s disease. (LLM, conf=0.94)
- Partly supportedcites [2] Mahley, R. W., Weisgraber, K. H. & Huang, Y. Apolipoprotein E4: a causative factor and therapeutic target in neuropathology, including Alzheimer’s disease. Proc. Natl Acad. Sci. USA 103, 5644–5651 (2006). sourceExperimental — accuracy not yet measured
The “ApoE and Neuropathology” section calls apoE4 the major known genetic risk factor for Alzheimer’s disease in many populations. It does not specify late-onset disease, and the citing sentence omits the population qualifier. (LLM, conf=0.83)
- Supportedcites [3] Huang, Y. & Mahley, R. W. Apolipoprotein E: structure and function in lipid metabolism, neurobiology, and Alzheimer’s diseases. Neurobiol. Dis. 72PA, 3–12 (2014). source
In “Other Lipid Metabolism–Related Genes and AD” (page unavailable), the review contrasts apoE4’s association with AD against the weak associations of other genes it discusses. The “Aβ-Dependent Effects of ApoE4 on AD Pathogenesis” section also describes how apoE4 may contribute to AD. Together, these passages support the citing sentence’s broad characterization of APOE4 as the leading genetic risk factor for late-onset AD. (LLM, conf=0.84)
plaincorrelational- Asserted: passes — The authors put it forward as true.
- Checkable: passes — It can be checked against evidence.
- Load-bearing: passes — The paper’s conclusions depend on it.
- Based: passes — The paper gives a reason why it holds.
- Supported
The cited sources support only part of this claim — read each source’s verdict below.
In the paper
“It exacerbates AD-related pathologies, including amyloid-beta (Aβ) plaques, Tau tangles, neurodegeneration and neuroinflammation4–16.”
§ The APOE-R136S mutation protects against APOE4-driven Tau pathology, neurodegeneration and neuroinflammation > Main
What the sources say
- Not checked — no full text of the sourcecites [4] Koutsodendris, N., Nelson, M. R., Rao, A. & Huang, Y. Apolipoprotein E and Alzheimer’s disease: findings, hypotheses, and potential mechanisms. Annu. Rev. Pathol. 17, 73–99 (2022). source
- Not checked — no full text of the sourcecites [5] Harris, F. M., Brecht, W. J., Xu, Q., Mahley, R. W. & Huang, Y. Increased tau phosphorylation in apolipoprotein E4 transgenic mice is associated with activation of extracellular signal-regulated kinase: modulation by zinc. J. Biol. Chem. 279, 44795–44801 (2004). source
- Partly supportedcites [6] Wang, C. et al. Gain of toxic apolipoprotein E4 effects in human iPSC-derived neurons is ameliorated by a small-molecule structure corrector. Nat. Med. 24, 647–657 (2018). sourceExperimental — accuracy not yet measured
The Introduction associates apoE4 with increased amyloid plaques and tau tangles. The Discussion reports increased Aβ production, tau phosphorylation, and GABAergic neuron degeneration in apoE4 cultures. The passages do not address neuroinflammation, so that part of the claim is unsupported by this source. Page numbers were not available in our copy. (LLM, conf=0.87)
- Partly supportedcites [7] Shi, Y. et al. ApoE4 markedly exacerbates tau-mediated neurodegeneration in a mouse model of tauopathy. Nature 549, 523–527 (2017). sourceExperimental — accuracy not yet measured
The paper’s Abstract reports greater Aβ pathology with ApoE4 and, in P301S tau mice, higher tau levels, markedly greater brain atrophy, and more neuroinflammation. It does not establish that ApoE4 increases Tau tangles specifically; it reports tau redistribution and distinct phosphorylated-tau staining patterns instead. The mouse findings are also not direct evidence for every listed pathology in human AD. (LLM, conf=0.84)
- Partly supportedcites [8] Brecht, W. J. et al. Neuron-specific apolipoprotein E4 proteolysis is associated with increased tau phosphorylation in brains of transgenic mice. J. Neurosci. 24, 2527–2534 (2004). sourceExperimental — accuracy not yet measured
The Introduction (page not provided) discusses amyloid-beta plaque formation as a proposed APOE4 mechanism and reports neurodegeneration and NFT-like inclusions associated with apoE fragments. The Results section on p-tau-containing inclusions (page not provided) finds more such inclusions in apoE4 than apoE3 mice. The paper does not establish that APOE4 exacerbates amyloid-beta plaques, and the passages found do not address neuroinflammation. (LLM, conf=0.88)
- Partly supportedcites [9] Andrews-Zwilling, Y. et al. Apolipoprotein E4 causes age- and Tau-dependent impairment of GABAergic interneurons, leading to learning and memory deficits in mice. J. Neurosci. 30, 13707–13717 (2010). sourceExperimental — accuracy not yet measured
The Results section (page not provided) reports neurodegeneration and phosphorylated-Tau pathology in mice expressing an apoE4 fragment. The Introduction (page not provided) says apoE4 colocalizes with amyloid plaques and neurofibrillary tangles, but that does not establish that it exacerbates either. The passages do not report exacerbated neuroinflammation. (LLM, conf=0.88)
- Partly supportedcites [10] Li, G. et al. GABAergic interneuron dysfunction impairs hippocampal neurogenesis in adult apolipoprotein E4 knockin mice. Cell Stem Cell 5, 634–645 (2009). sourceExperimental — accuracy not yet measured
The Results report increased tau phosphorylation and reduced neuronal survival in apoE4 knock-in mouse cultures; the Discussion links apoE4 neurotoxicity to neurodegeneration and describes a pathway to neurofibrillary tangles (page numbers unavailable). The passages do not establish that APOE4 exacerbates amyloid-beta plaques or neuroinflammation, and the study measures tau phosphorylation rather than tangle burden. (LLM, conf=0.88)
- Partly supportedcites [11] Shi, Y. et al. Microglia drive APOE-dependent neurodegeneration in a tauopathy mouse model. J. Exp. Med. 216, 2546–2561 (2019). sourceExperimental — accuracy not yet measured
The Introduction says apoE4 significantly exacerbated neurodegeneration in P301S tauopathy mice. The Results link apoE to phosphorylated-tau pathology and show greater microglial activation in apoE4 mice than in apoE-deficient mice. The paper does not show that APOE4 exacerbates amyloid-β plaques, and its tau findings concern tau pathology rather than specifically demonstrating more tangles. (LLM, conf=0.88)
- Partly supportedcites [12] Strittmatter, W. J. et al. Apolipoprotein E: high-avidity binding to beta-amyloid and increased frequency of type 4 allele in late-onset familial Alzheimer disease. Proc. Natl Acad. Sci. USA 90, 1977–1981 (1993). sourceExperimental — accuracy not yet measured
The Abstract reports that ApoE binds amyloid-beta and is present in senile plaques and neurofibrillary tangles; it also reports an association between APOE-e4 and late-onset familial Alzheimer disease. The passage labeled MATERIALS AND METHODS suggests a possible role for ApoE-E4 but does not establish that this isoform exacerbates those lesions. The cited passages do not support exacerbation of neurodegeneration or neuroinflammation. Page numbers are unavailable in our copy. (LLM, conf=0.88)
- Partly supportedcites [13] Therriault, J. et al. APOEε4 potentiates the relationship between amyloid-β and tau pathologies. Mol. Psychiatry 26, 5977–5988 (2021). sourceExperimental — accuracy not yet measured
The Introduction links APOEε4 to increased amyloid-β burden and reports associations with inflammation and neurodegeneration in mouse models. The Results and Discussion support a stronger relationship between amyloid-β and tau pathology in APOEε4 carriers. The paper does not establish that APOEε4 exacerbates neuroinflammation or neurodegeneration generally; its statement about those outcomes is limited to an association reported in mouse models. Page numbers are unavailable in our copy. (LLM, conf=0.86)
plaindirect- Asserted: passes — The authors put it forward as true.
- Checkable: passes — It can be checked against evidence.
- Load-bearing: passes — The paper’s conclusions depend on it.
- Based: passes — The paper gives a reason why it holds.
Every source the paper cites for this claim was checked and supports it.
In the paper
“As reported previously6, the E4 neuron culture had a lower fraction of GABA+ inhibitory neurons than the E3 neuron culture (Supplementary Fig. 2c,d).”
§ The APOE-R136S mutation protects against APOE4-driven Tau pathology, neurodegeneration and neuroinflammation > Results > Generating isogenic E4-S/S and E4-R/S hiPSC lines
What the sources say
- Supportedcites [6] Wang, C. et al. Gain of toxic apolipoprotein E4 effects in human iPSC-derived neurons is ameliorated by a small-molecule structure corrector. Nat. Med. 24, 647–657 (2018). source
The Results section reports significantly fewer GABA-positive neurons in apoE4/4-hiPSC-derived cultures than in apoE3/3-hiPSC-derived cultures. The Online Methods also report a lower GABA-positive percentage in apoE4/4 than apoE3/3 neuronal cultures. Page numbers were not provided in our copy. (LLM, conf=0.93)
plaincorrelational- Asserted: passes — The authors put it forward as true.
- Checkable: passes — It can be checked against evidence.
- Load-bearing: unclear — It is unclear whether the paper’s conclusions depend on it.
- Based: passes — The paper gives a reason why it holds.
- Supported
The cited sources support only part of this claim — read each source’s verdict below.
In the paper
“The reported patient was protected from the clinical effects of PSEN1-E280A, a highly penetrant mutation causing EOAD dementia41,42, for 28 years by the homozygous APOE3-R136S mutation36.”
§ The APOE-R136S mutation protects against APOE4-driven Tau pathology, neurodegeneration and neuroinflammation > Main
What the sources say
- Partly supportedcites [36] Arboleda-Velasquez, J. F. et al. Resistance to autosomal dominant Alzheimer’s disease in an APOE3 Christchurch homozygote: a case report. Nat. Med. 25, 1680–1683 (2019). sourceExperimental — accuracy not yet measured
The case-report text (section labeled Abstract; page unavailable) says the PSEN1 E280A carrier had two copies of APOE3 Christchurch (R136S) and did not develop mild cognitive impairment until her seventies, nearly three decades after the typical onset age. It identifies APOE3ch homozygosity as the most likely genetic modifier, but omits her exact age and acknowledges that other factors could have contributed. Thus, neither precisely 28 years nor protection caused solely by APOE3-R136S is established. (LLM, conf=0.88)
- Supportedcites [41] Quiroz, Y. T. et al. Association between amyloid and tau accumulation in young adults with autosomal dominant Alzheimer disease. JAMA Neurol. 75, 548–556 (2018). source
The Abstract identifies PSEN1 E280A carriers in an autosomal dominant Alzheimer disease kindred, and the Discussion reports dementia onset at a mean age of 49 years and says carriers develop Alzheimer disease with virtual certainty. This supports the early-onset, highly penetrant mutation description to which citations 41 and 42 are attached. The separate APOE3-R136S and 28-year protection claim is attached to citation 36, not this source. (LLM, conf=0.91)
- Not checked — no full text of the sourcecites [42] Lemere, C. A. et al. The E280A presenilin 1 Alzheimer mutation produces increased Aβ 42 deposition and severe cerebellar pathology. Nat. Med. 2, 1146–1150 (1996). source
plaindirectSingle case- Asserted: passes — The authors put it forward as true.
- Checkable: passes — It can be checked against evidence.
- Load-bearing: passes — The paper’s conclusions depend on it.
- Based: passes — The paper gives a reason why it holds.
- Partly supported
The cited sources support only part of this claim — read each source’s verdict below.
In the paper
“Recent findings show that cell surface HSPGs mediate a large portion of neuronal uptake of Tau monomers and aggregates46,57.”
§ The APOE-R136S mutation protects against APOE4-driven Tau pathology, neurodegeneration and neuroinflammation > Results > E4-S/S reduces HSPG-mediated Tau uptake by human neurons
What the sources say
- Partly supportedcites [46] Rauch, J. N. et al. Tau internalization is regulated by 6-O sulfation on heparan sulfate proteoglycans (HSPGs). Sci. Rep. 8, 6382 (2018). sourceExperimental — accuracy not yet measured
The Results (Functional genomics to find modulators of tau uptake; page unavailable) report that knockdown of HSPG-related genes reduced monomer uptake by over 50% and also reduced oligomer uptake; the knockdowns reduced tau uptake in iPS-derived neurons. But the Results (Internalization of tau in CNS culture is regulated by quaternary structure; page unavailable) say intact fibrils were not efficiently internalized, so the unqualified reference to aggregates is broader than the evidence supports. (LLM, conf=0.85)
- Partly supportedcites [57] Holmes, B. B. et al. Heparan sulfate proteoglycans mediate internalization and propagation of specific proteopathic seeds. Proc. Natl Acad. Sci. USA 110, E3138–E3147 (2013). sourceExperimental — accuracy not yet measured
The Discussion reports that HSPGs mediate tau aggregate uptake into neurons in vitro and in vivo. The Results distinguish fibrils from monomers, stating that tau repeat-domain fibrils, but not monomers, are readily internalized into neural precursor cells. This source therefore supports the aggregate portion of the claim, but not HSPG-mediated neuronal uptake of tau monomers. (LLM, conf=0.90)
plaindirect- Asserted: passes — The authors put it forward as true.
- Checkable: passes — It can be checked against evidence.
- Load-bearing: passes — The paper’s conclusions depend on it.
- Based: passes — The paper gives a reason why it holds.
- Partly supported
The cited sources support only part of this claim — read each source’s verdict below.
In the paper
“A major functional effect of the R136S mutation is disruption of its binding to anionic HSPGs on cell surface36,45.”
§ The APOE-R136S mutation protects against APOE4-driven Tau pathology, neurodegeneration and neuroinflammation > Main
What the sources say
- Partly supportedcites [36] Arboleda-Velasquez, J. F. et al. Resistance to autosomal dominant Alzheimer’s disease in an APOE3 Christchurch homozygote: a case report. Nat. Med. 25, 1680–1683 (2019). sourceExperimental — accuracy not yet measured
The paper reports that APOE3 Christchurch (R136S) had the lowest heparin-binding ability among the APOE isoforms tested (Abstract; page unavailable). The Methods describe an in vitro heparin-column assay, not a measurement of binding to HSPGs on cell surfaces. Thus, reduced binding is supported, but disruption of cell-surface HSPG binding is not directly established. (LLM, conf=0.85)
- Partly supportedcites [45] Wardell, M. R., Brennan, S. O., Janus, E. D., Fraser, R. & Carrell, R. W. Apolipoprotein E2-Christchurch (136 Arg–Ser). New variant of human apolipoprotein E in a patient with type III hyperlipoproteinemia. J. Clin. Invest. 80, 483–490 (1987). sourceExperimental — accuracy not yet measured
The Results identify the Arg136→Ser substitution, and the Discussion says it could alter receptor binding. But the Discussion does not establish disrupted binding to cell-surface HSPGs; its preliminary heparin-affinity comparison was with another APOE2 variant under denaturing conditions. (LLM, conf=0.84)
plaindirect- Asserted: passes — The authors put it forward as true.
- Checkable: passes — It can be checked against evidence.
- Load-bearing: passes — The paper’s conclusions depend on it.
- Based: passes — The paper gives a reason why it holds.
- Partly supported
Every source the paper cites for this claim was checked and supports it.
In the paper
“Western blotting analysis of cell lysates with PHF1 and AT8 antibodies revealed that the E3 neurons had a significant reduction in p-Tau levels compared to E4 neurons (Fig. 2a,c,d and Supplementary Fig. 3b,c), confirming our previous report6.”
§ The APOE-R136S mutation protects against APOE4-driven Tau pathology, neurodegeneration and neuroinflammation > Results > E4-S/S reduces p-Tau accumulation in human neurons
What the sources say
- Supportedcites [6] Wang, C. et al. Gain of toxic apolipoprotein E4 effects in human iPSC-derived neurons is ameliorated by a small-molecule structure corrector. Nat. Med. 24, 647–657 (2018). source
The Results section, “Phosphorylated tau (p-tau) levels are higher in human apoE4/4 neurons than human apoE3/3 neurons,” reports significantly higher p-tau in E4 than E3 neurons by western blot, including with AT8 and PHF1 antibodies. This supports the citing sentence’s attribution that its E3-versus-E4 finding confirms the previous report. (LLM, conf=0.94)
plaincorrelational- Asserted: passes — The authors put it forward as true.
- Checkable: passes — It can be checked against evidence.
- Load-bearing: passes — The paper’s conclusions depend on it.
- Based: passes — The paper gives a reason why it holds.
- Supported
- It may state two separate claims as one. 52
- Probably not a substantial claim. 53
At least one cited source doesn’t support this claim or points to a different paper, and none confirmed it — see the verdicts below.
In the paper
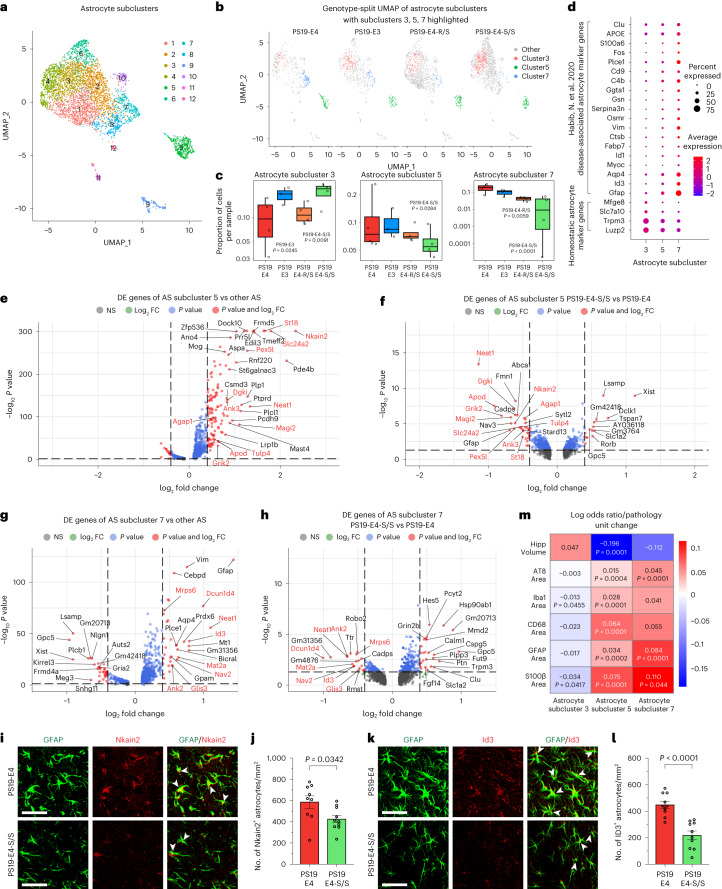
“identified astrocyte subcluster 3 as homeostatic astrocytes and astrocyte subclusters 5 and 7 as disease-associated astrocytes (DAAs), with upregulation of Gfap, Aqp4, Ctsb, Vim, Serpina3a, C4b and Cd9 expression”
§ The APOE-R136S mutation protects against APOE4-driven Tau pathology, neurodegeneration and neuroinflammation > Results > E4-S/S increases disease-protective and decreases disease-associated astrocytes
What the sources say
- Disputedcites [62] Habib, N. et al. Disease-associated astrocytes in Alzheimer’s disease and aging. Nat. Neurosci. 23, 701–706 (2020). sourceExperimental — accuracy not yet measured
The passage describing the six subclusters (labeled Abstract in our copy) identifies clusters 1 and 2 as homeostatic and cluster 4 as DAAs. It identifies clusters 3 and 5 as intermediate states; there is no cluster 7 in that six-cluster scheme. The same section names Serpina3n, rather than Serpina3a, among DAA-upregulated genes. (LLM, conf=0.90)
Checked by a reasoning model — may be wrong.
plaincorrelational- Asserted: passes — The authors put it forward as true.
- Checkable: passes — It can be checked against evidence.
- Load-bearing: passes — The paper’s conclusions depend on it.
- Based: passes — The paper gives a reason why it holds.
It may state two separate claims as one.
- Disputed
Some cited sources support this claim and some don’t — read each source’s verdict below.
In the paper
“Sample sizes for mouse snRNA-seq studies were determined by a power analysis based on effect sizes from our previous studies22,55 and literature.”
§ The APOE-R136S mutation protects against APOE4-driven Tau pathology, neurodegeneration and neuroinflammation > Methods > General statistics and reproducibility
What the sources say
- Disputedcites [22] Zalocusky, K. A. et al. Neuronal ApoE upregulates MHC-I expression to drive selective neurodegeneration in Alzheimer’s disease. Nat. Neurosci. 24, 786–798 (2021). sourceExperimental — accuracy not yet measured
The “Sample size, randomization, and blinding” section (page unavailable) says the authors chose four mice per condition after a literature search identified a field standard of at least three. It describes that basis for the mouse sample size, rather than a power analysis based on prior effect sizes. (LLM, conf=0.86)
Checked by a reasoning model — may be wrong.
- Supportedcites [55] Koutsodendris, N. et al. Neuronal APOE4 removal protects against tau-mediated gliosis, neurodegeneration and myelin deficits. Nat. Aging 3, 275–296 (2023). source
The Methods section, “General statistics and reproducibility,” explicitly states that mouse snRNA-seq sample sizes were determined by a power analysis using effect sizes estimated from previous studies and a literature search. This matches the attributed claim. (LLM, conf=0.95)
plain- Asserted: passes — The authors put it forward as true.
- Checkable: passes — It can be checked against evidence.
- Load-bearing: fails — The paper’s conclusions may not depend on it.
- Based: passes — The paper gives a reason why it holds.
Probably not a substantial claim. The paper’s conclusions may not depend on it.
- Disputed
Every source the paper cites for this claim was checked and supports it.
In the paper
“Additionally, neuronal uptake of exogenous Tau in culture can be competitively inhibited with the addition of heparin46,57.”
§ The APOE-R136S mutation protects against APOE4-driven Tau pathology, neurodegeneration and neuroinflammation > Results > E4-S/S reduces HSPG-mediated Tau uptake by human neurons
What the sources say
- Supportedcites [46] Rauch, J. N. et al. Tau internalization is regulated by 6-O sulfation on heparan sulfate proteoglycans (HSPGs). Sci. Rep. 8, 6382 (2018). source
The Results section, “Cellular internalization of tau is effected by the presence of 6-O-sulfation,” describes adding heparin to the culture medium before exogenous tau and finding that it competitively reduced tau internalization. The authors report that the result also held in iPS-derived neurons (Fig. 4b). (LLM, conf=0.94)
- Supportedcites [57] Holmes, B. B. et al. Heparan sulfate proteoglycans mediate internalization and propagation of specific proteopathic seeds. Proc. Natl Acad. Sci. USA 110, E3138–E3147 (2013). source
The paper’s opening summary states that heparin blocks tau fibril uptake in cultured cells and primary neurons. The Fig. 3 caption (section labeled “Significance”; page unavailable) also reports inhibited tau fibril internalization when heparin was added to cultured cells, consistent with the claimed competition for uptake. (LLM, conf=0.88)
plaindirect- Asserted: passes — The authors put it forward as true.
- Checkable: passes — It can be checked against evidence.
- Load-bearing: passes — The paper’s conclusions depend on it.
- Based: passes — The paper gives a reason why it holds.
Probably not a substantial claim.
- Supported
The cited sources support only part of this claim — read each source’s verdict below.
In the paper
“Intriguingly, over the past decade, HSPGs have been revealed as essential players in the cellular uptake of Tau46–48.”
§ The APOE-R136S mutation protects against APOE4-driven Tau pathology, neurodegeneration and neuroinflammation > Main
What the sources say
- Supportedcites [46] Rauch, J. N. et al. Tau internalization is regulated by 6-O sulfation on heparan sulfate proteoglycans (HSPGs). Sci. Rep. 8, 6382 (2018). source
The Results section (‘Functional genomics to find modulators of tau uptake’; page unavailable) reports that knockdown of genes involved in HSPG biosynthesis reduced tau uptake by more than 50% in cells and also reduced uptake in iPS-derived neurons. The Discussion identifies HSPGs as regulators of tau internalization, supporting the claim that they are important players in cellular uptake. (LLM, conf=0.89)
- Supportedcites [47] Stopschinski, B. E. et al. Specific glycosaminoglycan chain length and sulfation patterns are required for cell uptake of tau vs. α-synuclein and β-amyloid aggregates. J. Biol. Chem. 293, 10826–10840 (2018). source
The “Specific sulfotransferases required for uptake” section reports that knocking out HSPG-related genes strongly reduced tau aggregate uptake. The paper’s summary of its knockout experiments states that HSPGs mediate tau aggregate internalization, supporting the cited claim in the context of tau aggregates. (LLM, conf=0.90)
- Partly supportedcites [48] Holmes, B. B. & Diamond, M. I. Prion-like properties of Tau protein: the importance of extracellular Tau as a therapeutic target. J. Biol. Chem. 289, 19855–19861 (2014). sourceExperimental — accuracy not yet measured
The “Understanding Cell Uptake” section says that HSPGs initiate uptake of Tau aggregate seeds through macropinocytosis, and “Targeting Aggregate Binding to the Cell Surface” says Tau aggregates enter cells via HSPGs. The claim omits the aggregate qualifier: the paper says Tau monomers bind HSPGs but do not trigger uptake through this mechanism. (LLM, conf=0.85)
boosteddirect- Asserted: passes — The authors put it forward as true.
- Checkable: passes — It can be checked against evidence.
- Load-bearing: passes — The paper’s conclusions depend on it.
- Based: passes — The paper gives a reason why it holds.
Probably not a substantial claim.
- Supported
Every source the paper cites for this claim was checked and supports it.
In the paper
“hiPSC lines were then differentiated into neurons expressing mature neuronal marker MAP2 (Extended Data Fig. 3c) via an optimized method using dual-SMAD inhibition6,56.”
§ The APOE-R136S mutation protects against APOE4-driven Tau pathology, neurodegeneration and neuroinflammation > Results > Generating isogenic E4-S/S and E4-R/S hiPSC lines
What the sources say
- Supportedcites [6] Wang, C. et al. Gain of toxic apolipoprotein E4 effects in human iPSC-derived neurons is ameliorated by a small-molecule structure corrector. Nat. Med. 24, 647–657 (2018). source
The Online Methods section, “Neuronal Differentiation of hiPSCs and miPSCs,” describes differentiating hiPSCs using inhibitors of both TGF-β and BMP receptors, consistent with dual-SMAD inhibition. The Results section, “Generating hiPSC lines from apoE3 and apoE4 homozygotes,” reports that the resulting mature neurons expressed MAP2. Page numbers are not provided in our copy. (LLM, conf=0.93)
- Supportedcites [56] Najm, R. et al. In vivo chimeric Alzheimer’s disease modeling of apolipoprotein E4 toxicity in human neurons. Cell Rep. 32, 107962 (2020). source
The Results section reports that the hiPSC lines were differentiated into neurons that expressed MAP2. The Methods section describes differentiation using SB and LDN, and the paper identifies its established neural-conversion method as dual inhibition of SMAD signaling (page numbers unavailable). (LLM, conf=0.90)
plain- Asserted: passes — The authors put it forward as true.
- Checkable: passes — It can be checked against evidence.
- Load-bearing: passes — The paper’s conclusions depend on it.
- Based: passes — The paper gives a reason why it holds.
Probably not a substantial claim.
- Supported
Every source the paper cites for this claim was checked and supports it.
In the paper
“Immunocytochemistry analysis confirmed that MAP2+ neurons expressed APOE (Supplementary Fig. 2a), as reported previously6.”
§ The APOE-R136S mutation protects against APOE4-driven Tau pathology, neurodegeneration and neuroinflammation > Results > Generating isogenic E4-S/S and E4-R/S hiPSC lines
What the sources say
- Supportedcites [6] Wang, C. et al. Gain of toxic apolipoprotein E4 effects in human iPSC-derived neurons is ameliorated by a small-molecule structure corrector. Nat. Med. 24, 647–657 (2018). source
The Results section, “The gain of toxic effects of apoE4 is neuron specific” (page unavailable), reports apoE expression in hiPSC-derived neurons confirmed by double immunostaining for apoE and a neuronal marker. The Immunocytochemical Analysis methods (page unavailable) list both MAP2 and apoE antibodies, supporting the cited observation that MAP2+ neurons expressed APOE. (LLM, conf=0.90)
plain- Asserted: passes — The authors put it forward as true.
- Checkable: passes — It can be checked against evidence.
- Load-bearing: fails — The paper’s conclusions may not depend on it.
- Based: passes — The paper gives a reason why it holds.
Probably not a substantial claim. The paper’s conclusions may not depend on it.
- Supported
The cited sources support only part of this claim — read each source’s verdict below.
In the paper
“This patient displayed extremely high Aβ pathology but minimal Tau burden, hippocampal atrophy and neuroinflammation36,43,44.”
§ The APOE-R136S mutation protects against APOE4-driven Tau pathology, neurodegeneration and neuroinflammation > Main
What the sources say
- Partly supportedcites [36] Arboleda-Velasquez, J. F. et al. Resistance to autosomal dominant Alzheimer’s disease in an APOE3 Christchurch homozygote: a case report. Nat. Med. 25, 1680–1683 (2019). sourceExperimental — accuracy not yet measured
The Abstract reports unusually high Aβ plaque burden and relatively limited tau burden. It does not establish minimal hippocampal atrophy: the patient’s hippocampal-to-whole-brain volume was within the range of mutation carriers who developed mild cognitive impairment in their forties. Our copy does not report a neuroinflammation measurement (searched: neuroinflammation, inflammatory, microglia). (LLM, conf=0.88)
- Partly supportedcites [43] Sepulveda-Falla, D. et al. Distinct tau neuropathology and cellular profiles of an APOE3 Christchurch homozygote protected against autosomal dominant Alzheimer’s dementia. Acta Neuropathol. 144, 589–601 (2022). sourceExperimental — accuracy not yet measured
The Results (Neuroimaging findings; page not provided) report very high Aβ burden and relative sparing of tau in some cortical regions. But the Results (Neuropathological findings) classify the case as Braak VI with high hippocampal tau, and the paper reports greater global atrophy and active inflammatory processes rather than establishing minimal hippocampal atrophy or neuroinflammation. (LLM, conf=0.88)
- Not checked — no full text of the sourcecites [44] Zalocusky, K. A., Nelson, M. R. & Huang, Y. An Alzheimer’s-disease-protective APOE mutation. Nat. Med. 25, 1648–1649 (2019). source
plainSingle case- Asserted: passes — The authors put it forward as true.
- Checkable: passes — It can be checked against evidence.
- Load-bearing: passes — The paper’s conclusions depend on it.
- Based: passes — The paper gives a reason why it holds.
It may state two separate claims as one.
- Partly supported
Every source the paper cites for this claim was checked and supports it.
In the paper
“Some neurons and oligodendrocytes also express APOE”
§ The APOE-R136S mutation protects against APOE4-driven Tau pathology, neurodegeneration and neuroinflammation > Results > E4-S/S rescues transcriptomic changes in neurons and oligodendrocytes
What the sources say
- Supportedcites [22] Zalocusky, K. A. et al. Neuronal ApoE upregulates MHC-I expression to drive selective neurodegeneration in Alzheimer’s disease. Nat. Neurosci. 24, 786–798 (2021). source
The Results report apoE expression in human neurons and describe correlations between apoE expression and cellular pathways in oligodendrocytes in apoE knock-in mice. Together, these passages support the statement that some neurons and oligodendrocytes express APOE. Page numbers are not provided in our copy. (LLM, conf=0.89)
- Supportedcites [55] Koutsodendris, N. et al. Neuronal APOE4 removal protects against tau-mediated gliosis, neurodegeneration and myelin deficits. Nat. Aging 3, 275–296 (2023). source
The Results section reports that some neurons expressed APOE in the studied mice. It also identifies an oligodendrocyte cluster with high APOE expression, supporting the claim about both cell types. (LLM, conf=0.93)
plain- Asserted: passes — The authors put it forward as true.
- Checkable: passes — It can be checked against evidence.
- Load-bearing: fails — The paper’s conclusions may not depend on it.
- Based: passes — The paper gives a reason why it holds.
Probably not a substantial claim. The paper’s conclusions may not depend on it.
- Supported
Every source the paper cites for this claim was checked and supports it.
In the paper
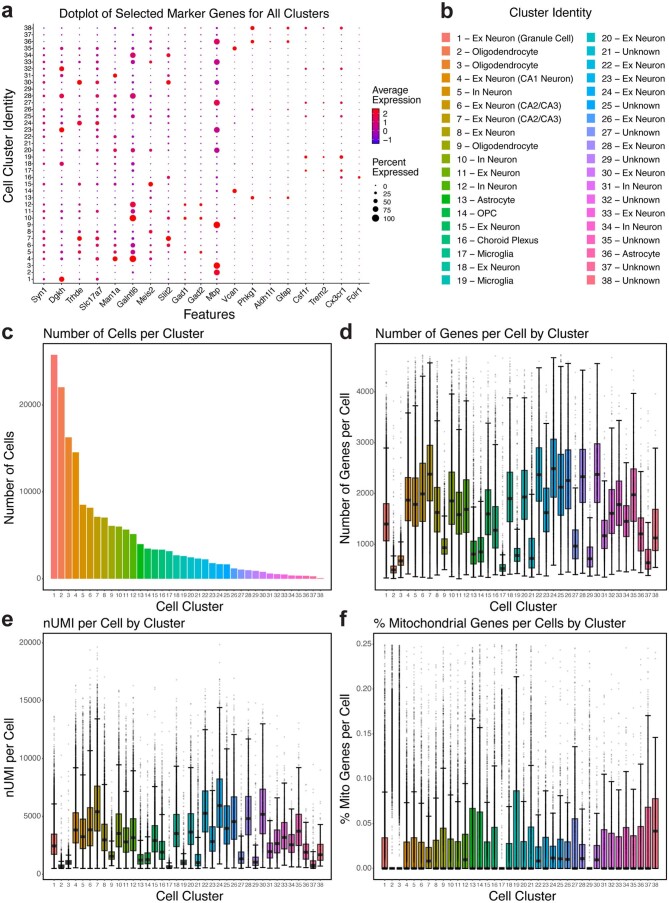
“Unsupervised clustering by the Louvain algorithm60 and visualization by uniform manifold approximation and projection (UMAP) produced 38 distinct cell clusters”
§ The APOE-R136S mutation protects against APOE4-driven Tau pathology, neurodegeneration and neuroinflammation > Results > E4-S/S rescues transcriptomic changes in neurons and oligodendrocytes
What the sources say
- Supportedcites [60] Blondel, V. D., Guillaume, J.-L., Lambiotte, R. & Lefebvre, E. Fast unfolding of communities in large networks. J. Stat. Mech. 2008, P10008 (2008). source
The citation is attached specifically to the Louvain algorithm, not to UMAP or the reported 38 cell clusters. The cited paper’s Method section introduces the network community-detection algorithm, so it supports this identification citation. The indexed passage provides no page number. (LLM, conf=0.91)
plain- Asserted: passes — The authors put it forward as true.
- Checkable: passes — It can be checked against evidence.
- Load-bearing: fails — The paper’s conclusions may not depend on it.
- Based: passes — The paper gives a reason why it holds.
Probably not a substantial claim. The paper’s conclusions may not depend on it.
- Supported
The cited sources support only part of this claim — read each source’s verdict below.
In the paper
“The protection conferred by APOE3-R136S against EOAD caused by the PSEN1-E280A mutation is a milestone discovery36.”
§ The APOE-R136S mutation protects against APOE4-driven Tau pathology, neurodegeneration and neuroinflammation > Discussion
What the sources say
- Partly supportedcites [36] Arboleda-Velasquez, J. F. et al. Resistance to autosomal dominant Alzheimer’s disease in an APOE3 Christchurch homozygote: a case report. Nat. Med. 25, 1680–1683 (2019). sourceExperimental — accuracy not yet measured
The Abstract reports a PSEN1 E280A carrier with two copies of APOE3 Christchurch (R136S) who developed symptoms nearly three decades later than expected. It identifies APOE3ch as the best candidate genetic modifier, but acknowledges that other factors could have contributed; the paper does not establish that R136S itself confers protection generally. “Milestone discovery” is the citing authors’ characterization. (LLM, conf=0.87)
boosteddirect- Asserted: passes — The authors put it forward as true.
- Checkable: fails — It may be too vague to check against evidence.
- Load-bearing: fails — The paper’s conclusions may not depend on it.
- Based: passes — The paper gives a reason why it holds.
Probably not a substantial claim. It may be too vague to check against evidence. The paper’s conclusions may not depend on it.
- Partly supported
Every source the paper cites for this claim was checked and supports it.
In the paper
“The interactive effects of Tau pathology and gliosis on neurodegeneration were studied previously64”
§ The APOE-R136S mutation protects against APOE4-driven Tau pathology, neurodegeneration and neuroinflammation > Discussion
What the sources say
- Supportedcites [64] Leyns, C. E. G. & Holtzman, D. M. Glial contributions to neurodegeneration in tauopathies. Mol. Neurodegener. 12, 50 (2017). source
The Background says the review summarizes prior literature on the effects of gliosis on tau pathology and vice versa, including mechanisms affecting neurodegeneration. The Conclusions also describe how tau pathology and gliosis combine to drive neurodegeneration in Alzheimer’s disease. (LLM, conf=0.93)
plaincorrelational- Asserted: passes — The authors put it forward as true.
- Checkable: passes — It can be checked against evidence.
- Load-bearing: fails — The paper’s conclusions may not depend on it.
- Based: passes — The paper gives a reason why it holds.
Probably not a substantial claim. The paper’s conclusions may not depend on it.
- Supported
Every source the paper cites for this claim was checked and supports it.
In the paper
“The original case report detailed protection of the APOE3-R136S mutation against autosomal-dominant AD, particularly in the face of extremely high Aβ burden36.”
§ The APOE-R136S mutation protects against APOE4-driven Tau pathology, neurodegeneration and neuroinflammation > Discussion
What the sources say
- Supportedcites [36] Arboleda-Velasquez, J. F. et al. Resistance to autosomal dominant Alzheimer’s disease in an APOE3 Christchurch homozygote: a case report. Nat. Med. 25, 1680–1683 (2019). source
The case report describes a PSEN1 mutation carrier homozygous for APOE3 Christchurch (R136S) who remained free of clinical impairment until her seventies despite unusually high brain amyloid (Abstract; page not provided). It identifies the variant as a potentially protective modifier, while acknowledging that other factors could have contributed. (LLM, conf=0.90)
plaindirectSingle case- Asserted: passes — The authors put it forward as true.
- Checkable: passes — It can be checked against evidence.
- Load-bearing: fails — The paper’s conclusions may not depend on it.
- Based: passes — The paper gives a reason why it holds.
Probably not a substantial claim. The paper’s conclusions may not depend on it.
- Supported
The cited sources support only part of this claim — read each source’s verdict below.
In the paper
“To further increase on-target efficiency and minimize off-target editing, S.p. HiFi Cas9 Nuclease was used77.”
§ The APOE-R136S mutation protects against APOE4-driven Tau pathology, neurodegeneration and neuroinflammation > Methods > Generating and characterizing isogenic E4-S/S and E4-R/S hiPSC lines by CRISPR–Cas-9-mediated gene editing
What the sources say
- Partly supportedcites [77] Vakulskas, C. A. et al. A high-fidelity Cas9 mutant delivered as a ribonucleoprotein complex enables efficient gene editing in human hematopoietic stem and progenitor cells. Nat. Med. 24, 1216–1224 (2018). sourceExperimental — accuracy not yet measured
The Introduction reports that HiFi Cas9 reduces off-target editing while maintaining high on-target activity. The Results section on RNP delivery reports on-target efficiency averaging 92% of wild-type Cas9, not an increase over wild type. It does report higher on-target efficiency than the other high-fidelity mutants tested, so the efficiency claim depends on the comparator. (LLM, conf=0.86)
plaindirect- Asserted: passes — The authors put it forward as true.
- Checkable: passes — It can be checked against evidence.
- Load-bearing: fails — The paper’s conclusions may not depend on it.
- Based: passes — The paper gives a reason why it holds.
Probably not a substantial claim. The paper’s conclusions may not depend on it. It may state two separate claims as one.
- Partly supported
Every source the paper cites for this claim was checked and supports it.
In the paper
“CRISPOR was used to predict all potential off-target sites in the genome72, and those sites located in exon regions on chromosome 7 were verified to be intact by Sanger sequencing.”
§ The APOE-R136S mutation protects against APOE4-driven Tau pathology, neurodegeneration and neuroinflammation > Methods > Generation of APOE4-R136S knock-in mice by CRISPR–Cas-9-mediated gene editing
What the sources say
- Supportedcites [72] Haeussler, M. et al. Evaluation of off-target and on-target scoring algorithms and integration into the guide RNA selection tool CRISPOR. Genome Biol. 17, 148 (2016). source
The Methods section (‘Tool implementation and source code availability’) says CRISPOR retrieves genomic hits and reports predicted off-targets, supporting its identification as the prediction tool. The citation is attached to the CRISPOR prediction clause; the chromosome 7 Sanger-sequencing verification is described as the citing authors’ own step, not attributed to this source. (LLM, conf=0.90)
plain- Asserted: passes — The authors put it forward as true.
- Checkable: passes — It can be checked against evidence.
- Load-bearing: unclear — It is unclear whether the paper’s conclusions depend on it.
- Based: passes — The paper gives a reason why it holds.
It may state two separate claims as one.
- Supported
A result the paper reports from its own data — it cites no other source for it, so there is none to check. The quote shows it is in the paper.
In the paper
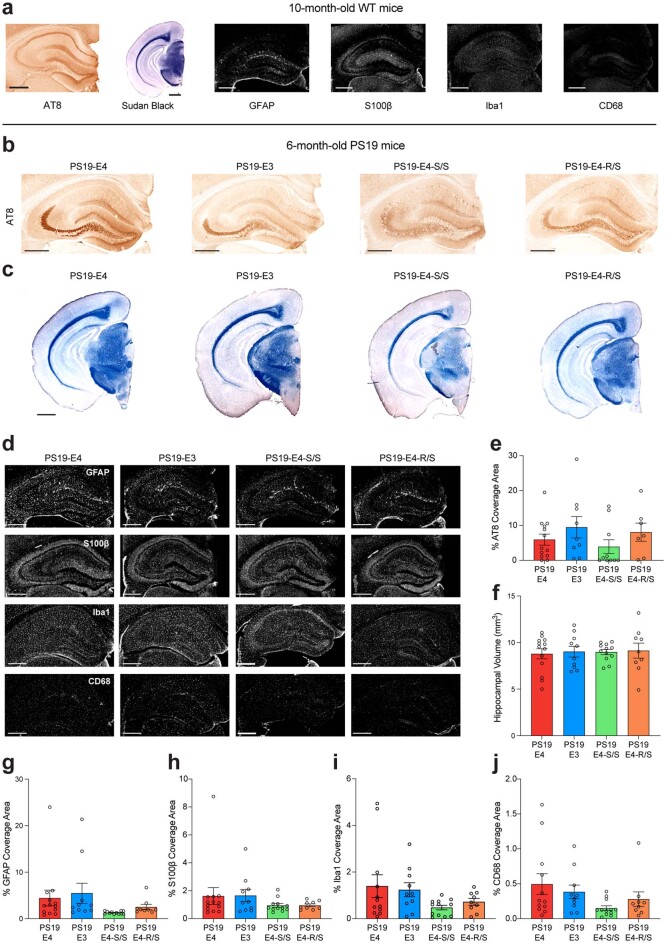
“No significant difference was observed in p-Tau pathology across various APOE genotype groups of 6-month-old mice, although PS19-E4-S/S mice had a trend toward lower p-Tau pathology (Extended Data Fig. 2b,e).”
§ The APOE-R136S mutation protects against APOE4-driven Tau pathology, neurodegeneration and neuroinflammation > Results > E4-S/S reduces Tau pathology in tauopathy mice
plain- Asserted: passes — The authors put it forward as true.
- Checkable: passes — It can be checked against evidence.
- Load-bearing: unclear — It is unclear whether the paper’s conclusions depend on it.
- Based: passes — The paper gives a reason why it holds.
It may state two separate claims as one.
- Rests on an assumption: The PS19 tauopathy mouse model crossed with human APOE4-KI mice recapitulates APOE4-driven AD tau pathology sufficiently to test protection by R136S.
A result the paper reports from its own data — it cites no other source for it, so there is none to check. The quote shows it is in the paper.
In the paper
“Again, PS19-E4-S/S mice, but not PS19-E4-R/S mice, had significantly reduced p-Tau levels as compared to PS19-E4 mice at 10 months of age (Fig. 1d–f).”
§ The APOE-R136S mutation protects against APOE4-driven Tau pathology, neurodegeneration and neuroinflammation > Results > E4-S/S reduces Tau pathology in tauopathy mice
plain- Asserted: passes — The authors put it forward as true.
- Checkable: passes — It can be checked against evidence.
- Load-bearing: passes — The paper’s conclusions depend on it.
- Based: passes — The paper gives a reason why it holds.
It may state two separate claims as one.
- Rests on an assumption: The PS19 tauopathy mouse model crossed with human APOE4-KI mice recapitulates APOE4-driven AD tau pathology sufficiently to test protection by R136S.
A result the paper reports from its own data — it cites no other source for it, so there is none to check. The quote shows it is in the paper.
In the paper
“The PS19-E4-S/S mice displayed the lowest fraction of type 4 p-Tau staining (~10%) and showed similar levels of enrichment of type 1 and type 2 staining to PS19-E3 mice (Fig. 1h).”
§ The APOE-R136S mutation protects against APOE4-driven Tau pathology, neurodegeneration and neuroinflammation > Results > E4-S/S reduces Tau pathology in tauopathy mice
plain- Asserted: passes — The authors put it forward as true.
- Checkable: passes — It can be checked against evidence.
- Load-bearing: passes — The paper’s conclusions depend on it.
- Based: passes — The paper gives a reason why it holds.
It may state two separate claims as one.
- Rests on an assumption: The PS19 tauopathy mouse model crossed with human APOE4-KI mice recapitulates APOE4-driven AD tau pathology sufficiently to test protection by R136S.
A result the paper reports from its own data — it cites no other source for it, so there is none to check. The quote shows it is in the paper.
In the paper
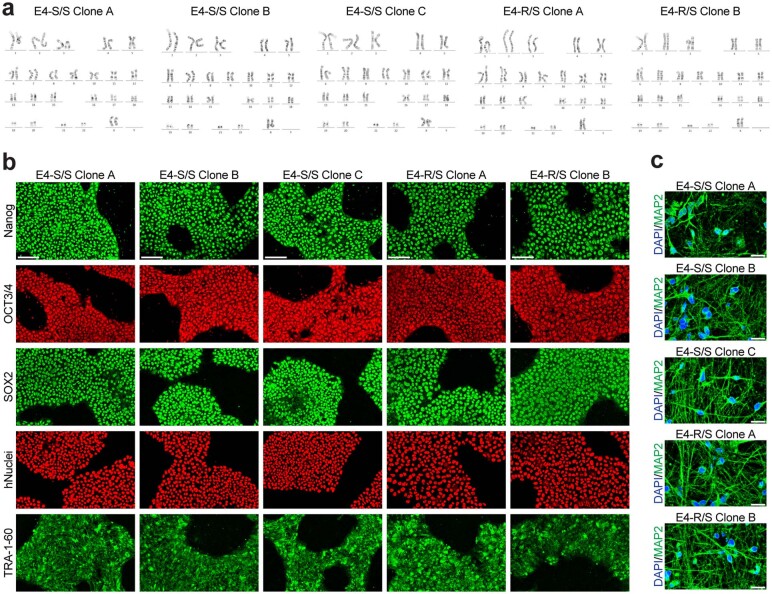
“Both the E4-S/S and E4-R/S neuronal cultures showed normal morphology, neurite outgrowth pattern and viability (Extended Data Fig. 3c).”
§ The APOE-R136S mutation protects against APOE4-driven Tau pathology, neurodegeneration and neuroinflammation > Results > Generating isogenic E4-S/S and E4-R/S hiPSC lines
plain- Asserted: passes — The authors put it forward as true.
- Checkable: passes — It can be checked against evidence.
- Load-bearing: fails — The paper’s conclusions may not depend on it.
- Based: passes — The paper gives a reason why it holds.
Probably not a substantial claim. The paper’s conclusions may not depend on it. It may state two separate claims as one.
A result the paper reports from its own data — it cites no other source for it, so there is none to check. The quote shows it is in the paper.
In the paper
“Notably, the PS19-E4-R/S mice still showed roughly 90% type 3 or type 4 p-Tau staining (Fig. 1h), with a slight preference for type 3 over type 4 p-Tau staining as compared to PS19-E4 mice, possibly indicating a slight slowing of APOE4-driven progression of p-Tau pathology.”
§ The APOE-R136S mutation protects against APOE4-driven Tau pathology, neurodegeneration and neuroinflammation > Results > E4-S/S reduces Tau pathology in tauopathy mice
hedgedcorrelational- Asserted: passes — The authors put it forward as true.
- Checkable: passes — It can be checked against evidence.
- Load-bearing: unclear — It is unclear whether the paper’s conclusions depend on it.
- Based: passes — The paper gives a reason why it holds.
It may state two separate claims as one.
- Rests on an assumption: The PS19 tauopathy mouse model crossed with human APOE4-KI mice recapitulates APOE4-driven AD tau pathology sufficiently to test protection by R136S.
A result the paper reports from its own data — it cites no other source for it, so there is none to check. The quote shows it is in the paper.
In the paper
“Unsurprisingly, we observed minimal AT8 immunopositivity in 10-month-old wild-type (WT) control mice (Fig. 1c and Extended Data Fig. 2a).”
§ The APOE-R136S mutation protects against APOE4-driven Tau pathology, neurodegeneration and neuroinflammation > Results > E4-S/S reduces Tau pathology in tauopathy mice
plain- Asserted: passes — The authors put it forward as true.
- Checkable: passes — It can be checked against evidence.
- Load-bearing: fails — The paper’s conclusions may not depend on it.
- Based: passes — The paper gives a reason why it holds.
Probably not a substantial claim. The paper’s conclusions may not depend on it.
A result the paper reports from its own data — it cites no other source for it, so there is none to check. The quote shows it is in the paper.
In the paper
“Although PS19-E4-R/S mice showed a significant reduction in GFAP coverage area (Extended Data Fig. 5a) and cell number (Fig. 5a,b) compared to PS19-E4 mice, they still had significantly higher GFAP immunostaining than PS19-E4-S/S mice (Fig. 5a,b and Extended Data Fig. 5a).”
§ The APOE-R136S mutation protects against APOE4-driven Tau pathology, neurodegeneration and neuroinflammation > Results > E4-S/S reduces astrocytosis in tauopathy mice
plain- Asserted: passes — The authors put it forward as true.
- Checkable: passes — It can be checked against evidence.
- Load-bearing: passes — The paper’s conclusions depend on it.
- Based: passes — The paper gives a reason why it holds.
It may state two separate claims as one.
- Rests on an assumption: The PS19 tauopathy mouse model crossed with human APOE4-KI mice recapitulates APOE4-driven AD tau pathology sufficiently to test protection by R136S.
A result the paper reports from its own data — it cites no other source for it, so there is none to check. The quote shows it is in the paper.
In the paper
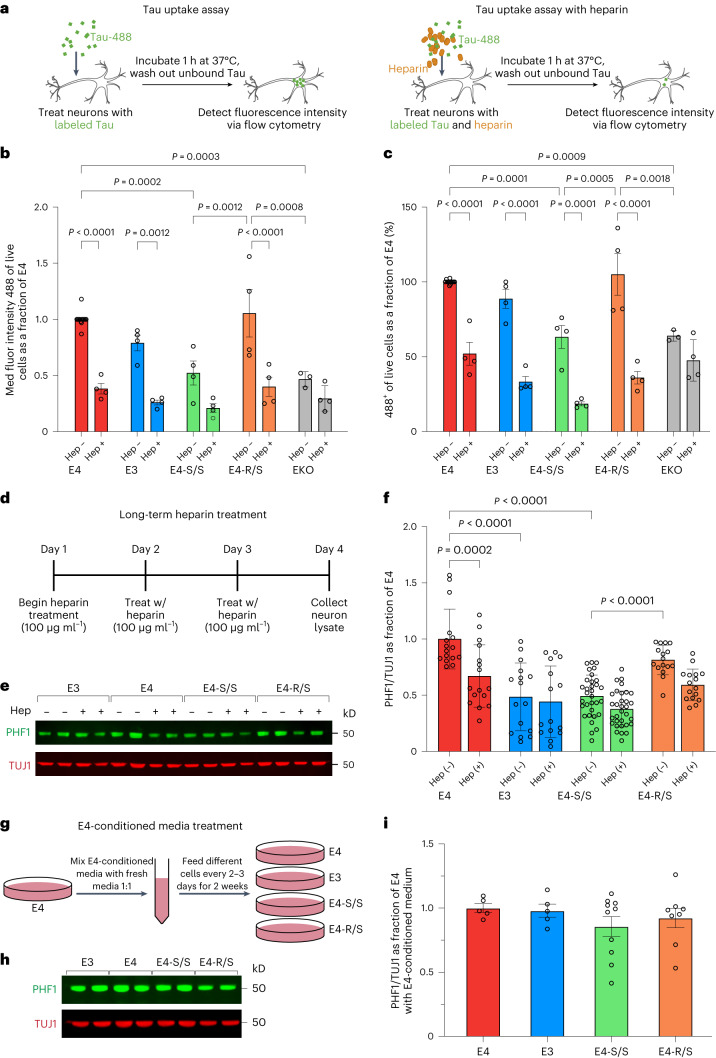
“Remarkably, this treatment lowered endogenous p-Tau levels in E4 neurons by approximately 25%, similar to those seen in untreated E4-S/S neurons (Fig. 3f).”
§ The APOE-R136S mutation protects against APOE4-driven Tau pathology, neurodegeneration and neuroinflammation > Results > Defective HSPG binding of E4-S/S protects against p-Tau accumulation
plaindirect- Asserted: passes — The authors put it forward as true.
- Checkable: passes — It can be checked against evidence.
- Load-bearing: passes — The paper’s conclusions depend on it.
- Based: passes — The paper gives a reason why it holds.
It may state two separate claims as one.
A result the paper reports from its own data — it cites no other source for it, so there is none to check. The quote shows it is in the paper.
In the paper
“Tau pathology significantly correlated with only CD68+ (active) microgliosis (Supplementary Fig. 6d) but not Iba1+ (general) microgliosis (Supplementary Fig. 6c)”
§ The APOE-R136S mutation protects against APOE4-driven Tau pathology, neurodegeneration and neuroinflammation > Results > E4-S/S reduces microgliosis in tauopathy mice
plaincorrelational- Asserted: passes — The authors put it forward as true.
- Checkable: passes — It can be checked against evidence.
- Load-bearing: unclear — It is unclear whether the paper’s conclusions depend on it.
- Based: passes — The paper gives a reason why it holds.
It may state two separate claims as one.
A result the paper reports from its own data — it cites no other source for it, so there is none to check. The quote shows it is in the paper.
In the paper
“Furthermore, 10-month-old PS19-E4 mice displayed significantly enlarged lateral ventricles compared to PS19-E3 mice, and this was protected in PS19-E4-S/S mice (Fig. 4a,c).”
§ The APOE-R136S mutation protects against APOE4-driven Tau pathology, neurodegeneration and neuroinflammation > Results > E4-S/S ameliorates neurodegeneration in tauopathy mice
plaindirect- Asserted: passes — The authors put it forward as true.
- Checkable: passes — It can be checked against evidence.
- Load-bearing: passes — The paper’s conclusions depend on it.
- Based: passes — The paper gives a reason why it holds.
It may state two separate claims as one.
- Rests on an assumption: The PS19 tauopathy mouse model crossed with human APOE4-KI mice recapitulates APOE4-driven AD tau pathology sufficiently to test protection by R136S.
A result the paper reports from its own data — it cites no other source for it, so there is none to check. The quote shows it is in the paper.
In the paper
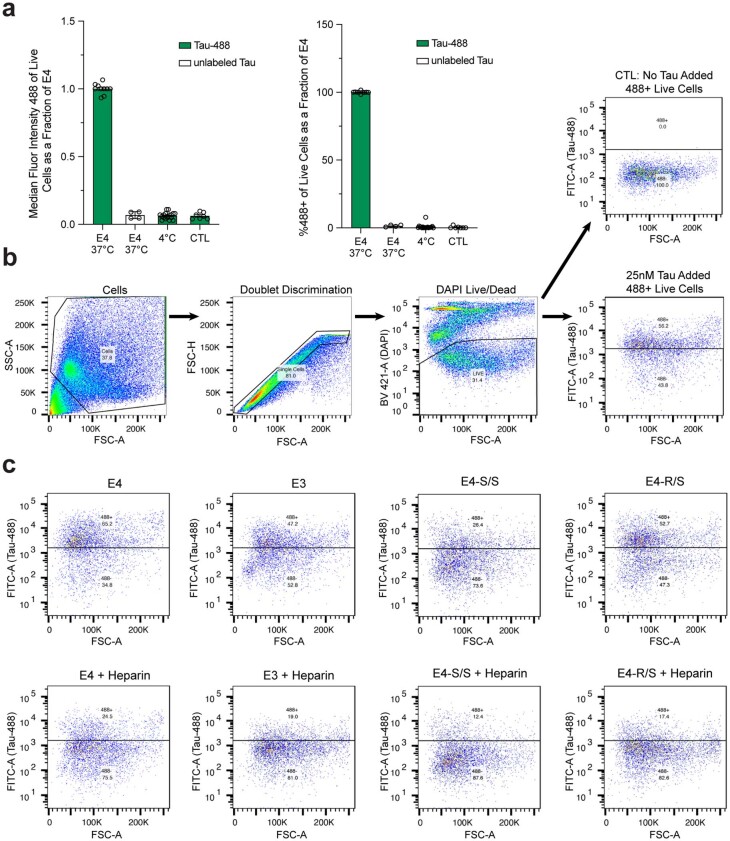
“whereas the treatment led only to a trend toward lower MFI in E4-S/S neurons (Fig. 3b), indicating already decreased HSPG-dependent Tau uptake in E4-S/S neurons.”
§ The APOE-R136S mutation protects against APOE4-driven Tau pathology, neurodegeneration and neuroinflammation > Results > E4-S/S reduces HSPG-mediated Tau uptake by human neurons
hedgeddirect- Asserted: passes — The authors put it forward as true.
- Checkable: passes — It can be checked against evidence.
- Load-bearing: passes — The paper’s conclusions depend on it.
- Based: passes — The paper gives a reason why it holds.
It may state two separate claims as one.
A result the paper reports from its own data — it cites no other source for it, so there is none to check. The quote shows it is in the paper.
In the paper
“The E4-R/S neurons showed no significant difference in MFI versus E4 neurons (Fig. 3b), suggesting no alteration in Tau-488 uptake.”
§ The APOE-R136S mutation protects against APOE4-driven Tau pathology, neurodegeneration and neuroinflammation > Results > E4-S/S reduces HSPG-mediated Tau uptake by human neurons
hedged- Asserted: passes — The authors put it forward as true.
- Checkable: passes — It can be checked against evidence.
- Load-bearing: passes — The paper’s conclusions depend on it.
- Based: passes — The paper gives a reason why it holds.
It may state two separate claims as one.
A result the paper reports from its own data — it cites no other source for it, so there is none to check. The quote shows it is in the paper.
In the paper
“and both PS19-E3 and PS19-E4-S/S mice had markedly reduced GFAP coverage area (Extended Data Fig. 5a) and cell numbers (Fig. 5a,b) versus PS19-E4 mice.”
§ The APOE-R136S mutation protects against APOE4-driven Tau pathology, neurodegeneration and neuroinflammation > Results > E4-S/S reduces astrocytosis in tauopathy mice
plaincorrelational- Asserted: passes — The authors put it forward as true.
- Checkable: passes — It can be checked against evidence.
- Load-bearing: passes — The paper’s conclusions depend on it.
- Based: passes — The paper gives a reason why it holds.
It may state two separate claims as one.
- Rests on an assumption: The PS19 tauopathy mouse model crossed with human APOE4-KI mice recapitulates APOE4-driven AD tau pathology sufficiently to test protection by R136S.
A result the paper reports from its own data — it cites no other source for it, so there is none to check. The quote shows it is in the paper.
In the paper
“PS19-E4 mice displayed the highest hippocampal GFAP coverage area (Extended Data Fig. 5a) and cell numbers (Fig. 5a,b)”
§ The APOE-R136S mutation protects against APOE4-driven Tau pathology, neurodegeneration and neuroinflammation > Results > E4-S/S reduces astrocytosis in tauopathy mice
plain- Asserted: passes — The authors put it forward as true.
- Checkable: passes — It can be checked against evidence.
- Load-bearing: passes — The paper’s conclusions depend on it.
- Based: passes — The paper gives a reason why it holds.
It may state two separate claims as one.
- Rests on an assumption: The PS19 tauopathy mouse model crossed with human APOE4-KI mice recapitulates APOE4-driven AD tau pathology sufficiently to test protection by R136S.
A result the paper reports from its own data — it cites no other source for it, so there is none to check. The quote shows it is in the paper.
In the paper
“As expected, APOE was highly expressed in astrocytes (13 and 36) and, to a lesser extent, in microglia (17 and 19) in all groups of mice”
§ The APOE-R136S mutation protects against APOE4-driven Tau pathology, neurodegeneration and neuroinflammation > Results > E4-S/S rescues transcriptomic changes in neurons and oligodendrocytes
plain- Asserted: passes — The authors put it forward as true.
- Checkable: passes — It can be checked against evidence.
- Load-bearing: fails — The paper’s conclusions may not depend on it.
- Based: passes — The paper gives a reason why it holds.
Probably not a substantial claim. The paper’s conclusions may not depend on it.
A result the paper reports from its own data — it cites no other source for it, so there is none to check. The quote shows it is in the paper.
In the paper
“Subclustering of astrocytes (clusters 13 and 36 in Fig. 6a) produced 12 astrocyte subpopulations”
§ The APOE-R136S mutation protects against APOE4-driven Tau pathology, neurodegeneration and neuroinflammation > Results > E4-S/S increases disease-protective and decreases disease-associated astrocytes
plain- Asserted: passes — The authors put it forward as true.
- Checkable: passes — It can be checked against evidence.
- Load-bearing: fails — The paper’s conclusions may not depend on it.
- Based: passes — The paper gives a reason why it holds.
Probably not a substantial claim. The paper’s conclusions may not depend on it.
A result the paper reports from its own data — it cites no other source for it, so there is none to check. The quote shows it is in the paper.
In the paper
“some neurodegenerative disease-related pathways appeared only in the comparison of PS19-E4-R/S versus PS19-E4 mice, and heparin sulfate biosynthesis pathways appeared only in the comparison of PS19-E4-S/S versus PS19-E4 mice”
§ The APOE-R136S mutation protects against APOE4-driven Tau pathology, neurodegeneration and neuroinflammation > Results > E4-S/S rescues transcriptomic changes in neurons and oligodendrocytes
hedged- Asserted: passes — The authors put it forward as true.
- Checkable: passes — It can be checked against evidence.
- Load-bearing: unclear — It is unclear whether the paper’s conclusions depend on it.
- Based: passes — The paper gives a reason why it holds.
It may state two separate claims as one.
A result the paper reports from its own data — it cites no other source for it, so there is none to check. The quote shows it is in the paper.
In the paper
“the proportion of DAOs in oligodendrocyte cluster 9 had significant negative association with hippocampal volume and positive association with the coverage areas of p-Tau and gliosis”
§ The APOE-R136S mutation protects against APOE4-driven Tau pathology, neurodegeneration and neuroinflammation > Results > E4-S/S rescues transcriptomic changes in neurons and oligodendrocytes
plaincorrelational- Asserted: passes — The authors put it forward as true.
- Checkable: passes — It can be checked against evidence.
- Load-bearing: passes — The paper’s conclusions depend on it.
- Based: passes — The paper gives a reason why it holds.
It may state two separate claims as one.
A result the paper reports from its own data — it cites no other source for it, so there is none to check. The quote shows it is in the paper.
In the paper
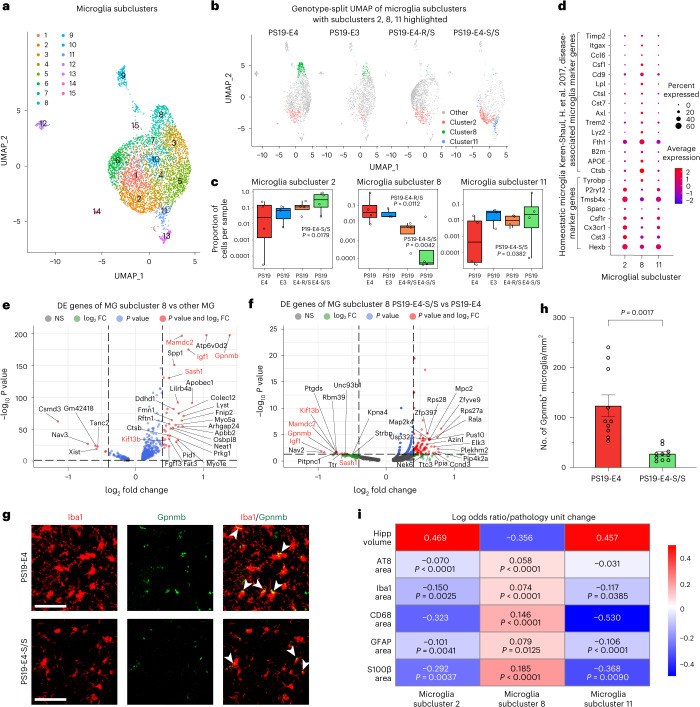
“We also subclustered microglia (clusters 17 and 19 in Fig. 6a) and identified 15 microglial subclusters”
§ The APOE-R136S mutation protects against APOE4-driven Tau pathology, neurodegeneration and neuroinflammation > Results > E4-S/S increases disease-protective and decreases disease-associated microglia
plain- Asserted: passes — The authors put it forward as true.
- Checkable: passes — It can be checked against evidence.
- Load-bearing: fails — The paper’s conclusions may not depend on it.
- Based: passes — The paper gives a reason why it holds.
Probably not a substantial claim. The paper’s conclusions may not depend on it.
A result the paper reports from its own data — it cites no other source for it, so there is none to check. The quote shows it is in the paper.
In the paper
“microglia subcluster 8 had a negative association with hippocampal volume and a significant positive association with the coverage areas of p-Tau and gliosis”
§ The APOE-R136S mutation protects against APOE4-driven Tau pathology, neurodegeneration and neuroinflammation > Results > E4-S/S increases disease-protective and decreases disease-associated microglia
plaincorrelational- Asserted: passes — The authors put it forward as true.
- Checkable: passes — It can be checked against evidence.
- Load-bearing: passes — The paper’s conclusions depend on it.
- Based: passes — The paper gives a reason why it holds.
It may state two separate claims as one.
A result the paper reports from its own data — it cites no other source for it, so there is none to check. The quote shows it is in the paper.
In the paper
“enrichments of DAA subclusters 5 and 7 were negatively associated with hippocampal volume and positively associated with the coverage areas of p-Tau and gliosis”
§ The APOE-R136S mutation protects against APOE4-driven Tau pathology, neurodegeneration and neuroinflammation > Results > E4-S/S increases disease-protective and decreases disease-associated astrocytes
plaincorrelational- Asserted: passes — The authors put it forward as true.
- Checkable: passes — It can be checked against evidence.
- Load-bearing: passes — The paper’s conclusions depend on it.
- Based: passes — The paper gives a reason why it holds.
It may state two separate claims as one.
A result the paper reports from its own data — it cites no other source for it, so there is none to check. The quote shows it is in the paper.
In the paper
“The enrichment of cells in the homeostatic astrocyte subcluster 3 was positively associated with hippocampal volume and negatively associated with the coverage areas of p-Tau and gliosis”
§ The APOE-R136S mutation protects against APOE4-driven Tau pathology, neurodegeneration and neuroinflammation > Results > E4-S/S increases disease-protective and decreases disease-associated astrocytes
plaincorrelational- Asserted: passes — The authors put it forward as true.
- Checkable: passes — It can be checked against evidence.
- Load-bearing: passes — The paper’s conclusions depend on it.
- Based: passes — The paper gives a reason why it holds.
It may state two separate claims as one.
A result the paper reports from its own data — it cites no other source for it, so there is none to check. The quote shows it is in the paper.
In the paper
“Microglia subcluster 8 expressed high levels of APOE, whereas microglia subclusters 2 and 11 expressed relatively low levels of APOE”
§ The APOE-R136S mutation protects against APOE4-driven Tau pathology, neurodegeneration and neuroinflammation > Results > E4-S/S increases disease-protective and decreases disease-associated microglia
plaincorrelational- Asserted: passes — The authors put it forward as true.
- Checkable: passes — It can be checked against evidence.
- Load-bearing: passes — The paper’s conclusions depend on it.
- Based: passes — The paper gives a reason why it holds.
It may state two separate claims as one.
The paper states this without a source or data behind it here, so there is nothing to check it against. The quote shows it is in the paper.
In the paper
“In the present study, we demonstrate the protective power of the R136S mutation against APOE4-driven effects in a tauopathy mouse model and in hiPSC-derived neurons from a patient with AD, neither of which exhibit extensive Aβ pathology.”
§ The APOE-R136S mutation protects against APOE4-driven Tau pathology, neurodegeneration and neuroinflammation > Discussion
plain- Asserted: passes — The authors put it forward as true.
- Checkable: passes — It can be checked against evidence.
- Load-bearing: passes — The paper’s conclusions depend on it.
- Based: passes — The paper gives a reason why it holds.
It may state two separate claims as one.
A result the paper reports from its own data — it cites no other source for it, so there is none to check. The quote shows it is in the paper.
In the paper
“In the present study, we demonstrate the protective power of the R136S mutation against APOE4-driven effects in a tauopathy mouse model and in hiPSC-derived neurons from a patient with AD, neither of which exhibit extensive Aβ pathology.”
§ The APOE-R136S mutation protects against APOE4-driven Tau pathology, neurodegeneration and neuroinflammation > Discussion
boosteddirect- Asserted: passes — The authors put it forward as true.
- Checkable: passes — It can be checked against evidence.
- Load-bearing: passes — The paper’s conclusions depend on it.
- Based: passes — The paper gives a reason why it holds.
It may state two separate claims as one.
A result the paper reports from its own data — it cites no other source for it, so there is none to check. The quote shows it is in the paper.
In the paper
“Heavier astrocytosis correlates with hippocampal atrophy in PS19-E4 mice, but this relationship was mostly abolished in PS19-E4-S/S mice and somewhat diminished in PS19-E4-R/S mice.”
§ The APOE-R136S mutation protects against APOE4-driven Tau pathology, neurodegeneration and neuroinflammation > Discussion
plaincorrelational- Asserted: passes — The authors put it forward as true.
- Checkable: passes — It can be checked against evidence.
- Load-bearing: passes — The paper’s conclusions depend on it.
- Based: passes — The paper gives a reason why it holds.
It may state two separate claims as one.
A result the paper reports from its own data — it cites no other source for it, so there is none to check. The quote shows it is in the paper.
In the paper
“Deeper analyses of DE genes revealed that these DAOs, DAAs and DAMs each have unique transcriptomic signatures that are eliminated or even reversed with the homozygous APOE4-R136S mutation.”
§ The APOE-R136S mutation protects against APOE4-driven Tau pathology, neurodegeneration and neuroinflammation > Discussion
plaindirect- Asserted: passes — The authors put it forward as true.
- Checkable: passes — It can be checked against evidence.
- Load-bearing: passes — The paper’s conclusions depend on it.
- Based: passes — The paper gives a reason why it holds.
It may state two separate claims as one.
A result the paper reports from its own data — it cites no other source for it, so there is none to check. The quote shows it is in the paper.
In the paper
“Subclustering with 15 PCs and 0.9 resolution resulted in 12 distinct biologically relevant subclusters for astrocytes.”
§ The APOE-R136S mutation protects against APOE4-driven Tau pathology, neurodegeneration and neuroinflammation > Methods > Subclustering of astrocytic and microglial snRNA-seq data
plain- Asserted: passes — The authors put it forward as true.
- Checkable: passes — It can be checked against evidence.
- Load-bearing: fails — The paper’s conclusions may not depend on it.
- Based: passes — The paper gives a reason why it holds.
Probably not a substantial claim. The paper’s conclusions may not depend on it.
A result the paper reports from its own data — it cites no other source for it, so there is none to check. The quote shows it is in the paper.
In the paper
“The hippocampal cell clusters 13 and 36 were annotated as the astrocyte cells, and hippocampal cell clusters 17 and 19 were annotated as the microglial cells.”
§ The APOE-R136S mutation protects against APOE4-driven Tau pathology, neurodegeneration and neuroinflammation > Methods > Subclustering of astrocytic and microglial snRNA-seq data
plain- Asserted: passes — The authors put it forward as true.
- Checkable: passes — It can be checked against evidence.
- Load-bearing: fails — The paper’s conclusions may not depend on it.
- Based: passes — The paper gives a reason why it holds.
Probably not a substantial claim. The paper’s conclusions may not depend on it. It may state two separate claims as one.
A result the paper reports from its own data — it cites no other source for it, so there is none to check. The quote shows it is in the paper.
In the paper
“Subclustering with 15 PCs and 0.9 resolution resulted in 15 distinct biologically relevant microglia subclusters.”
§ The APOE-R136S mutation protects against APOE4-driven Tau pathology, neurodegeneration and neuroinflammation > Methods > Subclustering of astrocytic and microglial snRNA-seq data
plain- Asserted: passes — The authors put it forward as true.
- Checkable: passes — It can be checked against evidence.
- Load-bearing: fails — The paper’s conclusions may not depend on it.
- Based: passes — The paper gives a reason why it holds.
Probably not a substantial claim. The paper’s conclusions may not depend on it.
A result the paper reports from its own data — it cites no other source for it, so there is none to check. The quote shows it is in the paper.
In the paper
“In total, three hiPSC lines homozygous for R136S mutation and two hiPSC lines heterozygous for R136S mutation were generated and characterized for use in the current study.”
§ The APOE-R136S mutation protects against APOE4-driven Tau pathology, neurodegeneration and neuroinflammation > Methods > Generating and characterizing isogenic E4-S/S and E4-R/S hiPSC lines by CRISPR–Cas-9-mediated gene editing
plain- Asserted: passes — The authors put it forward as true.
- Checkable: passes — It can be checked against evidence.
- Load-bearing: passes — The paper’s conclusions depend on it.
- Based: passes — The paper gives a reason why it holds.
Probably not a substantial claim.
A result the paper reports from its own data — it cites no other source for it, so there is none to check. The quote shows it is in the paper.
In the paper
“Clustering with 15 principal components (PCs) and 0.7 resolution resulted in 38 distinct biologically relevant clusters, which were used for further analyses.”
§ The APOE-R136S mutation protects against APOE4-driven Tau pathology, neurodegeneration and neuroinflammation > Methods > Pre-processing and clustering of mouse snRNA-seq samples
plainn = 15- Asserted: passes — The authors put it forward as true.
- Checkable: passes — It can be checked against evidence.
- Load-bearing: fails — The paper’s conclusions may not depend on it.
- Based: passes — The paper gives a reason why it holds.
Probably not a substantial claim. The paper’s conclusions may not depend on it.
A claim is checked only against the cited paper’s full text, never its abstract, and none is available for its sources.
In the paper
“As APOE4 carriers make up 55–75% of AD cases17–20”
§ The APOE-R136S mutation protects against APOE4-driven Tau pathology, neurodegeneration and neuroinflammation > Main
What the sources say
- Not checked — no full text of the sourcecites [17] Corder, E. H. et al. Gene dose of apolipoprotein E type 4 allele and the risk of Alzheimer’s disease in late onset families. Science 261, 921–923 (1993). source
- Not checked — no full text of the sourcecites [18] Farrer, L. A. et al. Effects of age, sex, and ethnicity on the association between apolipoprotein E genotype and Alzheimer disease: a meta-analysis. JAMA 278, 1349–1356 (1997). source
- Not checked — no full text of the sourcecites [19] Rebeck, G. W., Reiter, J. S., Strickland, D. K. & Hyman, B. T. Apolipoprotein E in sporadic Alzheimer’s disease: allelic variation and receptor interactions. Neuron 11, 575–580 (1993). source
- Not checked — no full text of the sourcecites [20] Ward, A. et al. Prevalence of apolipoprotein E4 genotype and homozygotes (APOE e4/4) among patients diagnosed with Alzheimer’s disease: a systematic review and meta-analysis. Neuroepidemiology 38, 1–17 (2012). source
plaincorrelational- Asserted: passes — The authors put it forward as true.
- Checkable: passes — It can be checked against evidence.
- Load-bearing: fails — The paper’s conclusions may not depend on it.
- Based: passes — The paper gives a reason why it holds.
Probably not a substantial claim. The paper’s conclusions may not depend on it.
What the paper did — it cites no source for this, so there is none to check. The quote shows it is in the paper.
In the paper
“Genomic DNA (gDNA) sequencing verified on-target gene editing of R136 to S136 in APOE4 (Extended Data Fig. 1d) and found no changes within the top predicted potential off-target sites (Extended Data Fig. 1e).”
§ The APOE-R136S mutation protects against APOE4-driven Tau pathology, neurodegeneration and neuroinflammation > Results > Generating tauopathy mice expressing human APOE4 or APOE4-R136S
plain- Asserted: passes — The authors put it forward as true.
- Checkable: passes — It can be checked against evidence.
- Load-bearing: passes — The paper’s conclusions depend on it.
- Based: passes — The paper gives a reason why it holds.
It may state two separate claims as one.
- Rests on an assumption: The top predicted off-target sites are sufficient to rule out off-target effects of CRISPR editing on phenotypes.
In the paper
“Tau accumulation and propagation during AD progression correlate with neurodegeneration and clinical effects49”
§ The APOE-R136S mutation protects against APOE4-driven Tau pathology, neurodegeneration and neuroinflammation > Main
What the sources say
- Not checked — no full text of the sourcecites [49] Braak, H. & Braak, E. Neuropathological stageing of Alzheimer-related changes. Acta Neuropathol. 82, 239–259 (1991). source
plaincorrelational- Asserted: passes — The authors put it forward as true.
- Checkable: passes — It can be checked against evidence.
- Load-bearing: passes — The paper’s conclusions depend on it.
- Based: passes — The paper gives a reason why it holds.
Probably not a substantial claim.
What the paper did — it cites no source for this, so there is none to check. The quote shows it is in the paper.
In the paper
“gDNA sequencing verified the correct editing of R136 to S136 in APOE4 (Extended Data Fig. 1h) and found no mutations in the top predicted potential off-target sites (Extended Data Fig. 1i).”
§ The APOE-R136S mutation protects against APOE4-driven Tau pathology, neurodegeneration and neuroinflammation > Results > Generating isogenic E4-S/S and E4-R/S hiPSC lines
plain- Asserted: passes — The authors put it forward as true.
- Checkable: passes — It can be checked against evidence.
- Load-bearing: passes — The paper’s conclusions depend on it.
- Based: passes — The paper gives a reason why it holds.
It may state two separate claims as one.
- Rests on an assumption: The top predicted off-target sites are sufficient to rule out off-target effects of CRISPR editing on phenotypes.
A conclusion the paper draws from its own results — it cites no other source for it, so there is none to check. The quote shows it is in the paper.
In the paper
“In all, these findings indicate that the homozygous and, to a lesser extent, heterozygous R136S mutation protects against APOE4-driven astrocytosis and microgliosis in the context of tauopathy in an age-dependent manner, which can lead to reduced hippocampal neurodegeneration and atrophy.”
§ The APOE-R136S mutation protects against APOE4-driven Tau pathology, neurodegeneration and neuroinflammation > Results > E4-S/S reduces microgliosis in tauopathy mice
hedgeddirect- Asserted: passes — The authors put it forward as true.
- Checkable: passes — It can be checked against evidence.
- Load-bearing: passes — The paper’s conclusions depend on it.
- Based: passes — The paper gives a reason why it holds.
It may state two separate claims as one.
A conclusion the paper draws from its own results — it cites no other source for it, so there is none to check. The quote shows it is in the paper.
In the paper
“suggesting that mild microgliosis is likely more toxic than mild astrocytosis and sufficient to cause hippocampal degeneration”
§ The APOE-R136S mutation protects against APOE4-driven Tau pathology, neurodegeneration and neuroinflammation > Results > E4-S/S reduces microgliosis in tauopathy mice
hedgedconditional- Asserted: passes — The authors put it forward as true.
- Checkable: passes — It can be checked against evidence.
- Load-bearing: passes — The paper’s conclusions depend on it.
- Based: passes — The paper gives a reason why it holds.
It may state two separate claims as one.
- Rests on an assumption: Correlations between gliosis markers and hippocampal volume reflect a causal contribution of gliosis to hippocampal degeneration.
A conclusion the paper draws from its own results — it cites no other source for it, so there is none to check. The quote shows it is in the paper.
In the paper
“Taken together, these data suggest that E4-S/S and EKO neurons, but not E4-R/S neurons, have similarly reduced Tau uptake compared to E4 neurons, which may be due to the defective HSPG binding of E4-S/S and the lack of APOE, respectively.”
§ The APOE-R136S mutation protects against APOE4-driven Tau pathology, neurodegeneration and neuroinflammation > Results > E4-S/S reduces HSPG-mediated Tau uptake by human neurons
hedgedconditional- Asserted: passes — The authors put it forward as true.
- Checkable: passes — It can be checked against evidence.
- Load-bearing: passes — The paper’s conclusions depend on it.
- Based: passes — The paper gives a reason why it holds.
It may state two separate claims as one.
A conclusion the paper draws from its own results — it cites no other source for it, so there is none to check. The quote shows it is in the paper.
In the paper
“Taken together, these data indicate that the R136S mutation ameliorates APOE4-driven neurodegeneration in the tauopathy mice, with the homozygous mutation being required for a full rescue.”
§ The APOE-R136S mutation protects against APOE4-driven Tau pathology, neurodegeneration and neuroinflammation > Results > E4-S/S ameliorates neurodegeneration in tauopathy mice
hedgeddirect- Asserted: passes — The authors put it forward as true.
- Checkable: passes — It can be checked against evidence.
- Load-bearing: passes — The paper’s conclusions depend on it.
- Based: passes — The paper gives a reason why it holds.
It may state two separate claims as one.
- Rests on an assumption: The PS19 tauopathy mouse model crossed with human APOE4-KI mice recapitulates APOE4-driven AD tau pathology sufficiently to test protection by R136S.
A conclusion the paper draws from its own results — it cites no other source for it, so there is none to check. The quote shows it is in the paper.
In the paper
“Thus, the APOE4-R136S mutation promoted the survival of excitatory neuronal subpopulations (clusters 1, 6, 7 and 28) and the elimination of DAO subpopulation (cluster 9).”
§ The APOE-R136S mutation protects against APOE4-driven Tau pathology, neurodegeneration and neuroinflammation > Results > E4-S/S rescues transcriptomic changes in neurons and oligodendrocytes
plaindirect- Asserted: passes — The authors put it forward as true.
- Checkable: passes — It can be checked against evidence.
- Load-bearing: passes — The paper’s conclusions depend on it.
- Based: passes — The paper gives a reason why it holds.
It may state two separate claims as one.
A conclusion the paper draws from its own results — it cites no other source for it, so there is none to check. The quote shows it is in the paper.
In the paper
“These findings again support the notion that APOE4-R136S leads to a significant increase in the disease-protective homeostatic microglia subpopulation, likely contributing to the enrichment of neuronal clusters 1, 6, 7 and 28, as well as to a significant reduction in the DAM subpopulation, likely contributing to the elimination of the DAOs.”
§ The APOE-R136S mutation protects against APOE4-driven Tau pathology, neurodegeneration and neuroinflammation > Results > E4-S/S increases disease-protective and decreases disease-associated microglia
hedgeddirect- Asserted: passes — The authors put it forward as true.
- Checkable: passes — It can be checked against evidence.
- Load-bearing: passes — The paper’s conclusions depend on it.
- Based: passes — The paper gives a reason why it holds.
It may state two separate claims as one.
A conclusion the paper draws from its own results — it cites no other source for it, so there is none to check. The quote shows it is in the paper.
In the paper
“These findings support the notion that APOE4-R136S leads to a significant increase in the disease-protective homeostatic astrocyte subpopulation, likely contributing to the enrichment of neuronal clusters 1, 6, 7 and 28, as well as to a significant reduction in the DAA subpopulation, likely contributing to the elimination of the DAOs.”
§ The APOE-R136S mutation protects against APOE4-driven Tau pathology, neurodegeneration and neuroinflammation > Results > E4-S/S increases disease-protective and decreases disease-associated astrocytes
hedgeddirect- Asserted: passes — The authors put it forward as true.
- Checkable: passes — It can be checked against evidence.
- Load-bearing: passes — The paper’s conclusions depend on it.
- Based: passes — The paper gives a reason why it holds.
It may state two separate claims as one.
A conclusion the paper draws from its own results — it cites no other source for it, so there is none to check. The quote shows it is in the paper.
In the paper
“suggesting that both E4-S/S and E4-R/S promote the survival of, or protect against the loss of, these neuronal subpopulations”
§ The APOE-R136S mutation protects against APOE4-driven Tau pathology, neurodegeneration and neuroinflammation > Results > E4-S/S rescues transcriptomic changes in neurons and oligodendrocytes
hedgeddirect- Asserted: passes — The authors put it forward as true.
- Checkable: passes — It can be checked against evidence.
- Load-bearing: passes — The paper’s conclusions depend on it.
- Based: passes — The paper gives a reason why it holds.
It may state two separate claims as one.
A conclusion the paper draws from its own results — it cites no other source for it, so there is none to check. The quote shows it is in the paper.
In the paper
“suggesting that E4-S/S promotes the survival of, or protects against the loss of, these neuronal subpopulations”
§ The APOE-R136S mutation protects against APOE4-driven Tau pathology, neurodegeneration and neuroinflammation > Results > E4-S/S rescues transcriptomic changes in neurons and oligodendrocytes
hedgeddirect- Asserted: passes — The authors put it forward as true.
- Checkable: passes — It can be checked against evidence.
- Load-bearing: passes — The paper’s conclusions depend on it.
- Based: passes — The paper gives a reason why it holds.
It may state two separate claims as one.
None of the sources cited for this claim have been checked yet.
In the paper
“It emphasizes the key roles of APOE variants in AD pathogenesis and/or protection.”
§ The APOE-R136S mutation protects against APOE4-driven Tau pathology, neurodegeneration and neuroinflammation > Discussion
plaincorrelational- Asserted: passes — The authors put it forward as true.
- Checkable: passes — It can be checked against evidence.
- Load-bearing: passes — The paper’s conclusions depend on it.
- Based: passes — The paper gives a reason why it holds.
Probably not a substantial claim.
A conclusion the paper draws from its own results — it cites no other source for it, so there is none to check. The quote shows it is in the paper.
In the paper
“Our data show that homozygous R136S mutation fully protects against APOE4-driven Tau pathology, neurodegeneration and neuroinflammation in a tauopathy mouse model”
§ The APOE-R136S mutation protects against APOE4-driven Tau pathology, neurodegeneration and neuroinflammation > Discussion
boosteddirect- Asserted: passes — The authors put it forward as true.
- Checkable: passes — It can be checked against evidence.
- Load-bearing: passes — The paper’s conclusions depend on it.
- Based: passes — The paper gives a reason why it holds.
It may state two separate claims as one.
A conclusion the paper draws from its own results — it cites no other source for it, so there is none to check. The quote shows it is in the paper.
In the paper
“Together, these findings illustrate that E4-S/S increases disease-protective homeostatic astrocytes (subcluster 3) and both E4-S/S and E4-R/S eliminate DAAs (subclusters 5 and 7) in the hippocampus of the tauopathy mice, with E4-S/S having a greater effect than E4-R/S.”
§ The APOE-R136S mutation protects against APOE4-driven Tau pathology, neurodegeneration and neuroinflammation > Results > E4-S/S increases disease-protective and decreases disease-associated astrocytes
plaindirect- Asserted: passes — The authors put it forward as true.
- Checkable: passes — It can be checked against evidence.
- Load-bearing: passes — The paper’s conclusions depend on it.
- Based: passes — The paper gives a reason why it holds.
It may state two separate claims as one.
A conclusion the paper draws from its own results — it cites no other source for it, so there is none to check. The quote shows it is in the paper.
In the paper
“Together, these findings indicate that the APOE4-R136S mutation increases disease-protective homeostatic microglia (subclusters 2 and 11) and eliminates DAMs (subcluster 8), with E4-S/S having a greater effect than E4-R/S.”
§ The APOE-R136S mutation protects against APOE4-driven Tau pathology, neurodegeneration and neuroinflammation > Results > E4-S/S increases disease-protective and decreases disease-associated microglia
hedgeddirect- Asserted: passes — The authors put it forward as true.
- Checkable: passes — It can be checked against evidence.
- Load-bearing: passes — The paper’s conclusions depend on it.
- Based: passes — The paper gives a reason why it holds.
It may state two separate claims as one.
A conclusion the paper draws from its own results — it cites no other source for it, so there is none to check. The quote shows it is in the paper.
In the paper
“These data indicate that the R136S mutation not only modifies APOE4-driven AD pathologies in general, but it does so by differentially affecting the disease-associated transcriptomes in specific types of cells.”
§ The APOE-R136S mutation protects against APOE4-driven Tau pathology, neurodegeneration and neuroinflammation > Discussion
hedgeddirect- Asserted: passes — The authors put it forward as true.
- Checkable: passes — It can be checked against evidence.
- Load-bearing: passes — The paper’s conclusions depend on it.
- Based: passes — The paper gives a reason why it holds.
It may state two separate claims as one.
A conclusion the paper draws from its own results — it cites no other source for it, so there is none to check. The quote shows it is in the paper.
In the paper
“Overall, this study illustrates the AD-protective effects of the R136S mutation against APOE4-promoted pathologies in a gene dose-dependent manner, both in vivo in a tauopathy mouse model and in vitro in hiPSC-derived neurons (Supplementary Fig. 9).”
§ The APOE-R136S mutation protects against APOE4-driven Tau pathology, neurodegeneration and neuroinflammation > Discussion
boosteddirect- Asserted: passes — The authors put it forward as true.
- Checkable: passes — It can be checked against evidence.
- Load-bearing: passes — The paper’s conclusions depend on it.
- Based: passes — The paper gives a reason why it holds.
It may state two separate claims as one.
A conclusion the paper draws from its own results — it cites no other source for it, so there is none to check. The quote shows it is in the paper.
In the paper
“Although PS19-E4-R/S mice and E4-R/S neurons did not show protection from APOE4-induced p-Tau accumulation, the R136S mutation did enable gene dose-dependent rescue of APOE4-promoted astrocytosis, microgliosis and neurodegeneration.”
§ The APOE-R136S mutation protects against APOE4-driven Tau pathology, neurodegeneration and neuroinflammation > Discussion
plaindirect- Asserted: passes — The authors put it forward as true.
- Checkable: passes — It can be checked against evidence.
- Load-bearing: passes — The paper’s conclusions depend on it.
- Based: passes — The paper gives a reason why it holds.
It may state two separate claims as one.
A conclusion the paper draws from its own results — it cites no other source for it, so there is none to check. The quote shows it is in the paper.
In the paper
“In PS19-E4-R/S mice, we saw high p-Tau burden (similar to PS19-E4 mice) yet partially rescued astrocytosis and microgliosis, suggesting that neurodegeneration-associated gliosis is not solely induced by Tau pathology.”
§ The APOE-R136S mutation protects against APOE4-driven Tau pathology, neurodegeneration and neuroinflammation > Discussion
hedgedconditional- Asserted: passes — The authors put it forward as true.
- Checkable: passes — It can be checked against evidence.
- Load-bearing: passes — The paper’s conclusions depend on it.
- Based: passes — The paper gives a reason why it holds.
It may state two separate claims as one.
A conclusion the paper draws from its own results — it cites no other source for it, so there is none to check. The quote shows it is in the paper.
In the paper
“Interestingly, both heavier (PS19-E4 mice) and mild (PS19-E3, PS19-E4-S/S and PS19-E4-R/S mice) microgliosis correlate with hippocampal atrophy, suggesting that microgliosis may contribute to degeneration at an earlier stage of pathogenesis.”
§ The APOE-R136S mutation protects against APOE4-driven Tau pathology, neurodegeneration and neuroinflammation > Discussion
hedgedconditional- Asserted: passes — The authors put it forward as true.
- Checkable: passes — It can be checked against evidence.
- Load-bearing: passes — The paper’s conclusions depend on it.
- Based: passes — The paper gives a reason why it holds.
It may state two separate claims as one.
- Rests on an assumption: Correlations between gliosis markers and hippocampal volume reflect a causal contribution of gliosis to hippocampal degeneration.
A conclusion the paper draws from its own results — it cites no other source for it, so there is none to check. The quote shows it is in the paper.
In the paper
“that glial cells may be more sensitive to the presence of APOE4-R136S and be more protected against APOE4 effects than neurons”
§ The APOE-R136S mutation protects against APOE4-driven Tau pathology, neurodegeneration and neuroinflammation > Discussion
hedgedconditional- Asserted: passes — The authors put it forward as true.
- Checkable: passes — It can be checked against evidence.
- Load-bearing: passes — The paper’s conclusions depend on it.
- Based: passes — The paper gives a reason why it holds.
It may state two separate claims as one.
What the paper did — it cites no source for this, so there is none to check. The quote shows it is in the paper.
In the paper
“For Gpnmb/Iba1 immunostaining study, NeuN was stained and masked out of analysis to account for any Gpnmb that was expressed within the neuronal layer of the DG.”
§ The APOE-R136S mutation protects against APOE4-driven Tau pathology, neurodegeneration and neuroinflammation > Methods > Immunohistochemistry
plain- Asserted: passes — The authors put it forward as true.
- Checkable: passes — It can be checked against evidence.
- Load-bearing: fails — The paper’s conclusions may not depend on it.
- Based: passes — The paper gives a reason why it holds.
Probably not a substantial claim. The paper’s conclusions may not depend on it.
What the paper did — it cites no source for this, so there is none to check. The quote shows it is in the paper.
In the paper
“Identical experiments to control for Tau-488 binding versus uptake were conducted at 4 °C (Extended Data Fig. 4).”
§ The APOE-R136S mutation protects against APOE4-driven Tau pathology, neurodegeneration and neuroinflammation > Methods > Tau uptake assay
plain- Asserted: passes — The authors put it forward as true.
- Checkable: passes — It can be checked against evidence.
- Load-bearing: fails — The paper’s conclusions may not depend on it.
- Based: passes — The paper gives a reason why it holds.
Probably not a substantial claim. The paper’s conclusions may not depend on it.
What the paper did — it cites no source for this, so there is none to check. The quote shows it is in the paper.
In the paper
“Control samples of neurons untreated with Tau-488 were included in each experiment to accurately draw Tau-488− gates in the live cell population (Extended Data Fig. 4) and automatically propagated to all samples in each experiment.”
§ The APOE-R136S mutation protects against APOE4-driven Tau pathology, neurodegeneration and neuroinflammation > Methods > Tau uptake assay
plain- Asserted: passes — The authors put it forward as true.
- Checkable: passes — It can be checked against evidence.
- Load-bearing: fails — The paper’s conclusions may not depend on it.
- Based: passes — The paper gives a reason why it holds.
Probably not a substantial claim. The paper’s conclusions may not depend on it.
What the paper did — it cites no source for this, so there is none to check. The quote shows it is in the paper.
In the paper
“Data visualization using Seurat version 4.1.1 in the UMAP space for the 15 samples revealed no batch effects by age, sex, genotype, date of birth or nuclear isolation date.”
§ The APOE-R136S mutation protects against APOE4-driven Tau pathology, neurodegeneration and neuroinflammation > Methods > Cell type assignment
plainn = 15- Asserted: passes — The authors put it forward as true.
- Checkable: passes — It can be checked against evidence.
- Load-bearing: fails — The paper’s conclusions may not depend on it.
- Based: passes — The paper gives a reason why it holds.
Probably not a substantial claim. The paper’s conclusions may not depend on it.
What the paper did — it cites no source for this, so there is none to check. The quote shows it is in the paper.
In the paper
“The ssODN was designed to convert APOE4 to APOE4-R136S with a silent mutation at the protospacer adjacent motif (PAM) site to prevent repeated Cas9 editing.”
§ The APOE-R136S mutation protects against APOE4-driven Tau pathology, neurodegeneration and neuroinflammation > Methods > Generation of APOE4-R136S knock-in mice by CRISPR–Cas-9-mediated gene editing
plaindirect- Asserted: passes — The authors put it forward as true.
- Checkable: passes — It can be checked against evidence.
- Load-bearing: fails — The paper’s conclusions may not depend on it.
- Based: passes — The paper gives a reason why it holds.
Probably not a substantial claim. The paper’s conclusions may not depend on it.
What the paper did — it cites no source for this, so there is none to check. The quote shows it is in the paper.
In the paper
“Analysts drawing regions of interest were blinded to sample to exclude the possibility of bias.”
§ The APOE-R136S mutation protects against APOE4-driven Tau pathology, neurodegeneration and neuroinflammation > Methods > Volumetric analysis
plain- Asserted: passes — The authors put it forward as true.
- Checkable: passes — It can be checked against evidence.
- Load-bearing: fails — The paper’s conclusions may not depend on it.
- Based: passes — The paper gives a reason why it holds.
Probably not a substantial claim. The paper’s conclusions may not depend on it.
What the paper did — it cites no source for this, so there is none to check. The quote shows it is in the paper.
In the paper
“Each unique hiPSC line was checked for normal karyotype and validated to maintain pluripotency (see ‘Immunocytochemistry and imaging’ subsection for details).”
§ The APOE-R136S mutation protects against APOE4-driven Tau pathology, neurodegeneration and neuroinflammation > Methods > Generating and characterizing isogenic E4-S/S and E4-R/S hiPSC lines by CRISPR–Cas-9-mediated gene editing
plain- Asserted: passes — The authors put it forward as true.
- Checkable: passes — It can be checked against evidence.
- Load-bearing: fails — The paper’s conclusions may not depend on it.
- Based: passes — The paper gives a reason why it holds.
Probably not a substantial claim. The paper’s conclusions may not depend on it. It may state two separate claims as one.
What the paper did — it cites no source for this, so there is none to check. The quote shows it is in the paper.
In the paper
“No randomization method was used for the assignment of mice or cells to study groups, and no animals or data points were excluded from these studies.”
§ The APOE-R136S mutation protects against APOE4-driven Tau pathology, neurodegeneration and neuroinflammation > Methods > General statistics and reproducibility
plain- Asserted: passes — The authors put it forward as true.
- Checkable: passes — It can be checked against evidence.
- Load-bearing: fails — The paper’s conclusions may not depend on it.
- Based: passes — The paper gives a reason why it holds.
Probably not a substantial claim. The paper’s conclusions may not depend on it.
What the paper did — it cites no source for this, so there is none to check. The quote shows it is in the paper.
In the paper
“The modeling choice of including the mouse model as a random effect as opposed to a fixed effect is meant to increase the degrees of freedom (or maximize the statistical power) to detect the association of interest, particularly in light of the relatively small number of replicates (3–4) per animal model.”
§ The APOE-R136S mutation protects against APOE4-driven Tau pathology, neurodegeneration and neuroinflammation > Methods > Association between proportion of cell types and histopathological parameters
plaindirect- Asserted: passes — The authors put it forward as true.
- Checkable: passes — It can be checked against evidence.
- Load-bearing: fails — The paper’s conclusions may not depend on it.
- Based: passes — The paper gives a reason why it holds.
Probably not a substantial claim. The paper’s conclusions may not depend on it.
What the paper did — it cites no source for this, so there is none to check. The quote shows it is in the paper.
In the paper
“All mice were on a pure C57BL/6 genetic background and were housed in a pathogen-free barrier facility on a 12-h light cycle at 19–23 °C and 30–70% humidity.”
§ The APOE-R136S mutation protects against APOE4-driven Tau pathology, neurodegeneration and neuroinflammation > Methods > Generation of tauopathy mice expressing E4, E3 or E4-S/S
plain- Asserted: passes — The authors put it forward as true.
- Checkable: passes — It can be checked against evidence.
- Load-bearing: fails — The paper’s conclusions may not depend on it.
- Based: passes — The paper gives a reason why it holds.
Probably not a substantial claim. The paper’s conclusions may not depend on it.
What the paper did — it cites no source for this, so there is none to check. The quote shows it is in the paper.
In the paper
“During both the manual drawing of the hippocampal subregion of the CA1 cell layer in Fiji (ImageJ) and the AT8+ cell soma quantification in CellProfiler, analysts were blinded to sample identity.”
§ The APOE-R136S mutation protects against APOE4-driven Tau pathology, neurodegeneration and neuroinflammation > Methods > Immunohistochemistry
plain- Asserted: passes — The authors put it forward as true.
- Checkable: passes — It can be checked against evidence.
- Load-bearing: passes — The paper’s conclusions depend on it.
- Based: passes — The paper gives a reason why it holds.
Probably not a substantial claim.
What the paper did — it cites no source for this, so there is none to check. The quote shows it is in the paper.
In the paper
“Investigators were not blinded during snRNA-seq analysis as sample metadata were needed to conduct comparisons.”
§ The APOE-R136S mutation protects against APOE4-driven Tau pathology, neurodegeneration and neuroinflammation > Methods > General statistics and reproducibility
plaindirect- Asserted: passes — The authors put it forward as true.
- Checkable: passes — It can be checked against evidence.
- Load-bearing: fails — The paper’s conclusions may not depend on it.
- Based: passes — The paper gives a reason why it holds.
Probably not a substantial claim. The paper’s conclusions may not depend on it.
What the paper did — it cites no source for this, so there is none to check. The quote shows it is in the paper.
In the paper
“One PS19-E3 sample had a low total number of cells, and these cells had a relatively large percent of mitochondrial reads (0.1% versus 0.04% for the other samples); thus, they did not pass the quality control assessment. This sample was, therefore, excluded from all further analyses.”
- Also stated in: § General statistics and reproducibility · plain
“One PS19-E3 sample failed our pre-processing quality control assessment as described above and was, therefore, excluded.”
§ The APOE-R136S mutation protects against APOE4-driven Tau pathology, neurodegeneration and neuroinflammation > Methods > Pre-processing and clustering of mouse snRNA-seq samples
plainSingle case- Asserted: passes — The authors put it forward as true.
- Checkable: passes — It can be checked against evidence.
- Load-bearing: fails — The paper’s conclusions may not depend on it.
- Based: passes — The paper gives a reason why it holds.
Probably not a substantial claim. The paper’s conclusions may not depend on it.
- Also stated in: § General statistics and reproducibility · plain
What the paper did — it cites no source for this, so there is none to check. The quote shows it is in the paper.
In the paper
“Each experiment was conducted four times and normalized to E4 neurons without heparin treatment to combine datasets from multiple experiments.”
§ The APOE-R136S mutation protects against APOE4-driven Tau pathology, neurodegeneration and neuroinflammation > Methods > Tau uptake assay
plain- Asserted: passes — The authors put it forward as true.
- Checkable: passes — It can be checked against evidence.
- Load-bearing: fails — The paper’s conclusions may not depend on it.
- Based: passes — The paper gives a reason why it holds.
Probably not a substantial claim. The paper’s conclusions may not depend on it. It may state two separate claims as one.
What the paper did — it cites no source for this, so there is none to check. The quote shows it is in the paper.
In the paper
“Nuclei were isolated from four mice per genotype to ensure n ≥ 3 mice per group.”
§ The APOE-R136S mutation protects against APOE4-driven Tau pathology, neurodegeneration and neuroinflammation > Methods > General statistics and reproducibility
plainn = 4- Asserted: passes — The authors put it forward as true.
- Checkable: passes — It can be checked against evidence.
- Load-bearing: fails — The paper’s conclusions may not depend on it.
- Based: passes — The paper gives a reason why it holds.
Probably not a substantial claim. The paper’s conclusions may not depend on it.
What the paper did — it cites no source for this, so there is none to check. The quote shows it is in the paper.
In the paper
“Analysts were blinded to sample.”
§ The APOE-R136S mutation protects against APOE4-driven Tau pathology, neurodegeneration and neuroinflammation > Methods > Immunohistochemistry
plain- Asserted: passes — The authors put it forward as true.
- Checkable: passes — It can be checked against evidence.
- Load-bearing: fails — The paper’s conclusions may not depend on it.
- Based: passes — The paper gives a reason why it holds.
Probably not a substantial claim. The paper’s conclusions may not depend on it.
What the paper did — it cites no source for this, so there is none to check. The quote shows it is in the paper.
In the paper
“No randomization method was used for the assignment of mice or cells to study groups, and no animals or data points were excluded from these studies.”
§ The APOE-R136S mutation protects against APOE4-driven Tau pathology, neurodegeneration and neuroinflammation > Methods > General statistics and reproducibility
plain- Asserted: passes — The authors put it forward as true.
- Checkable: passes — It can be checked against evidence.
- Load-bearing: fails — The paper’s conclusions may not depend on it.
- Based: passes — The paper gives a reason why it holds.
Probably not a substantial claim. The paper’s conclusions may not depend on it.
What the paper did — it cites no source for this, so there is none to check. The quote shows it is in the paper.
In the paper
“Analyses were conducted via automated ImageJ macros to the extent possible to remove human bias.”
§ The APOE-R136S mutation protects against APOE4-driven Tau pathology, neurodegeneration and neuroinflammation > Methods > Immunohistochemistry
plain- Asserted: passes — The authors put it forward as true.
- Checkable: passes — It can be checked against evidence.
- Load-bearing: fails — The paper’s conclusions may not depend on it.
- Based: passes — The paper gives a reason why it holds.
Probably not a substantial claim. The paper’s conclusions may not depend on it.
What the paper did — it cites no source for this, so there is none to check. The quote shows it is in the paper.
In the paper
“Analysts measuring cell layer thickness were blinded to sample to exclude the possibility of bias.”
§ The APOE-R136S mutation protects against APOE4-driven Tau pathology, neurodegeneration and neuroinflammation > Methods > DG GC layer thickness measurement
plain- Asserted: passes — The authors put it forward as true.
- Checkable: passes — It can be checked against evidence.
- Load-bearing: fails — The paper’s conclusions may not depend on it.
- Based: passes — The paper gives a reason why it holds.
Probably not a substantial claim. The paper’s conclusions may not depend on it.
What the paper did — it cites no source for this, so there is none to check. The quote shows it is in the paper.
In the paper
“The ssODN was designed to convert APOE4 to APOE4-R136S with a silent mutation at the PAM site to prevent repeated Cas9 cutting in edited cells.”
§ The APOE-R136S mutation protects against APOE4-driven Tau pathology, neurodegeneration and neuroinflammation > Methods > Generating and characterizing isogenic E4-S/S and E4-R/S hiPSC lines by CRISPR–Cas-9-mediated gene editing
plaindirect- Asserted: passes — The authors put it forward as true.
- Checkable: passes — It can be checked against evidence.
- Load-bearing: fails — The paper’s conclusions may not depend on it.
- Based: passes — The paper gives a reason why it holds.
Probably not a substantial claim. The paper’s conclusions may not depend on it.
What the paper did — it cites no source for this, so there is none to check. The quote shows it is in the paper.
In the paper
“The top sgRNA was selected after testing cutting efficiency in pooled, nucleofected cells using the Synthego ICE analysis tool (Synthego Performance Analysis, 2019).”
§ The APOE-R136S mutation protects against APOE4-driven Tau pathology, neurodegeneration and neuroinflammation > Methods > Generating and characterizing isogenic E4-S/S and E4-R/S hiPSC lines by CRISPR–Cas-9-mediated gene editing
plain- Asserted: passes — The authors put it forward as true.
- Checkable: passes — It can be checked against evidence.
- Load-bearing: fails — The paper’s conclusions may not depend on it.
- Based: passes — The paper gives a reason why it holds.
Probably not a substantial claim. The paper’s conclusions may not depend on it.
What the paper did — it cites no source for this, so there is none to check. The quote shows it is in the paper.
In the paper
“To increase editing efficient, gRNAs were selected based on the proximity of their cutting site to the expected mutation, high targeting efficiency and low predicted off-target effects.”
§ The APOE-R136S mutation protects against APOE4-driven Tau pathology, neurodegeneration and neuroinflammation > Methods > Generation of APOE4-R136S knock-in mice by CRISPR–Cas-9-mediated gene editing
plaindirect- Asserted: passes — The authors put it forward as true.
- Checkable: passes — It can be checked against evidence.
- Load-bearing: fails — The paper’s conclusions may not depend on it.
- Based: passes — The paper gives a reason why it holds.
Probably not a substantial claim. The paper’s conclusions may not depend on it.
What the paper did — it cites no source for this, so there is none to check. The quote shows it is in the paper.
In the paper
“As a result of the variability in pathology in PS19-E4 and PS19-E4-R/S groups, we specifically chose mice whose quantified pathological parameters spanned the range of pathological measurements. This allowed us to correlate pathologies with snRNA-seq data.”
§ The APOE-R136S mutation protects against APOE4-driven Tau pathology, neurodegeneration and neuroinflammation > Methods > General statistics and reproducibility
plaincorrelationaln = 4- Asserted: passes — The authors put it forward as true.
- Checkable: passes — It can be checked against evidence.
- Load-bearing: passes — The paper’s conclusions depend on it.
- Based: passes — The paper gives a reason why it holds.
Probably not a substantial claim. It may state two separate claims as one.
What the paper did — it cites no source for this, so there is none to check. The quote shows it is in the paper.
In the paper
“Analysts drawing regions of interest and setting standard threshold values were blinded to sample also, to exclude the possibility of bias.”
§ The APOE-R136S mutation protects against APOE4-driven Tau pathology, neurodegeneration and neuroinflammation > Methods > Immunohistochemistry
plain- Asserted: passes — The authors put it forward as true.
- Checkable: passes — It can be checked against evidence.
- Load-bearing: fails — The paper’s conclusions may not depend on it.
- Based: passes — The paper gives a reason why it holds.
Probably not a substantial claim. The paper’s conclusions may not depend on it.
What the paper did — it cites no source for this, so there is none to check. The quote shows it is in the paper.
In the paper
“Categorization of the p-Tau staining type was performed manually, and analysts were blinded to sample.”
§ The APOE-R136S mutation protects against APOE4-driven Tau pathology, neurodegeneration and neuroinflammation > Methods > Immunohistochemistry
plain- Asserted: passes — The authors put it forward as true.
- Checkable: passes — It can be checked against evidence.
- Load-bearing: fails — The paper’s conclusions may not depend on it.
- Based: passes — The paper gives a reason why it holds.
Probably not a substantial claim. The paper’s conclusions may not depend on it. It may state two separate claims as one.
What the paper did — it cites no source for this, so there is none to check. The quote shows it is in the paper.
In the paper
“To control for other potential cellular processes contributing to 488 positivity or autofluorescence in response to recombinant Tau, E4 cells were treated with 25 nM unlabeled recombinant Tau for 1 h at 37 °C as described before analysis by flow cytometry (Extended Data Fig. 4).”
§ The APOE-R136S mutation protects against APOE4-driven Tau pathology, neurodegeneration and neuroinflammation > Methods > Tau uptake assay
plain- Asserted: passes — The authors put it forward as true.
- Checkable: passes — It can be checked against evidence.
- Load-bearing: fails — The paper’s conclusions may not depend on it.
- Based: passes — The paper gives a reason why it holds.
Probably not a substantial claim. The paper’s conclusions may not depend on it.
What the paper did — it cites no source for this, so there is none to check. The quote shows it is in the paper.
In the paper
“Sample sizes for PS19-E mouse and hiPSC immunohistochemical, flow cytometry and biochemical studies were chosen on the basis of estimates to provide statistical power of ≥80% and alpha of 0.05 based on preliminary data.”
§ The APOE-R136S mutation protects against APOE4-driven Tau pathology, neurodegeneration and neuroinflammation > Methods > General statistics and reproducibility
hedged- Asserted: passes — The authors put it forward as true.
- Checkable: passes — It can be checked against evidence.
- Load-bearing: fails — The paper’s conclusions may not depend on it.
- Based: passes — The paper gives a reason why it holds.
Probably not a substantial claim. The paper’s conclusions may not depend on it.
What the paper did — it cites no source for this, so there is none to check. The quote shows it is in the paper.
In the paper
“Studies on hiPSC-derived neurons were performed with biological replicates over two or three independent rounds of differentiations.”
§ The APOE-R136S mutation protects against APOE4-driven Tau pathology, neurodegeneration and neuroinflammation > Methods > General statistics and reproducibility
plain- Asserted: passes — The authors put it forward as true.
- Checkable: passes — It can be checked against evidence.
- Load-bearing: fails — The paper’s conclusions may not depend on it.
- Based: passes — The paper gives a reason why it holds.
Probably not a substantial claim. The paper’s conclusions may not depend on it.
What the paper did — it cites no source for this, so there is none to check. The quote shows it is in the paper.
In the paper
“Studies using mouse tissue were performed using one cohort of mice.”
§ The APOE-R136S mutation protects against APOE4-driven Tau pathology, neurodegeneration and neuroinflammation > Methods > General statistics and reproducibility
plain- Asserted: passes — The authors put it forward as true.
- Checkable: passes — It can be checked against evidence.
- Load-bearing: fails — The paper’s conclusions may not depend on it.
- Based: passes — The paper gives a reason why it holds.
Probably not a substantial claim. The paper’s conclusions may not depend on it.
The paper relies on this without support.
The PS19 tauopathy mouse model crossed with human APOE4-KI mice recapitulates APOE4-driven AD tau pathology sufficiently to test protection by R136S.
“we cross-bred isogenic E4-KI and E4-R136S-KI mice with a widely used tauopathy mouse model expressing Tau-P301S (PS19 line)53.”
The paper relies on this without support.
The engineered R136S mutation in mouse and hiPSC APOE4 has the same functional consequence of defective HSPG binding as the human APOE3-R136S.
“we engineered the R136S mutation into the APOE4 allele background both in vivo in human APOE4 knock-in (E4-KI) mice52 and in vitro in human induced pluripotent stem cells (hiPSCs) derived from a patient with AD with homozygous APOE4 (ref. 6).”
The paper relies on this without support.
E4 neuron-conditioned medium increases p-Tau in E3 and E4-S/S neurons through exogenous APOE4 rather than other secreted factors.
“Thus, the presence of exogenous APOE4, even with much higher endogenous APOE4-S/S levels (Fig. 2a,b), was sufficient to increase p-Tau accumulation in E4-S/S neurons to levels similar to those seen in E4 neurons.”
The paper relies on this without support.
The top predicted off-target sites are sufficient to rule out off-target effects of CRISPR editing on phenotypes.
“found no changes within the top predicted potential off-target sites”
The paper relies on this without support.
Correlations between gliosis markers and hippocampal volume reflect a causal contribution of gliosis to hippocampal degeneration.
“suggesting the contribution of astrocytosis to hippocampal degeneration”
The paper relies on this without support.
The APOE4-expressing tauopathy mouse model and hiPSC-derived neurons from a patient with AD are valid models for APOE4-driven AD pathologies relevant to human disease.
“In the present study, we demonstrate the protective power of the R136S mutation against APOE4-driven effects in a tauopathy mouse model and in hiPSC-derived neurons from a patient with AD, neither of which exhibit extensive Aβ pathology.”
The authors state this as an assumption.
Data distribution was assumed to be normal, but this was not formally tested.
“Data distribution was assumed to be normal, but this was not formally tested.”
Claims other papers make about this one
Each is checked against this paper’s own text: does it say what the citing paper says it does?
The source backs part of the claim, not all of it — or backs it for a different population, condition or comparison.
In the citing paper
“The homozygous Christchurch mutation also suppresses AD pathologies in amyloid and non-amyloid mouse models26,27.”
From Decreased lipidated ApoE‐receptor interactions confer protection against pathogenicity of ApoE and its lipid cargoes in lysosomes (2025) · cites this paper as [27]
Experimental — accuracy not yet measuredThe source backs part of the claim, not all of it — or backs it for a different population, condition or comparison.
In the citing paper
“Decreased LDLR binding may thus also contribute to the protective effects of this mutation26,27.”
From Decreased lipidated ApoE‐receptor interactions confer protection against pathogenicity of ApoE and its lipid cargoes in lysosomes (2025) · cites this paper as [27]
Experimental — accuracy not yet measuredThe source backs part of the claim, not all of it — or backs it for a different population, condition or comparison.
In the citing paper
“In mice homozygous for the Christchurch variant, these studies indicate that microglial activation states are suppressed in PS19 mice (tau-associated pathology), promoting a homeostatic or “disease protective” response, whereas they are enhanced in APP/PS1 mice (amyloid-associated pathology), promoting a “disease-associated” state.”
From APOE Christchurch enhances a disease-associated microglial response to plaque but suppresses response to tau pathology (2025) · cites this paper as [76]
Experimental — accuracy not yet measuredThe source backs part of the claim, not all of it — or backs it for a different population, condition or comparison.
In the citing paper
“Thus, the impact of the Christchurch variant appears to be dependent on the stimulus – i.e., plaques or tau-laden neurons.”
From APOE Christchurch enhances a disease-associated microglial response to plaque but suppresses response to tau pathology (2025) · cites this paper as [76]
Experimental — accuracy not yet measuredThe source backs part of the claim, not all of it — or backs it for a different population, condition or comparison.
In the citing paper
“Immunostaining for MC-1, a conformation-specific antibody for aggregated tau19, indicated a marked decrease in tau load across the hippocampus in E3S/S/P301S mice, consistent with previous studies (Fig. 1D–G)14.”
From The R136S mutation in the APOE3 gene confers resilience against tau pathology via inhibition of the cGAS-STING-IFN pathway (2025) · cites this paper as [14]
Experimental — accuracy not yet measured
The source backs part of the claim, not all of it — or backs it for a different population, condition or comparison.
In the citing paper
“APOE expression was not affected by R136S on the APOE4 background in the Nelson et al study14.”
From The R136S mutation in the APOE3 gene confers resilience against tau pathology via inhibition of the cGAS-STING-IFN pathway (2025) · cites this paper as [14]
Experimental — accuracy not yet measuredThe source backs part of the claim, not all of it — or backs it for a different population, condition or comparison.
In the citing paper
“Similarly, Nelson et al. (2023) demonstrated that introducing the R136S mutation into APOE4 backgrounds robustly rescues APOE4-driven tau pathology in mouse models and human iPSC-derived neurons, suggesting a broad tau-protective capacity of APOE3ch/R136S in a late-onset AD risk context.”
From Isogenic human stem cell models reveal mutation-dependent protective mechanisms of APOE3 Christchurch (2026) · cites this paper as Nelson et al., 2023
Experimental — accuracy not yet measuredThe source backs part of the claim, not all of it — or backs it for a different population, condition or comparison.
In the citing paper
“ApoE has been detected in EVs and proposed as a therapeutic mediator, 56 while APOE3Ch is linked to increased homeostatic astrocytes and microglia and reduced disease‐associated populations. 75”
From Plasma extracellular vesicles from APOE3 Christchurch carriers display a protective phenotype in early stages of autosomal dominant Alzheimer's disease (2026) · cites this paper as [75]
Experimental — accuracy not yet measuredThe source backs part of the claim, not all of it — or backs it for a different population, condition or comparison.
In the citing paper
“Mounting evidence from human-based, in vitro, and in vivo studies has linked APOE3Ch to reduction in tau pathology [3–7, 24, 26, 41, 42].”
From Astrocytic APOE3-Christchurch expression ameliorates brain amyloid-β pathology in 5xFAD mice (2026) · cites this paper as [6]
Experimental — accuracy not yet measuredThe cited source says what the claim attributes to it.
In the citing paper
“While it is well documented that iPS cell systems can model aspects of AD pathology (Penney et al., 2020; Nelson et al., 2023)”
From APOE3 Christchurch modulates β-catenin/Wnt signaling in iPS cell-derived cerebral organoids from Alzheimer’s cases (2024) · cites this paper as Nelson et al., 2023
The cited source says what the claim attributes to it.
In the citing paper
“Similar to ApoE2, Christchurch (R136S) mutation is protective in autosomal dominant AD cases24,25 and AD mouse models26,27.”
From Decreased lipidated ApoE‐receptor interactions confer protection against pathogenicity of ApoE and its lipid cargoes in lysosomes (2025) · cites this paper as [27]
The cited source says what the claim attributes to it.
In the citing paper
“While this report was being prepared, independent studies reported similar findings [41, 76, 77].”
From APOE Christchurch enhances a disease-associated microglial response to plaque but suppresses response to tau pathology (2025) · cites this paper as [76]
The cited source says what the claim attributes to it.
In the citing paper
“Previous studies provide evidence that the Christchurch variant reduces AD pathology and associated CNS damage at least in part through alterations in receptor binding to LRP1, LDLR and/or HSPGs [15, 41, 76].”
From APOE Christchurch enhances a disease-associated microglial response to plaque but suppresses response to tau pathology (2025) · cites this paper as [76]
The cited source says what the claim attributes to it.
In the citing paper
“HSPGs are responsible for neuronal uptake of tau and the R136S mutation causes impaired binding affinity of APOE to HSPGs, leading to reduced tau pathology [15, 41, 76, 84, 85].”
From APOE Christchurch enhances a disease-associated microglial response to plaque but suppresses response to tau pathology (2025) · cites this paper as [76]
The cited source says what the claim attributes to it.
In the citing paper
“In mouse models on the risk-enhancing E4 background, the R136S mutation protected against tau pathology, neurodegeneration, and neuroinflammation14.”
From The R136S mutation in the APOE3 gene confers resilience against tau pathology via inhibition of the cGAS-STING-IFN pathway (2025) · cites this paper as [14]
The cited source says what the claim attributes to it.
In the citing paper
“Additionally, transcriptomic changes have been observed in oligodendrocyte subpopulations with the R136S mutation on an E4 background14.”
From The R136S mutation in the APOE3 gene confers resilience against tau pathology via inhibition of the cGAS-STING-IFN pathway (2025) · cites this paper as [14]
The cited source says what the claim attributes to it.
In the citing paper
“Previous findings showed that R136S mutation enhances microglial response around amyloid plaques on E3 background15, but downregulates disease-associated gene profiles on E4 background14.”
From The R136S mutation in the APOE3 gene confers resilience against tau pathology via inhibition of the cGAS-STING-IFN pathway (2025) · cites this paper as [14]
The cited source says what the claim attributes to it.
In the citing paper
“This prediction was confirmed in vivo in 2023 by two studies that used mouse models expressing human APOE3 or APOE4 with the Christchurch mutation, which showed amelioration of AD phenotypes when compared with APOE3 or APOE4 mice, particularly those related to tau accumulation and microglial response197,198.”
From Multifaceted roles of APOE in Alzheimer disease (2024) · cites this paper as [197]
The cited source says what the claim attributes to it.
In the citing paper
“The Christchurch mutation also resulted in decreased tauopathy in an APOE4 background (Nelson et al., 2023), mouse Apoe background (Tran et al., 2025), and in AAV-mediated expression models (Gunaydin et al., 2024).”
From APOE3-Christchurch variant enhances neurovascular support functions of iPSC-derived mesenchymal stromal cells (2026) · cites this paper as Nelson et al., 2023
The cited source says what the claim attributes to it.
In the citing paper
“APOE3‐Ch has been associated with reduced Alzheimer's disease (AD) risk and neuroprotection in individuals carrying high‐risk genetic mutations for AD.”
From Protective mechanisms against Alzheimer's disease in APOE3‐Christchurch homozygous astrocytes (2025) · cites this paper as [7]
The cited source says what the claim attributes to it.
In the citing paper
“but downregulates disease-associated gene profiles on the E4 background14”
From APOE3 - R136S mutation confers resilience against tau pathology via cGAS-STING-IFN inhibition (2024) · cites this paper as [14]
The cited source says what the claim attributes to it.
In the citing paper
“In mouse models on the risk-enhancing APOE4 background, the R136S mutation was found to protect against tau pathology, neurodegeneration, and neuroinflammation14.”
From APOE3 - R136S mutation confers resilience against tau pathology via cGAS-STING-IFN inhibition (2024) · cites this paper as [14]
The cited source says what the claim attributes to it.
In the citing paper
“In addition, transcriptomic changes were observed in a specific oligodendrocyte subpopulation on an E4 background with the R136S mutation14.”
From APOE3 - R136S mutation confers resilience against tau pathology via cGAS-STING-IFN inhibition (2024) · cites this paper as [14]
Self-check
Percentages, sums and reported differences re-computed from the paper’s own numbers.
Each contradiction between two passages listed here was confirmed by an independent check.
Rated minor: it would not touch a result — a value no result rests on, a p-value that stays on the same side of the significance level, or a conflict that is clerical, resolved elsewhere in the paper, or outside its own findings.
In the paper
§ The APOE-R136S mutation protects against APOE4-driven Tau pathology, neurodegeneration and neuroinflammation > Results > E4-S/S reduces microgliosis in tauopathy mice
“Unlike the data in astrocytosis, the relationship between microgliosis and hippocampal degeneration in PS19-E3 and PS19-E4 mice was somewhat preserved (Fig. 5r,s,v,w).”
§ The APOE-R136S mutation protects against APOE4-driven Tau pathology, neurodegeneration and neuroinflammation > Results > E4-S/S reduces astrocytosis in tauopathy mice
“q–t, Correlations between Iba1+ cells per mm2 and hippocampal volume in PS19-E4 (n = 31) (q), PS19-E3 (n = 23) (r), PS19-E4-S/S (n = 20) (s) and PS19-E4-R/S (n = 23) (t) mice.”
Citations
Cites
Controlling the False Discovery Rate: A Practical and Powerful Approach to Multiple Testing
Benjamini, Y., & Hochberg, Y. (1995) · Journal of the Royal Statistical Society Series B: Statistical Methodology · doi:10.1111/j.2517-6161.1995.tb02031.x · Cited by 109,482
Fitting Linear Mixed-Effects Models Using lme4
Bates, D., Mächler, M., Bolker, B., & Walker, S. (2015) · Journal of Statistical Software · doi:10.18637/jss.v067.i01 · Cited by 86,835
Fiji: an open-source platform for biological-image analysis
Schindelin, J., Arganda-Carreras, I., Frise, E., Kaynig, V., Longair, M., Pietzsch, T., Preibisch, S., Rueden, C., Saalfeld, S., Schmid, B., et al. (2012) · Nature Methods · doi:10.1038/nmeth.2019 · Cited by 66,890
Takahashi, K., & Yamanaka, S. (2006) · Cell · doi:10.1016/j.cell.2006.07.024 · Cited by 26,673
Fast unfolding of communities in large networks
Blondel, V. D., Guillaume, J.-L., Lambiotte, R., & Lefebvre, E. (2008) · Journal of Statistical Mechanics: Theory and Experiment · doi:10.1088/1742-5468/2008/10/p10008 · Cited by 21,424
Induction of Pluripotent Stem Cells from Adult Human Fibroblasts by Defined Factors
Takahashi, K., Tanabe, K., Ohnuki, M., Narita, M., Ichisaka, T., Tomoda, K., & Yamanaka, S. (2007) · Cell · doi:10.1016/j.cell.2007.11.019 · Cited by 20,221
Neuropathological stageing of Alzheimer-related changes.
Braak, H., & Braak, E. (1991) · Acta Neuropathologica · doi:10.1007/bf00308809 · Cited by 16,123 · cited 1×
“Tau accumulation and propagation during AD progression correlate with neurodegeneration and clinical effects 49 , which are major targets in the development of disease-modifying therapies for AD 50,51 .”
BackgroundIntegrated analysis of multimodal single-cell data
Hao, Y., Hao, S., Andersen-Nissen, E., Mauck, W. M., Zheng, S., Butler, A., Lee, M. J., Wilk, A. J., Darby, C., Zagar, M., et al. (2020) · doi:10.1101/2020.10.12.335331 · Cited by 15,508
Self-citationclusterProfiler 4.0: A universal enrichment tool for interpreting omics data
(2021) · doi:10.1016/j.xinn.2021.100141 · Cited by 12,455
Amyloid oligomers exacerbate tau pathology in a mouse model of tauopathy
Selenica, M.-L. B., Brownlow, M., Jimenez, J. P., Lee, D. C., Pena, G., Dickey, C. A., Gordon, M. N., & Morgan, D. (2013) · Neurodegenerative Diseases · doi:10.1159/000337230 · Cited by 10,359
Cited by
Sorted by citations
Items 101–115 of 115
Mahley, R. W. (2026) · Springer eBooks · doi:10.1007/978-3-031-96089-5_2
Self-citationApolipoprotein E (APOE) in Alzheimer’s Disease: Mechanisms, Modifiers, and Therapeutic Implications
Rehman, S. U. (2026) · Bengal Journal of Psychiatry · doi:10.25259/bjpsy_2_2026
Rodriguez Martinez, P. J., Yslas, A. R., Inoue, Y., Parsons, T. M., Baker, S. K., Lu, W., Raulin, A.-C., & Kanekiyo, T. (2026) · Frontiers in Molecular Biosciences · doi:10.3389/fmolb.2026.1778856
Apolipoprotein E and infectious diseases: A framework for therapeutic developments
Viswalingam, V., Kumar, D., Tewari, S., & Ganeshpurkar, A. (2026) · Elsevier eBooks · doi:10.1016/b978-0-443-40563-1.00018-1
Apolipoprotein E (ApoE): Structural insights, functionality, and genetic variability
Viswalingam, V., Kumar, D., Tewari, S., & Ganeshpurkar, A. (2026) · Elsevier eBooks · doi:10.1016/b978-0-443-40563-1.00001-6
The past, present, and future of Alzheimer's disease—part 3: the future
Nitríni, R., Takada, L. T., & Brucki, S. M. D. (2026) · Arquivos de Neuro-Psiquiatria · doi:10.1055/s-0046-1824435
Wei, H., Zhang, T., Liang, Z., Li, M., Kong, M., & Ba, M. (2026) · Frontiers in Aging Neuroscience · doi:10.3389/fnagi.2026.1889743
Quiroz, Y. T., Tristão‐Pereira, C., Malotaux, V., Zuluaga, Y., Muñoz, C., Silva, G. D., He, B., Alzate, D., Bocanegra, Y., Naranjo, A. G., et al. (2026) · Research Square · doi:10.21203/rs.3.rs-10145165/v1
Self-citationPlasma Biomarker Profiles in a Colombian Cohort of Heterozygous APOE3-Christchurch CarriersPreprint
Malotaux, V., Tristão‐Pereira, C., Zuluaga, Y., Muñoz, C., Guerrero, A., Bocanegra, Y., Alzate, D., Serna, L., Guzmán, C., Ospina, C., et al. (2026) · Research Square · doi:10.21203/rs.3.rs-10705602/v1
Self-citationArif, S., Luo, Q., Hao, X., Zheng, R., Sun, N., Quan, Z., Ni, J., Qiu, Y., & Qing, H. (2026) · Research Square · doi:10.21203/rs.3.rs-10721231/v1
Astrocytic synapse engulfment is differentially controlled by APOE genotype
Sekizar, S., Holt, K., Meyers, S., Tzioras, M., King, D., Tulloch, J., Jackson, R. J., & Spires‐Jones, T. L. (2026) · Neuroscience · doi:10.1016/j.neuroscience.2026.09.026
Frisch, C., Baker, L., Srinivasan, G., Mintah, A. E., Leyasi, S., Pedroza, M., Galyon, B., & Brafman, D. A. (2026) · Frontiers in Aging Neuroscience · doi:10.3389/fnagi.2026.1856154
Emerging therapeutic strategies to target APOE4 in Alzheimer's disease
Jiang, W. I., 王冰莹, & Ma, D. K. (2026) · FEBS Journal · doi:10.1111/febs.70759
Namba, N., Ariyoshi, S., Shimba, A., Shiroshita, H., Ohgita, T., & Saito, H. (2026) · ACS Omega · doi:10.1021/acsomega.6c09295
Chen, G., Wang, M., Zhang, Z., Hong, D. K., Ahn, E. H., Liu, X., Kang, S. S., & Ye, K. (2025) · Neuron · doi:10.1016/j.neuron.2024.12.015 · Cited by 21
Metadata
- Authors
- Nelson, M. R., Liu, P., Agrawal, A., Yip, O., Blumenfeld, J., Traglia, M., Kim, M. J., Koutsodendris, N., Rao, A., Grone, B., Hao, Y., Yoon, S. Y., Xu, Q., De Leon, S., Choenyi, T., Thomas, R., Lopera, F., Quiroz, Y. T., Arboleda-Velasquez, J. F., Reiman, E. M., Mahley, R. W., & Huang, Y.
- Affiliations
- Gladstone Institutes (US)
- Universidad de Antioquia (CO)
- Harvard University (US)
- University of Arizona (US)
- Corresponding author
- Huang, Yadong
- ORCID
- Venue
- Nature Neuroscience
- Published
- 2023-11-13
- Volume
- 26
- Issue
- 12
- Pages
- 2104-2121
- ISSN
- 1097-6256 (ISSN-L)
- 1546-1726
- PMC
- PMC10689245
- OpenAlex
- W4388625926
- Cited by
- 120
- References
- 103
- Citations by year
- 2026: 34 · 2025: 47 · 2024: 37 · 2023: 2
- FWCI
- 11.71
- Type
- journal article
- Language
- en
- Open access
- hybrid
- doi.org
- Locations
- Nature Neuroscience (publishedVersion, cc-by)
- PubMed Central (publishedVersion, cc-by)
- PubMed (publishedVersion)
- eScholarship (California Digital Library) (submittedVersion)
- eScholarship (California Digital Library) (submittedVersion, cc-by)
- Repositorio Digital - Academia Colombiana de Ciencias Exactas, Fisicas y Naturales (submittedVersion, other-oa)
- UA Campus Repository (The University of Arizona) (submittedVersion, cc-by)
- Greater South Information System
- Funders
- U.S. Department of Health & Human Services | NIH | National Institute on Aging (R01AG071697, RF1AG076647, P01AG073082, F31AG074690, F31AG074672, P3AG072980, RF1AG059751)
- Topics
- Life Sciences › Neuroscience › Cellular and Molecular Neuroscience › Alzheimer's disease research and treatments
- Health Sciences › Medicine › Psychiatry and Mental health › Dementia and Cognitive Impairment Research
- Life Sciences › Neuroscience › Neurology › Neuroinflammation and Neurodegeneration Mechanisms
- Keywords
- APOE ε4, Alzheimer's disease, tau pathology, neurodegeneration, neuroinflammation, iPSC-derived neurons, single-nucleus RNA sequencing, gene dosage, neuroprotection, therapeutic target
- MeSH terms
- Neuroinflammatory Diseases, Alzheimer Disease, Animals, Apolipoproteins E, Humans, Mutation, Tauopathies, Mice, Apolipoprotein E3, Apolipoprotein E4
About these checks
Registry, retraction, Cites and statistics results are computed, not judged, with one exception: a printed reference that no index lists is read once by a model before it counts as a citation error. Claims are extracted by a model and kept only when their quote appears verbatim in the text; each cited source is then checked, with a model’s help, for whether it says what the claim relies on. Those verdicts can be wrong — read the claim’s quote and the cited source before relying on one.
A language model drew the claims from the paper on 2026-10-31, under version 3 of the claim definition (model deepseek-v4.1-flash, prompt extract-v3).
A second model labelled each claim on 2026-10-31 (model jev-1.13-20260917, definition revision gold-guideline-v0.2).
Cited sources are checked with a language model’s help (gpt-6-sol).
Statistics and arithmetic are recomputed, not judged.
Confidence bands are shown only for fields calibrated on our annotated test set. None is calibrated yet, so no band is shown.
What counts as a claim ›How we measure confidence ›How we check this ›
Are you an author, or do you see a problem with this page? Request a review
