

The DOI matches its Crossref record; 69 of the 69 references it cites were found in a registry or an index; 46 of the 55 sources its claims cite were checked for support.
APOE4 to APOE2 allelic switching in mice improves Alzheimer’s disease-related metabolic signatures, neuropathology and cognition
Open accessAbstract
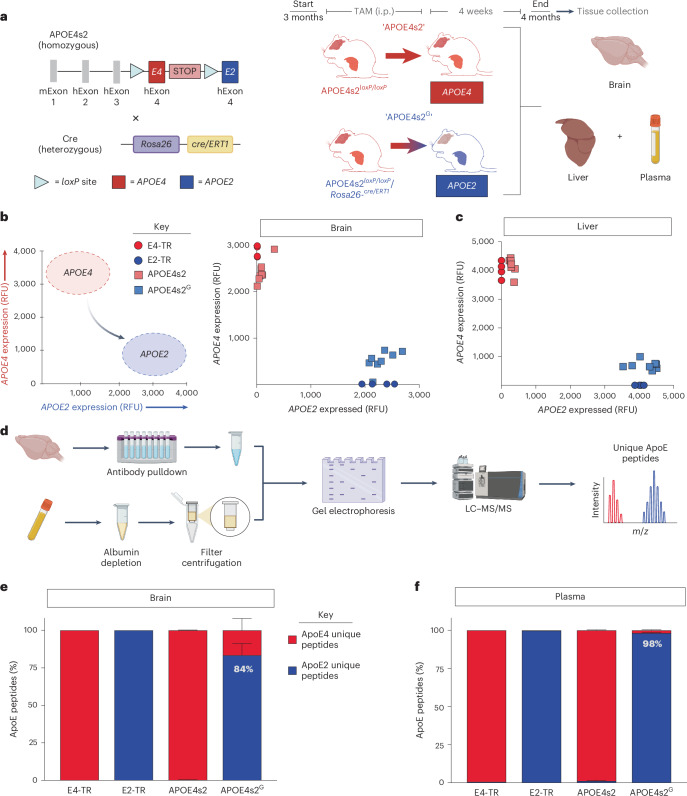
Compared to individuals carrying two copies of the ε4 allele of apolipoprotein E (APOE), ε2 homozygotes have an approximate 99% reduction in late-onset Alzheimer’s disease (AD) risk. Here we develop a knock-in model that allows for an inducible ‘switch’ between risk and protective alleles (APOE4s2). Gene expression and proteomic analyses confirm that APOE4s2 mice synthesize E4 at baseline and E2 after tamoxifen administration. A whole-body allelic switch results in a metabolic profile resembling E2/E2 humans and drives AD-relevant alterations in the lipidome and single-cell transcriptome, particularly in astrocytes. Finally, when crossed to the 5xFAD background, astrocyte-specific E4 to E2 switching improves cognition, decreases amyloid pathology, lowers gliosis and reduces plaque-associated apolipoprotein E. Together, these data show that a short-term transition from APOE4 to APOE2 can broadly affect the cerebral transcriptome and lipidome, and that astrocyte-specific APOE replacement may be a viable strategy for future gene editing approaches to simultaneously reduce multiple AD-associated pathologies. Using a mouse model enabling an inducible ‘switch’, Golden et al. show that an astrocyte-specific replacement of the Alzheimer’s risk gene APOE4 with protective APOE2 alters metabolism and gene expression, reducing amyloid pathology and gliosis.
Overview
AI snapshot
Written from the paper’s full text.
TL;DR
An inducible APOE4-to-APOE2 switch mouse shows efficient allele replacement and E2-like metabolic, lipidomic, and transcriptomic changes, especially in astrocytes. Astrocyte-specific switching in 5xFAD mice reduces amyloid, gliosis, and plaque-associated ApoE and improves associative memory.
Key findings
- APOE4s2 mice synthesize E4 at baseline and switch to E2 after tamoxifen; 84–93% of brain and 92–99% of plasma ApoE peptides detected were E2-unique in global switch mice.
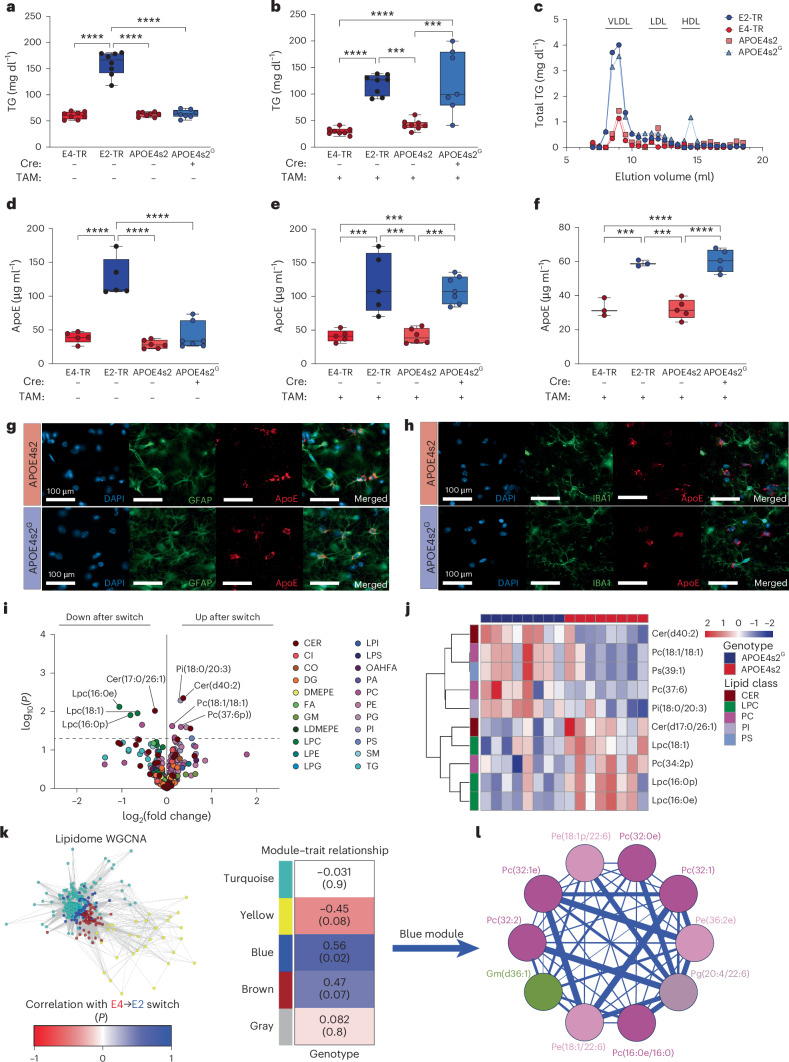
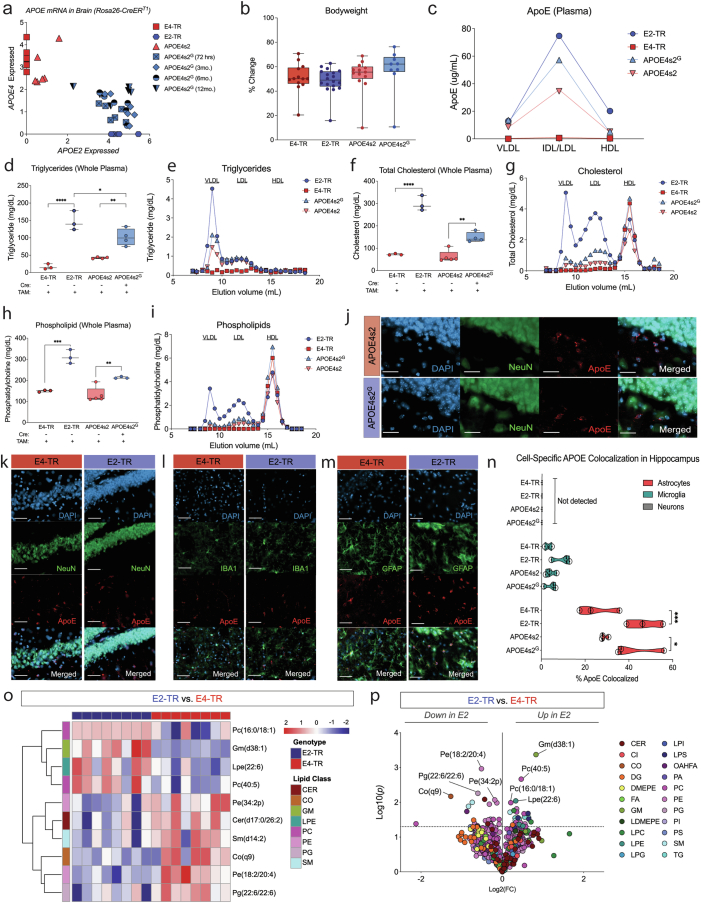
- Whole-body switch produced E2-like plasma lipids (elevated VLDL TGs and ApoE) and altered the cerebral lipidome: 14 significantly different lipid species versus Cre− controls, mostly glycerophospholipids; E2-TR versus E4-TR comparison identified 57 differing lipids.
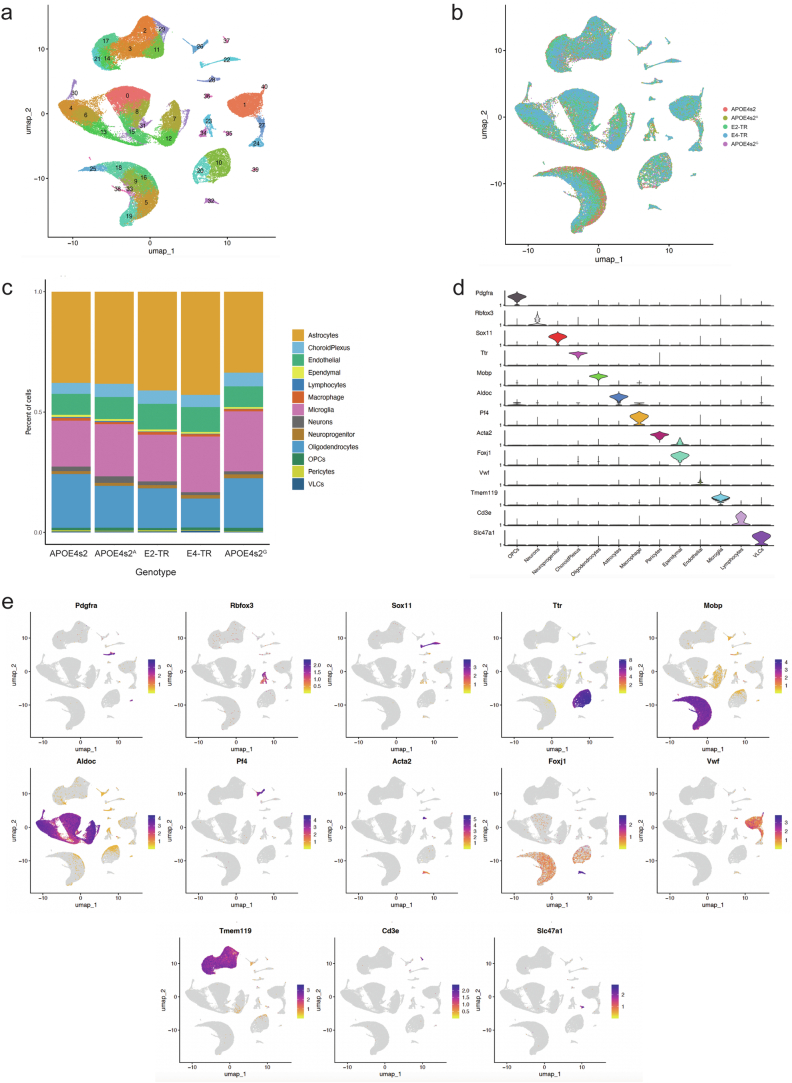
- scRNA-seq of 85,701 cells, 41 clusters, and 12 cell types found astrocytes, oligodendrocytes, microglia, and endothelial cells most affected; astrocyte-specific switch DEGs overlapped 39–60% with global switch DEGs by cell type.
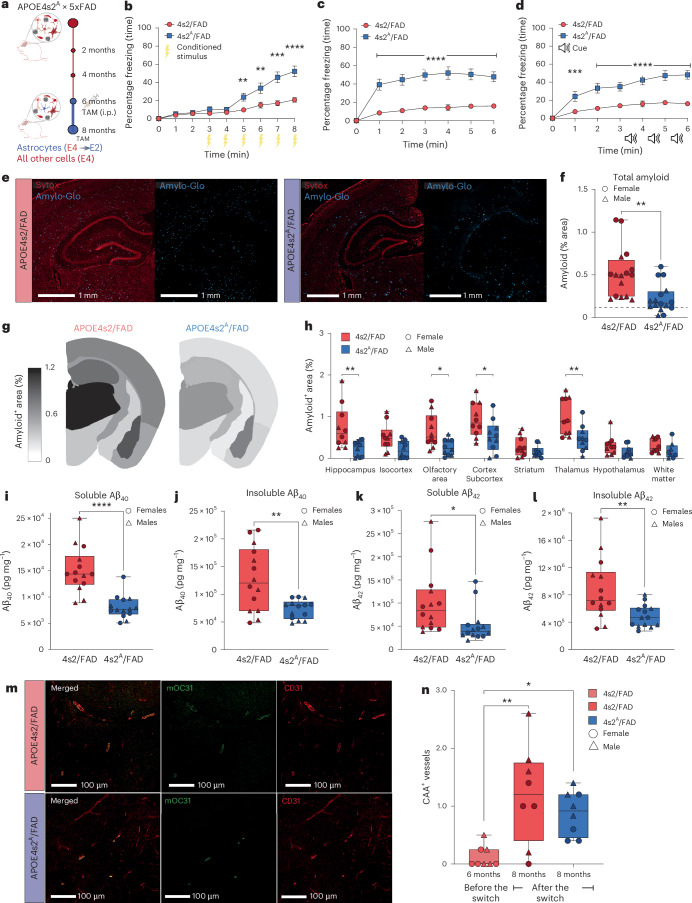
- In 4s2A/FAD (5xFAD cross) after a 2-month astrocyte-specific switch, total amyloid, soluble/insoluble Aβ40/Aβ42, GFAP, IBA1, MHC-II, and plaque-associated ApoE decreased; associative fear conditioning improved, but Morris water maze spatial learning/memory did not show striking differences and CAA was unchanged.
Methods
- Generated APOE4s2 knock-in mice with floxed human APOE4 exon 4 followed by APOE2 exon 4; crossed to ROSA26-CreERT1 for global switch or Aldh1l1-CreERT2 for astrocyte-specific switch; tamoxifen 75 mg/kg i.p. daily for 5 days.
- Used qPCR allelic discrimination, targeted LC–MS/MS proteomics, untargeted lipidomics, scRNA-seq, ApoE ELISAs, immunofluorescence/histology, and behavioral tests (fear conditioning, Morris water maze); 5xFAD cross used for AD pathology.
- Analyses included DEG/GO, WGCNA, and regional plaque/gliosis quantification; sample sizes and statistics reported in figures and Supplementary Table 3.
Limitations
- Stated: APOE risk/protection varies by ancestry; 5xFAD models amyloid but not tau; Aldh1l1-CreERT2 also has peripheral/liver expression, so peripheral ApoE contributions need dissection.
- Evident in text: Morris water maze did not show striking spatial learning/memory differences; CAA did not differ between 4s2A/FAD and controls; some sex differences were noted (for example, female controls had higher plaque loads, and female 4s2A/FAD showed the strongest memory effect).
Model-written summary. Check it against the paper before relying on it.
Integrity signals
Registry
Cites
Statistics
Figures
Verification
Claims the paper makes
83 Own result · 23 Own interpretation · 16 Partly supported · 11 Own method · 7 Supported · 2 Couldn’t confirm · 1 Supported so far · 1 Mixed support · 1 Not supported · 1 No basis given · accuracy not yet measured
Every source the paper cites for this claim was checked and supports it.
In the paper
“E2-TR mice display a plasma lipid profile similar to the type III hyperlipoproteinemia found in ~5–10% of E2/E2 humans, particularly when challenged with a high-fat diet (HFD)20.”
§ APOE4 to APOE2 allelic switching in mice improves Alzheimer’s disease-related metabolic signatures, neuropathology and cognition > Whole-body switch results in an ‘E2-like’ metabolic profile
What the sources say
- Supportedcites [20] Sullivan, P., Mezdour, H., Quarfordt, S. & Maeda, N. Type III hyperlipoproteinemia and spontaneous atherosclerosis in mice resulting from gene replacement of mouse Apoe with human Apoe*2. J. Clin. Invest. 102, 130–135 (1998). source
The Introduction states that 5–10% of human apoE2 homozygotes develop type III hyperlipoproteinemia. The Discussion says the 2/2 mice have virtually all its characteristic lipid features and that high-fat, high-cholesterol diets exacerbate their hyperlipoproteinemia. (LLM, conf=0.94)
plaincorrelational- Asserted: passes — The authors put it forward as true.
- Checkable: passes — It can be checked against evidence.
- Load-bearing: passes — The paper’s conclusions depend on it.
- Based: passes — The paper gives a reason why it holds.
- Supported
The cited sources support only part of this claim — read each source’s verdict below.
In the paper
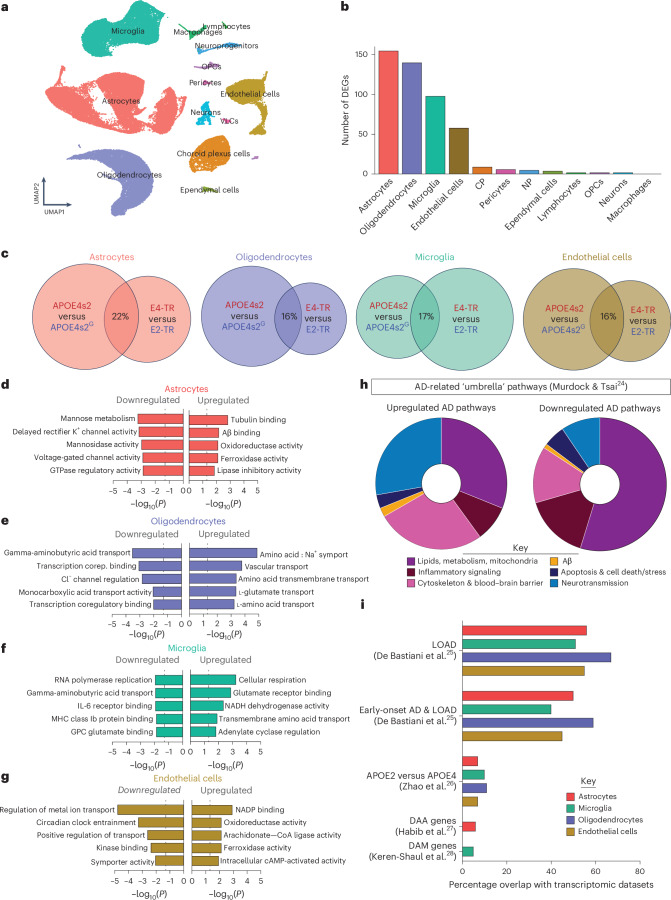
“Finally, the DEGs associated with the E4 to E2 switch also strongly reflected several APOE-associated and AD-associated gene lists, particularly the late-onset AD (LOAD) genes identified in and merged from publicly available human transcriptomic datasets (Fig. 3i)25–28.”
§ APOE4 to APOE2 allelic switching in mice improves Alzheimer’s disease-related metabolic signatures, neuropathology and cognition > Full-body switching drives AD-relevant transcriptomic changes
What the sources say
- Supportedcites [25] De Bastiani, M. A. et al. Cross-species evidence of differential expression of S100A6 and SLC11A1 in the hippocampus of Alzheimer’s disease patients and mouse models. Alzheimers Dement. 19, e060565 (2023). source
The Abstract (p. 1, Methods) says the authors merged five publicly available human AD transcriptomic profiles and analyzed differential expression; it identifies LOAD as one of the patient groups compared. This supports citing the paper as a source of the LOAD gene list. The E4-to-E2 overlap is the citing authors’ comparison, not a finding attributed to this source. (LLM, conf=0.88)
- Could not verifycites [26] Zhao, N. et al. Alzheimer’s risk factors age, APOE genotype, and sex drive distinct molecular pathways. Neuron 106, 727–742 (2020). sourceExperimental — accuracy not yet measured
The Results section on mouse-brain DEGs reports differences between APOE2 and APOE4 genotypes, and the section on human AD brains examines preservation of gene modules. Neither passage reports that DEGs from an E4-to-E2 switch strongly overlap APOE- or AD-associated gene lists, particularly a merged LOAD list. Searches for “LOAD genes” and overlap with human transcriptomic gene lists did not find that analysis in our copy. (LLM, conf=0.74)
- Supportedcites [27] Habib, N. et al. Disease-associated astrocytes in Alzheimer's disease and aging. Nat. Neurosci. 23, 701–706 (2020). source
The paper identifies an AD-associated gene list: its Abstract (page unavailable) reports a 239-gene disease-associated astrocyte signature, including APOE. In this multi-citation sentence, Habib et al. can support the identification of an AD-associated list; the E4-to-E2 overlap is the citing authors’ own analysis, not a result attributed to Habib et al. (LLM, conf=0.84)
- Supportedcites [28] Keren-Shaul, H. et al. A unique microglia type associated with restricting development of Alzheimer’s disease. Cell 169, 1276–1290 (2017). source
The Results (page not supplied) identify an AD-associated microglial gene-expression program in mice, including increased Apoe, Lpl, CD9, Cst7, and Trem2. This supports citing the paper as a source of an AD-associated gene list for the citing authors’ comparison; the E4-to-E2 overlap is the citing authors’ own analysis. (LLM, conf=0.84)
boostedcorrelational- Asserted: passes — The authors put it forward as true.
- Checkable: passes — It can be checked against evidence.
- Load-bearing: passes — The paper’s conclusions depend on it.
- Based: passes — The paper gives a reason why it holds.
- Rests on an assumption: Overlap of mouse DEGs with human AD gene lists indicates AD relevance.
- Supported
The cited sources support only part of this claim — read each source’s verdict below.
In the paper
“In agreement with previous postmortem AD studies22,23, many of these lipids were glycerophospholipids, including many phosphatidylcholine (PC) and ceramide (CER) species.”
§ APOE4 to APOE2 allelic switching in mice improves Alzheimer’s disease-related metabolic signatures, neuropathology and cognition > Whole-body switch results in an ‘E2-like’ metabolic profile
What the sources say
- Partly supportedcites [22] Lefterov, I. et al. APOE2 orchestrated differences in transcriptomic and lipidomic profiles of postmortem AD brain. Alzheimers Res. Ther. 11, 113 (2019). sourceExperimental — accuracy not yet measured
The Results section (page unavailable) reports differences in phospholipids, including PC, among APOE-genotype groups with AD. It does not report an APOE4s2G-versus-control comparison or identify many differing ceramide (CER) species. (LLM, conf=0.88)
- Partly supportedcites [23] Fitz, N. F. et al. Phospholipids of APOE lipoproteins activate microglia in an isoform-specific manner in preclinical models of Alzheimer’s disease. Nat. Commun. 12, 3416 (2021). sourceExperimental — accuracy not yet measured
The Results section (Fig. 1) reports APOE-dependent differences in phospholipids and includes phosphatidylcholine (PC) among the classes analyzed. It compares AD brains by APOE genotype and APOE3 versus APOE4 lipoproteins, not APOE4s2G with controls; the passages do not report differing ceramide (CER) species. Page numbers are unavailable in our copy. (LLM, conf=0.84)
plain- Asserted: passes — The authors put it forward as true.
- Checkable: passes — It can be checked against evidence.
- Load-bearing: unclear — It is unclear whether the paper’s conclusions depend on it.
- Based: passes — The paper gives a reason why it holds.
- Partly supported
The cited sources support only part of this claim — read each source’s verdict below.
In the paper
“Moving in vivo, other studies have explored vector-mediated delivery to supplement the E4 brain with neuroprotective E2 protein, showing that exogenous E2 markedly decreases amyloid burden in mice9–12.”
§ APOE4 to APOE2 allelic switching in mice improves Alzheimer’s disease-related metabolic signatures, neuropathology and cognition > Main
What the sources say
- Partly supportedcites [9] Dodart, J.-C. et al. Gene delivery of human apolipoprotein E alters brain Aβ burden in a mouse model of Alzheimer’s disease. Proc. Natl Acad. Sci. USA 102, 1211–1216 (2005). sourceExperimental — accuracy not yet measured
The Results report that lentiviral delivery of human apoE2 reduced hippocampal Aβ burden in PDAPP mice, including a 61.5% decrease versus controls after three months. The study does not show apoE2 supplementing an apoE4-expressing brain: the mice in the reported apoE2 experiment expressed endogenous mouse apoE. (LLM, conf=0.87)
- Partly supportedcites [10] Hudry, E. et al. Gene transfer of human Apoe isoforms results in differential modulation of amyloid deposition and neurotoxicity in mouse brain. Sci. Transl. Med. 5, 212ra161 (2013). sourceExperimental — accuracy not yet measured
The Results section reports that AAV4-delivered APOE2 reduced amyloid-plaque density in APP/PS1 mice, supporting the claim that exogenous E2 decreases amyloid burden. The Animals methods describe separate groups receiving APOE2 or APOE4 vectors; they do not establish that E2 was delivered to an E4-expressing brain, as the citing sentence suggests. No page numbers are available in our copy. (LLM, conf=0.86)
- Not checked — no full text of the sourcecites [11] Zhao, L. et al. Intracerebral adeno-associated virus gene delivery of apolipoprotein E2 markedly reduces brain amyloid pathology in Alzheimer’s disease mouse models. Neurobiol. Aging 44, 159–172 (2016). source
- Supportedcites [12] Jackson, R. J. APOE2 gene therapy reduces amyloid deposition and improves markers of neuroinflammation and neurodegeneration in a mouse model of Alzheimer disease. Mol. Ther. 32, 1373–1386 (2024). source
In the Results section, AAV-mediated APOE2 delivery to APP/PS1/APOE4 mice produced APOE2 protein in the brain. High-dose animals had significantly less cortical amyloid plaque coverage than vehicle-treated animals (about 33% less), supporting the claim that exogenous E2 markedly decreases amyloid burden in mice. (LLM, conf=0.94)
boosteddirect- Asserted: passes — The authors put it forward as true.
- Checkable: passes — It can be checked against evidence.
- Load-bearing: passes — The paper’s conclusions depend on it.
- Based: passes — The paper gives a reason why it holds.
- Partly supported
The cited sources support only part of this claim — read each source’s verdict below.
In the paper
“Studies that have successfully targeted APOE using gene editing in induced pluripotent stem cells (iPSCs) provide strong proof of concept that in vitro editing of ε4 to ε3 or ε2 simultaneously ‘corrects’ several phenotypes, including glial transcriptomic profiles, lipid metabolism and other functional measures7,8.”
§ APOE4 to APOE2 allelic switching in mice improves Alzheimer’s disease-related metabolic signatures, neuropathology and cognition > Main
What the sources say
- Partly supportedcites [7] Brookhouser, N., Raman, S., Frisch, C., Srinivasan, G. & Brafman, D. A. APOE2 mitigates disease-related phenotypes in an isogenic hiPSC-based model of Alzheimer’s disease. Mol. Psychiatry 26, 5715–5732 (2021). sourceExperimental — accuracy not yet measured
The Discussion and Results report editing APOE3 to APOE2 in hiPSC-derived cultures, with reductions in amyloid secretion and, in some cultures, phosphorylated tau. This paper does not report editing APOE4 to APOE3 or APOE2. Its Results use astrocyte RNA sequencing to identify cell populations, not to demonstrate correction of glial transcriptomic profiles or lipid metabolism (pages not specified in our copy). (LLM, conf=0.90)
- Partly supportedcites [8] Lin, Y. T. et al. APOE4 causes widespread molecular and cellular alterations associated with Alzheimer’s disease phenotypes in human iPSC-derived brain cell types. Neuron 98, 1141–1154 (2018). sourceExperimental — accuracy not yet measured
The Results section, “Converting APOE4 to APOE3,” reports that editing patient-derived iPSCs reduced astrocyte cholesterol accumulation and improved several neuronal and glial functional measures. It does not report an ε4-to-ε2 edit or show that the ε4-to-ε3 edit corrected glial transcriptomic profiles; the Discussion says APOE2’s effects warrant further study. Page numbers are unavailable in our copy. (LLM, conf=0.88)
boosteddirect- Asserted: passes — The authors put it forward as true.
- Checkable: passes — It can be checked against evidence.
- Load-bearing: passes — The paper’s conclusions depend on it.
- Based: passes — The paper gives a reason why it holds.
- Partly supported
The cited sources that could be checked couldn’t confirm or dispute this claim.
In the paper
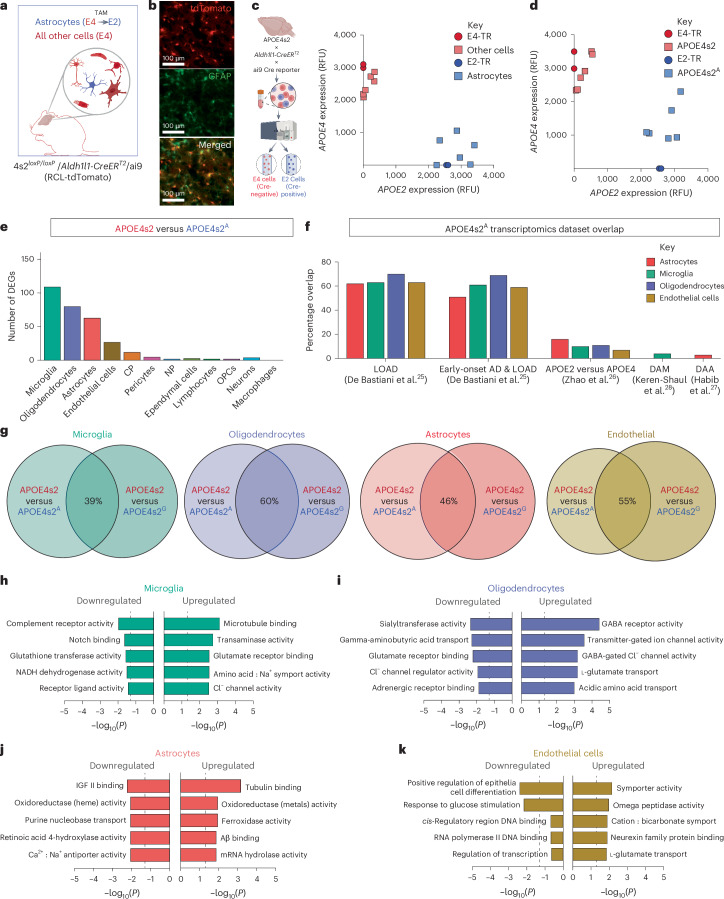
“Because astrocytes synthesize most of CNS ApoE and were the cell type most affected by the global E4 to E2 transition, we generated APOE4s2loxP/loxP/Aldh1l1-CreERT2 APOE switch mice (APOE4s2A) that would express APOE4 in all CNS cell types except for astrocytes, which would selectively transition to APOE2 upon TAM injection29,30 (Fig. 4a).”
§ APOE4 to APOE2 allelic switching in mice improves Alzheimer’s disease-related metabolic signatures, neuropathology and cognition > Astrocyte-only switch to E2 drives similar gene expression
What the sources say
- Not checked — no full text of the sourcecites [29] Xu, Q. et al. Profile and regulation of apolipoprotein E (ApoE) expression in the CNS in mice with targeting of green fluorescent protein gene to the ApoE locus. J. Neurosci. 26, 4985–4994 (2006). source
- Could not verifycites [30] Srinivasan, R. et al. New transgenic mouse lines for selectively targeting astrocytes and studying calcium signals in astrocyte processes in situ and in vivo. Neuron 92, 1181–1195 (2016). sourceExperimental — accuracy not yet measured
The Results and Discussion describe an adult cortical astrocyte transcriptome, but do not state how much CNS ApoE astrocytes synthesize. Searches for ApoE and apolipoprotein E found no passage in our copy addressing that proportion. (LLM, conf=0.75)
plain- Asserted: passes — The authors put it forward as true.
- Checkable: passes — It can be checked against evidence.
- Load-bearing: passes — The paper’s conclusions depend on it.
- Based: passes — The paper gives a reason why it holds.
Every source the paper cites for this claim was checked and supports it.
In the paper
“Because Sullivan et al.20 reported HLP-III-like plasma lipids in E2-TR mice”
§ APOE4 to APOE2 allelic switching in mice improves Alzheimer’s disease-related metabolic signatures, neuropathology and cognition > Discussion
What the sources say
- Supportedcites Sullivan et al.20 Sullivan, P., Mezdour, H., Quarfordt, S. & Maeda, N. Type III hyperlipoproteinemia and spontaneous atherosclerosis in mice resulting from gene replacement of mouse Apoe with human Apoe*2. J. Clin. Invest. 102, 130–135 (1998). source
The Results identify the APOE*2 homozygous (2/2) mice as having elevated plasma lipids. The Discussion states that these mice show virtually all the characteristics of human type III hyperlipoproteinemia, including elevated cholesterol and triglycerides and characteristic lipoprotein patterns. Page numbers are not available in the supplied passages. (LLM, conf=0.94)
plaincorrelational- Asserted: passes — The authors put it forward as true.
- Checkable: passes — It can be checked against evidence.
- Load-bearing: passes — The paper’s conclusions depend on it.
- Based: passes — The paper gives a reason why it holds.
- Supported
The cited sources support only part of this claim — read each source’s verdict below.
In the paper
“several pathways altered by a short-term E4 to E2 transition were cellular pathways that are also perturbed across 17 large-scale human AD snRNA-seq studies24.”
§ APOE4 to APOE2 allelic switching in mice improves Alzheimer’s disease-related metabolic signatures, neuropathology and cognition > Discussion
What the sources say
- Partly supportedcites [24] Murdock, M. H. & Tsai, L.-H. Insights into Alzheimer’s disease from single-cell genomic approaches. Nat. Neurosci. 26, 181–195 (2023). sourceExperimental — accuracy not yet measured
The Introduction reports that several human AD snRNA-seq studies find altered cellular pathways, and describes shared disturbances in lipid handling, immune response, and metabolism. It does not establish that these pathways overlap with those altered by a short-term E4-to-E2 transition, or that the finding spans 17 large-scale studies. (LLM, conf=0.84)
plaincorrelational- Asserted: passes — The authors put it forward as true.
- Checkable: passes — It can be checked against evidence.
- Load-bearing: passes — The paper’s conclusions depend on it.
- Based: passes — The paper gives a reason why it holds.
- Partly supported
The cited sources support only part of this claim — read each source’s verdict below.
In the paper
“These findings may reflect human AD studies in which both E4 and E2 carriage were associated with higher CAA compared to E3/E3 individuals47,48”
§ APOE4 to APOE2 allelic switching in mice improves Alzheimer’s disease-related metabolic signatures, neuropathology and cognition > Discussion
What the sources say
- Could not verifycites [47] Boyle, P. A. et al. Cerebral amyloid angiopathy and cognitive outcomes in community-based older persons. Neurology 85, 1930–1936 (2015). sourceExperimental — accuracy not yet measured
The Burden of CAA section reports an association between CAA and AD pathology, but does not compare CAA burden by APOE genotype. Searches for APOE, apolipoprotein E, and the E2/E4 alleles found no passage addressing whether either allele is associated with higher CAA than E3/E3. (LLM, conf=0.76)
- Supportedcites [48] Nelson, P. T. et al. APOE-ε2 and APOE-ε4 correlate with increased amyloid accumulation in cerebral vasculature. J. Neuropathol. Exp. Neurol. 72, 708–715 (2013). source
The Results report higher CAA scores for both APOE-ε3/4 and APOE-ε2/3 brains than for APOE-ε3/3 brains. The Patients section describes a human autopsy cohort assembled for studies of normal aging and AD; the claim does not require that every individual had AD. (LLM, conf=0.91)
hedgedcorrelational- Asserted: passes — The authors put it forward as true.
- Checkable: passes — It can be checked against evidence.
- Load-bearing: passes — The paper’s conclusions depend on it.
- Based: passes — The paper gives a reason why it holds.
- Could not verify
The cited sources support only part of this claim — read each source’s verdict below.
In the paper
“Across multiple studies, glial cells show APOE4-associated transcriptomic changes in both human E4+ brains and E4-TR mice5.”
§ APOE4 to APOE2 allelic switching in mice improves Alzheimer’s disease-related metabolic signatures, neuropathology and cognition > Discussion
What the sources say
- Partly supportedcites [5] Martens, Y. A. et al. ApoE cascade hypothesis in the pathogenesis of Alzheimer’s disease and related dementias. Neuron 110, 1304–1317 (2022). sourceExperimental — accuracy not yet measured
In “ApoE and intracellular trafficking dysregulation” (page unavailable), the review reports transcriptomic differences between apoE4-TR and apoE3-TR mouse brains. Its References also list a study of APOE4-associated transcriptomic changes in primary mouse microglia. Our copy does not establish the corresponding claim about glial transcriptomic changes in human E4+ brains. (LLM, conf=0.78)
plaincorrelational- Asserted: passes — The authors put it forward as true.
- Checkable: passes — It can be checked against evidence.
- Load-bearing: unclear — It is unclear whether the paper’s conclusions depend on it.
- Based: passes — The paper gives a reason why it holds.
- Partly supported
The cited sources support only part of this claim — read each source’s verdict below.
In the paper
“Second, the 5xFAD model used in this study provided a model with well-characterized APOE-dependent changes in amyloid pathology55,63,64.”
§ APOE4 to APOE2 allelic switching in mice improves Alzheimer’s disease-related metabolic signatures, neuropathology and cognition > Discussion
What the sources say
- Supportedcites [55] Tai, L. M. et al. Levels of soluble apolipoprotein E/amyloid-β (Aβ) complex are reduced and oligomeric Aβ increased with APOE4 and Alzheimer disease in a transgenic mouse model and human samples. J. Biol. Chem. 288, 5914–5926 (2013). source
The Methods section describes EFAD mice as a cross between 5xFAD mice and apoE-targeted replacement mice. The paper reports APOE-dependent differences in amyloid-related measures in those 5xFAD-derived mice. The source therefore supports the model characterization, with the qualification that its APOE comparisons use EFAD mice rather than unmodified 5xFAD mice. (LLM, conf=0.85)
- Partly supportedcites [63] Tai, L. M. et al. EFAD transgenic mice as a human APOE relevant preclinical model of Alzheimer’s disease. J. Lipid Res. 58, 1733–1755 (2017). sourceExperimental — accuracy not yet measured
The 'Development of the EFAD mouse model' section says 5xFAD mice were bred with human APOE targeted-replacement mice to create EFAD lines. The 'APOE modulated AD symptoms exhibited in EFAD mice' section documents APOE-dependent amyloid changes in those EFAD lines, but distinguishes them from ordinary 5xFAD mice, which express mouse apoE. Thus the source supports the changes in a 5xFAD-derived model, not in unmodified 5xFAD mice. (LLM, conf=0.87)
- Supportedcites [64] Balu, D. et al. The role of APOE in transgenic mouse models of AD. Neurosci. Lett. 707, 134285 (2019). source
The EFAD mice section identifies EFAD as a 5xFAD-based model designed to study APOE-dependent AD pathology. The Aged male and female EFAD mice section reports that cortical amyloid-β deposition varied by APOE genotype, sex, and age. The evidence specifically concerns 5xFAD mice carrying human APOE variants. (LLM, conf=0.87)
boostedcorrelational- Asserted: passes — The authors put it forward as true.
- Checkable: passes — It can be checked against evidence.
- Load-bearing: unclear — It is unclear whether the paper’s conclusions depend on it.
- Based: passes — The paper gives a reason why it holds.
- Supported
The cited sources that could be checked couldn’t confirm or dispute this claim.
In the paper
“Aldh1l1 is also expressed in the liver65, as evidenced by the plasma lipid profile of APOE4s2A mice.”
§ APOE4 to APOE2 allelic switching in mice improves Alzheimer’s disease-related metabolic signatures, neuropathology and cognition > Discussion
What the sources say
- Could not verifycites [65] Nemeth, D., Luqman, N., Chen, L. & Quan, N. Aldh1l1-Cre/ER T2 is expressed in unintended cell types of the salivary gland, pancreas, and spleen. MicroPubl. Biol. https://doi.org/10.17912/micropub.biology.000832 (2023). sourceExperimental — accuracy not yet measured
The Description reports Aldh1l1 promoter activity in the salivary gland, lymph nodes, pancreas, and spleen, but does not address the liver. Searches for liver or hepatic expression and for the APOE4s2A plasma lipid profile found no supporting passage in our copy. The citation is attached specifically to the liver-expression claim. (LLM, conf=0.76)
plaincorrelational- Asserted: passes — The authors put it forward as true.
- Checkable: passes — It can be checked against evidence.
- Load-bearing: unclear — It is unclear whether the paper’s conclusions depend on it.
- Based: passes — The paper gives a reason why it holds.
- Could not verify
The cited sources support only part of this claim — read each source’s verdict below.
In the paper
“First, the degree of risk and protection afforded by E4 and E2 respectively vary according to ancestry1,59–62.”
§ APOE4 to APOE2 allelic switching in mice improves Alzheimer’s disease-related metabolic signatures, neuropathology and cognition > Discussion
What the sources say
- Supportedcites [1] Belloy, M. E. et al. APOE genotype and Alzheimer disease risk across age, sex, and population ancestry. JAMA Neurol. 80, 1284–1294 (2023). source
The Results (Race and Ethnicity Analyses; page not provided) report different Alzheimer disease risk estimates for APOE*4 and different protective associations for APOE*2 across groups. The Results (Global Population Ancestry Analyses; page not provided) also report an ancestry-related pattern for APOE*4, although ancestry did not explain every difference between groups. (LLM, conf=0.90)
- Partly supportedcites [59] Griswold, A. J. et al. Increased APOE ε4 expression is associated with the difference in Alzheimer’s disease risk from diverse ancestral backgrounds. Alzheimers Dement. 17, 1179–1188 (2021). sourceExperimental — accuracy not yet measured
The Introduction (page unavailable) states that Alzheimer’s disease risk associated with APOE ε4 varies by ancestral background, including a comparison of risk across three populations. It does not address whether the protection afforded by ε2 varies by ancestry; a search for ε2 found no relevant passage. (LLM, conf=0.88)
- Partly supportedcites [60] Huggins, L. K. L. et al. Meta-analysis of variations in association between APOE ɛ4 and Alzheimer’s disease and related dementias across Hispanic regions of origin. J. Alzheimers Dis. 93, 1095–1109 (2023). sourceExperimental — accuracy not yet measured
The Discussion (page unavailable) reports that the association between APOE ε4 and dementia risk varies across Hispanic groups and discusses genetic ancestry as a possible explanation. The Results (page unavailable) say the analysis focused on ε4 carriers; although ε2 genotypes are listed, the paper does not establish that ε2’s protective effect varies by ancestry. (LLM, conf=0.90)
- Partly supportedcites [61] & Choi, K. Y. APOE promoter polymorphism-219T/G is an effect modifier of the influence of APOE ε4 on Alzheimer's disease risk in a multiracial sample. J. Clin. Med. 8, 1236 (2019). sourceExperimental — accuracy not yet measured
Results §3.1 reports that the Alzheimer’s disease risk associated with ε4 differs across ethnic groups. But the Introduction explicitly says the protective effect of ε2 does not vary by ethnicity, contrary to that part of the claim. Page numbers are unavailable in our copy. (LLM, conf=0.90)
- Not checked — no full text of the sourcecites [62] Eisenberg, D. T., Kuzawa, C. W. & Hayes, M. G. Worldwide allele frequencies of the human apolipoprotein E gene: climate, local adaptations, and evolutionary history. Am. J. Phys. Anthropol. 143, 100–111 (2010). source
plaincorrelational- Asserted: passes — The authors put it forward as true.
- Checkable: passes — It can be checked against evidence.
- Load-bearing: unclear — It is unclear whether the paper’s conclusions depend on it.
- Based: passes — The paper gives a reason why it holds.
- Supported
A result the paper reports from its own data — it cites no other source for it, so there is none to check. The quote shows it is in the paper.
In the paper
“There was also substantial overlap (39–60% depending on the cell type) between the specific DEGs associated with a global versus astrocyte-specific E4 to E2 switch (Fig. 4g).”
§ APOE4 to APOE2 allelic switching in mice improves Alzheimer’s disease-related metabolic signatures, neuropathology and cognition > Astrocyte-only switch to E2 drives similar gene expression
plaincorrelational- Asserted: passes — The authors put it forward as true.
- Checkable: passes — It can be checked against evidence.
- Load-bearing: passes — The paper’s conclusions depend on it.
- Based: passes — The paper gives a reason why it holds.
A result the paper reports from its own data — it cites no other source for it, so there is none to check. The quote shows it is in the paper.
In the paper
“A whole-body allelic switch results in a metabolic profile resembling E2/E2 humans and drives AD-relevant alterations in the lipidome and single-cell transcriptome, particularly in astrocytes.”
§ APOE4 to APOE2 allelic switching in mice improves Alzheimer’s disease-related metabolic signatures, neuropathology and cognition > Abstract
plaindirect- Asserted: passes — The authors put it forward as true.
- Checkable: passes — It can be checked against evidence.
- Load-bearing: passes — The paper’s conclusions depend on it.
- Based: passes — The paper gives a reason why it holds.
A result the paper reports from its own data — it cites no other source for it, so there is none to check. The quote shows it is in the paper.
In the paper
“Interestingly, there were nuanced changes within these lipid classes; in both PC and CER classes, some lipid species increased in abundance while others decreased.”
§ APOE4 to APOE2 allelic switching in mice improves Alzheimer’s disease-related metabolic signatures, neuropathology and cognition > Whole-body switch results in an ‘E2-like’ metabolic profile
plain- Asserted: passes — The authors put it forward as true.
- Checkable: passes — It can be checked against evidence.
- Load-bearing: unclear — It is unclear whether the paper’s conclusions depend on it.
- Based: passes — The paper gives a reason why it holds.
A result the paper reports from its own data — it cites no other source for it, so there is none to check. The quote shows it is in the paper.
In the paper
“Across all cell types, pathway analyses of astrocyte switch DEGs revealed similar terms to those seen in whole-body APOE4s2G mice, particularly in pathways related to neurotransmission, redox status and metabolite transport (Fig. 4h–k).”
§ APOE4 to APOE2 allelic switching in mice improves Alzheimer’s disease-related metabolic signatures, neuropathology and cognition > Astrocyte-only switch to E2 drives similar gene expression
plaincorrelational- Asserted: passes — The authors put it forward as true.
- Checkable: passes — It can be checked against evidence.
- Load-bearing: passes — The paper’s conclusions depend on it.
- Based: passes — The paper gives a reason why it holds.
A result the paper reports from its own data — it cites no other source for it, so there is none to check. The quote shows it is in the paper.
In the paper
“A whole-body allelic switch results in a metabolic profile resembling E2/E2 humans and drives AD-relevant alterations in the lipidome and single-cell transcriptome, particularly in astrocytes.”
- Also stated in: § Main · plain
“The metabolic profile of post-switch APOE4s2 mice resembled that of humanized APOE2 ‘targeted replacement’ (TR) mice and E2/E2 humans, with elevated ApoE concentrations and increased plasma lipids.”
§ APOE4 to APOE2 allelic switching in mice improves Alzheimer’s disease-related metabolic signatures, neuropathology and cognition > Abstract
plaindirect- Asserted: passes — The authors put it forward as true.
- Checkable: passes — It can be checked against evidence.
- Load-bearing: passes — The paper’s conclusions depend on it.
- Based: passes — The paper gives a reason why it holds.
- Also stated in: § Main · plain
A result the paper reports from its own data — it cites no other source for it, so there is none to check. The quote shows it is in the paper.
In the paper
“Analysis of DEGs showed that the astrocyte-specific APOE4 to APOE2 transition primarily affected similar cell types as observed in the global model (Fig. 4e and Extended Data Fig. 5).”
§ APOE4 to APOE2 allelic switching in mice improves Alzheimer’s disease-related metabolic signatures, neuropathology and cognition > Astrocyte-only switch to E2 drives similar gene expression
plaincorrelational- Asserted: passes — The authors put it forward as true.
- Checkable: passes — It can be checked against evidence.
- Load-bearing: passes — The paper’s conclusions depend on it.
- Based: passes — The paper gives a reason why it holds.
A result the paper reports from its own data — it cites no other source for it, so there is none to check. The quote shows it is in the paper.
In the paper
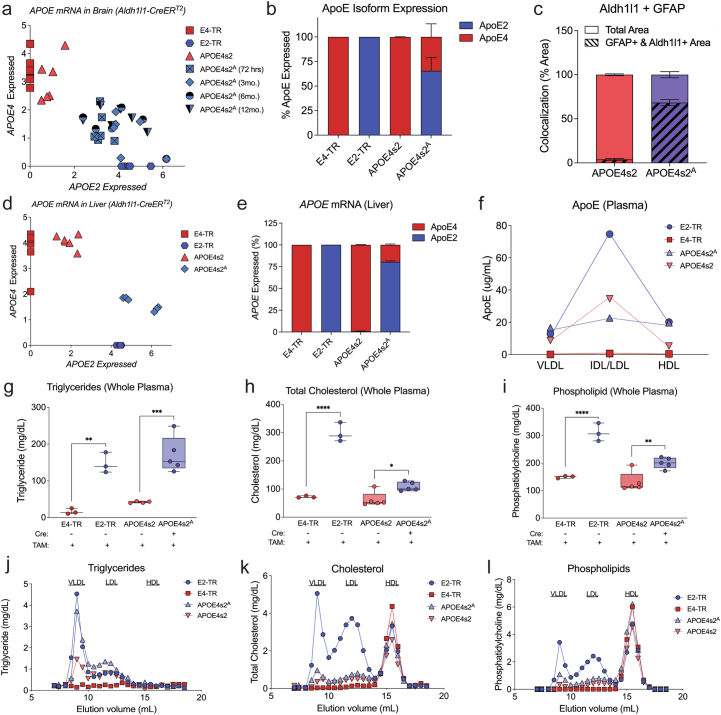
“While the Aldh1l1-CreERT2 showed high specificity for astrocytes in the brain; plasma lipid profiling and peripheral ApoE measures indicated that there is also notable E2 expression in the periphery (Extended Data Fig. 5d,e).”
§ APOE4 to APOE2 allelic switching in mice improves Alzheimer’s disease-related metabolic signatures, neuropathology and cognition > Astrocyte-only switch to E2 drives similar gene expression
hedged- Asserted: passes — The authors put it forward as true.
- Checkable: passes — It can be checked against evidence.
- Load-bearing: unclear — It is unclear whether the paper’s conclusions depend on it.
- Based: passes — The paper gives a reason why it holds.
A result the paper reports from its own data — it cites no other source for it, so there is none to check. The quote shows it is in the paper.
In the paper
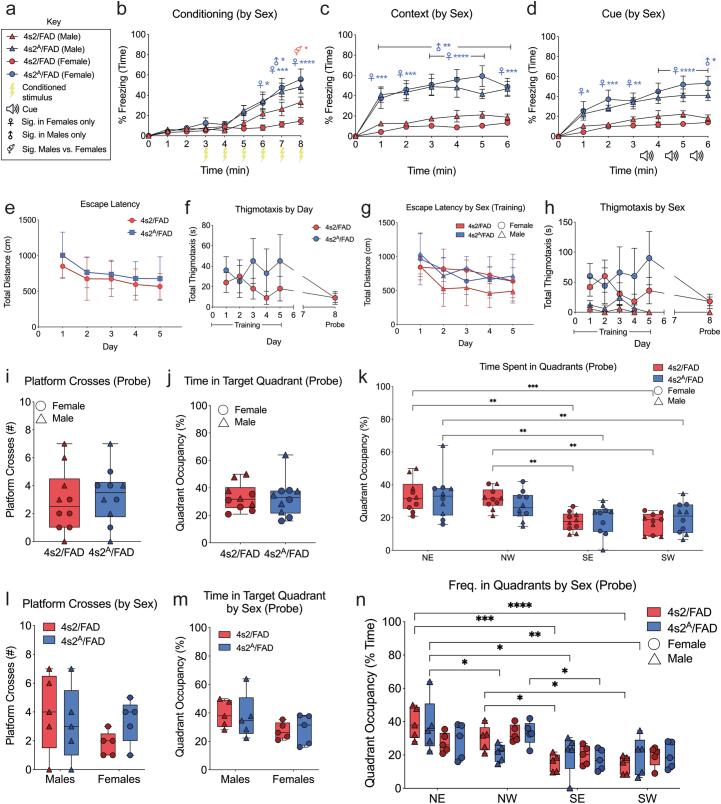
“While the Morris water maze did not show striking differences in spatial learning or memory, 4s2A/FAD mice showed improvements in associative learning and more robust contextual and cued memory, an effect that was strongest in females (Fig. 5b–d and Extended Data Fig. 6a–d).”
§ APOE4 to APOE2 allelic switching in mice improves Alzheimer’s disease-related metabolic signatures, neuropathology and cognition > Astrocyte-only E4 to E2 switch decreases amyloid plaque load
plaindirect- Asserted: passes — The authors put it forward as true.
- Checkable: passes — It can be checked against evidence.
- Load-bearing: unclear — It is unclear whether the paper’s conclusions depend on it.
- Based: passes — The paper gives a reason why it holds.
A result the paper reports from its own data — it cites no other source for it, so there is none to check. The quote shows it is in the paper.
In the paper
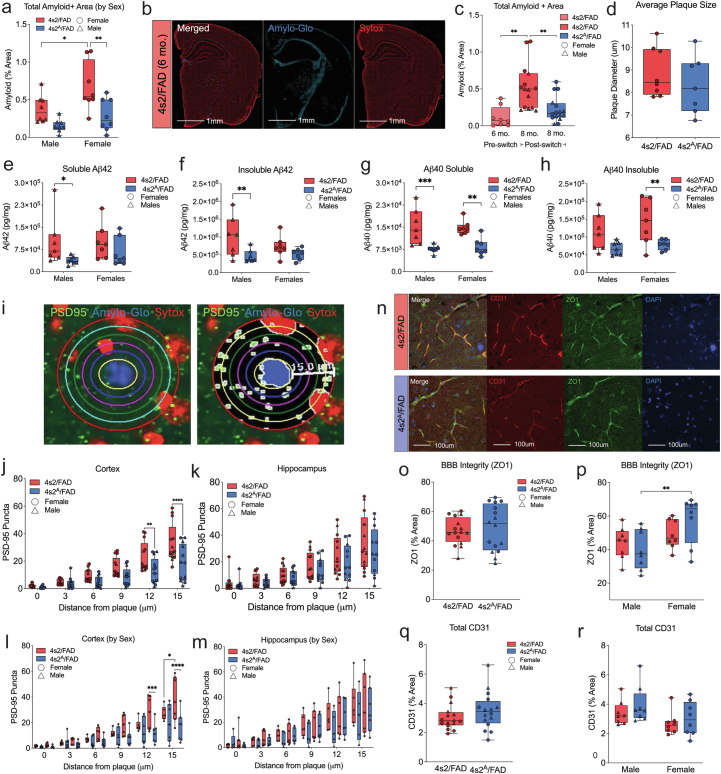
“When compared to ‘baseline’ amyloid measures at 6 months of age, the reduced burden in 4s2A/FAD mice was due to slowed or delayed amyloid accumulation (Fig. 5f and Extended Data Fig. 7).”
§ APOE4 to APOE2 allelic switching in mice improves Alzheimer’s disease-related metabolic signatures, neuropathology and cognition > Astrocyte-only E4 to E2 switch decreases amyloid plaque load
plaindirect- Asserted: passes — The authors put it forward as true.
- Checkable: passes — It can be checked against evidence.
- Load-bearing: passes — The paper’s conclusions depend on it.
- Based: passes — The paper gives a reason why it holds.
A result the paper reports from its own data — it cites no other source for it, so there is none to check. The quote shows it is in the paper.
In the paper
“Finally, when crossed to the 5xFAD background, astrocyte-specific E4 to E2 switching improves cognition, decreases amyloid pathology, lowers gliosis and reduces plaque-associated apolipoprotein E.”
- Also stated in: § Astrocyte-only E4 to E2 switch decreases amyloid plaque load · plain
“4s2A/FAD mice showed improvements in associative learning and more robust contextual and cued memory, an effect that was strongest in females (Fig. 5b–d and Extended Data Fig. 6a–d).”
§ APOE4 to APOE2 allelic switching in mice improves Alzheimer’s disease-related metabolic signatures, neuropathology and cognition > Abstract
plaindirect- Asserted: passes — The authors put it forward as true.
- Checkable: passes — It can be checked against evidence.
- Load-bearing: passes — The paper’s conclusions depend on it.
- Based: passes — The paper gives a reason why it holds.
- Also stated in: § Astrocyte-only E4 to E2 switch decreases amyloid plaque load · plain
A result the paper reports from its own data — it cites no other source for it, so there is none to check. The quote shows it is in the paper.
In the paper
“While the Morris water maze did not show striking differences in spatial learning or memory, 4s2A/FAD mice showed improvements in associative learning and more robust contextual and cued memory, an effect that was strongest in females (Fig. 5b–d and Extended Data Fig. 6a–d).”
§ APOE4 to APOE2 allelic switching in mice improves Alzheimer’s disease-related metabolic signatures, neuropathology and cognition > Astrocyte-only E4 to E2 switch decreases amyloid plaque load
plain- Asserted: passes — The authors put it forward as true.
- Checkable: passes — It can be checked against evidence.
- Load-bearing: unclear — It is unclear whether the paper’s conclusions depend on it.
- Based: passes — The paper gives a reason why it holds.
A result the paper reports from its own data — it cites no other source for it, so there is none to check. The quote shows it is in the paper.
In the paper
“Before TAM, total plasma triglyceride (TG) levels in APOE4s2 and APOE4s2G mice were indistinguishable from the E4-TR controls (Fig. 2a).”
§ APOE4 to APOE2 allelic switching in mice improves Alzheimer’s disease-related metabolic signatures, neuropathology and cognition > Whole-body switch results in an ‘E2-like’ metabolic profile
plain- Asserted: passes — The authors put it forward as true.
- Checkable: passes — It can be checked against evidence.
- Load-bearing: passes — The paper’s conclusions depend on it.
- Based: passes — The paper gives a reason why it holds.
A result the paper reports from its own data — it cites no other source for it, so there is none to check. The quote shows it is in the paper.
In the paper
“Finally, when crossed to the 5xFAD background, astrocyte-specific E4 to E2 switching improves cognition, decreases amyloid pathology, lowers gliosis and reduces plaque-associated apolipoprotein E.”
§ APOE4 to APOE2 allelic switching in mice improves Alzheimer’s disease-related metabolic signatures, neuropathology and cognition > Abstract
plaindirect- Asserted: passes — The authors put it forward as true.
- Checkable: passes — It can be checked against evidence.
- Load-bearing: passes — The paper’s conclusions depend on it.
- Based: passes — The paper gives a reason why it holds.
A result the paper reports from its own data — it cites no other source for it, so there is none to check. The quote shows it is in the paper.
In the paper
“Additionally, as seen in the whole-body model, the DEGs associated with an astrocyte-specific E4 to E2 switch also strongly mirrored the LOAD gene lists (Fig. 4f).”
§ APOE4 to APOE2 allelic switching in mice improves Alzheimer’s disease-related metabolic signatures, neuropathology and cognition > Astrocyte-only switch to E2 drives similar gene expression
boostedcorrelational- Asserted: passes — The authors put it forward as true.
- Checkable: passes — It can be checked against evidence.
- Load-bearing: passes — The paper’s conclusions depend on it.
- Based: passes — The paper gives a reason why it holds.
- Rests on an assumption: Overlap of mouse DEGs with human AD gene lists indicates AD relevance.
A result the paper reports from its own data — it cites no other source for it, so there is none to check. The quote shows it is in the paper.
In the paper
“Finally, when crossed to the 5xFAD background, astrocyte-specific E4 to E2 switching improves cognition, decreases amyloid pathology, lowers gliosis and reduces plaque-associated apolipoprotein E.”
- Also stated in: § Astrocyte-only E4 to E2 switch decreases amyloid plaque load · boosted
“Strikingly, after a 2-month astrocyte-specific allelic switch, 4s2A/FAD animals showed significant reductions in total amyloid levels (Fig. 5e,f and Extended Data Fig. 6e–h).”
§ APOE4 to APOE2 allelic switching in mice improves Alzheimer’s disease-related metabolic signatures, neuropathology and cognition > Abstract
boosteddirect- Asserted: passes — The authors put it forward as true.
- Checkable: passes — It can be checked against evidence.
- Load-bearing: passes — The paper’s conclusions depend on it.
- Based: passes — The paper gives a reason why it holds.
- Rests on an assumption: The 5xFAD mouse model recapitulates key aspects of human AD pathology relevant to APOE.
- Also stated in: § Astrocyte-only E4 to E2 switch decreases amyloid plaque load · boosted
A result the paper reports from its own data — it cites no other source for it, so there is none to check. The quote shows it is in the paper.
In the paper
“To generate a preclinical model in which we could investigate the feasibility and therapeutic potential of a full APOE4 to APOE2 transition in vivo, we developed a knock-in model coined the APOE ‘switch’ mouse (APOE4s2).”
§ APOE4 to APOE2 allelic switching in mice improves Alzheimer’s disease-related metabolic signatures, neuropathology and cognition > Main
plain- Asserted: passes — The authors put it forward as true.
- Checkable: passes — It can be checked against evidence.
- Load-bearing: passes — The paper’s conclusions depend on it.
- Based: passes — The paper gives a reason why it holds.
A result the paper reports from its own data — it cites no other source for it, so there is none to check. The quote shows it is in the paper.
In the paper
“Brain ApoE levels were also elevated in APOE4s2G mice 1 month after switching (Fig. 2f).”
§ APOE4 to APOE2 allelic switching in mice improves Alzheimer’s disease-related metabolic signatures, neuropathology and cognition > Whole-body switch results in an ‘E2-like’ metabolic profile
plaindirect- Asserted: passes — The authors put it forward as true.
- Checkable: passes — It can be checked against evidence.
- Load-bearing: unclear — It is unclear whether the paper’s conclusions depend on it.
- Based: passes — The paper gives a reason why it holds.
A result the paper reports from its own data — it cites no other source for it, so there is none to check. The quote shows it is in the paper.
In the paper
“A comparison of APOE4s2G mice versus Cre− APOE4s2 controls identified 14 lipid species that were significantly different in abundance between the two groups (Fig. 2i,j).”
§ APOE4 to APOE2 allelic switching in mice improves Alzheimer’s disease-related metabolic signatures, neuropathology and cognition > Whole-body switch results in an ‘E2-like’ metabolic profile
plaincorrelational- Asserted: passes — The authors put it forward as true.
- Checkable: passes — It can be checked against evidence.
- Load-bearing: passes — The paper’s conclusions depend on it.
- Based: passes — The paper gives a reason why it holds.
A result the paper reports from its own data — it cites no other source for it, so there is none to check. The quote shows it is in the paper.
In the paper
“Finally, when crossed to the 5xFAD background, astrocyte-specific E4 to E2 switching improves cognition, decreases amyloid pathology, lowers gliosis and reduces plaque-associated apolipoprotein E.”
§ APOE4 to APOE2 allelic switching in mice improves Alzheimer’s disease-related metabolic signatures, neuropathology and cognition > Abstract
plaindirect- Asserted: passes — The authors put it forward as true.
- Checkable: passes — It can be checked against evidence.
- Load-bearing: passes — The paper’s conclusions depend on it.
- Based: passes — The paper gives a reason why it holds.
A result the paper reports from its own data — it cites no other source for it, so there is none to check. The quote shows it is in the paper.
In the paper
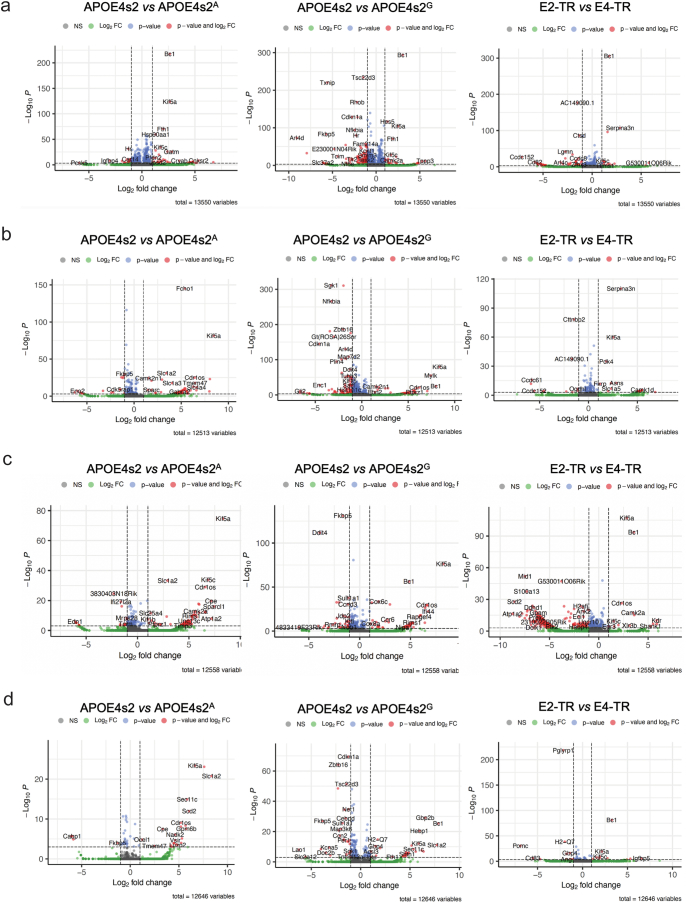
“Analysis of differentially expressed genes (DEGs) revealed astrocytes, oligodendrocytes, microglia and endothelial cells as the cell types most affected by a 1-month-long APOE4 to APOE2 switch (Fig. 3b, Extended Data Fig. 4 and Supplementary Table 1).”
§ APOE4 to APOE2 allelic switching in mice improves Alzheimer’s disease-related metabolic signatures, neuropathology and cognition > Full-body switching drives AD-relevant transcriptomic changes
plaindirect- Asserted: passes — The authors put it forward as true.
- Checkable: passes — It can be checked against evidence.
- Load-bearing: unclear — It is unclear whether the paper’s conclusions depend on it.
- Based: passes — The paper gives a reason why it holds.
A result the paper reports from its own data — it cites no other source for it, so there is none to check. The quote shows it is in the paper.
In the paper
“Strikingly, after a 2-month astrocyte-specific allelic switch, 4s2A/FAD animals showed significant reductions in total amyloid levels (Fig. 5e,f and Extended Data Fig. 6e–h).”
§ APOE4 to APOE2 allelic switching in mice improves Alzheimer’s disease-related metabolic signatures, neuropathology and cognition > Astrocyte-only E4 to E2 switch decreases amyloid plaque load
boosteddirect- Asserted: passes — The authors put it forward as true.
- Checkable: passes — It can be checked against evidence.
- Load-bearing: passes — The paper’s conclusions depend on it.
- Based: passes — The paper gives a reason why it holds.
- Rests on an assumption: The 5xFAD mouse model recapitulates key aspects of human AD pathology relevant to APOE.
A result the paper reports from its own data — it cites no other source for it, so there is none to check. The quote shows it is in the paper.
In the paper
“Anatomical analyses revealed decreases in many regions, with significant reductions in the hippocampus, olfactory area and thalamus primarily driving the decrease in plaque load (Fig. 5g,h).”
§ APOE4 to APOE2 allelic switching in mice improves Alzheimer’s disease-related metabolic signatures, neuropathology and cognition > Astrocyte-only E4 to E2 switch decreases amyloid plaque load
plaindirect- Asserted: passes — The authors put it forward as true.
- Checkable: passes — It can be checked against evidence.
- Load-bearing: unclear — It is unclear whether the paper’s conclusions depend on it.
- Based: passes — The paper gives a reason why it holds.
A result the paper reports from its own data — it cites no other source for it, so there is none to check. The quote shows it is in the paper.
In the paper
“Across these cell types, there was notable overlap of DEGs from APOE4s2G mice versus APOE4s2 controls with DEGs from E2-TR versus E4-TR mice (Fig. 3c), suggesting that many genes that distinguish ‘lifetime’ expression of E4 are acutely malleable.”
§ APOE4 to APOE2 allelic switching in mice improves Alzheimer’s disease-related metabolic signatures, neuropathology and cognition > Full-body switching drives AD-relevant transcriptomic changes
hedgedcorrelational- Asserted: passes — The authors put it forward as true.
- Checkable: passes — It can be checked against evidence.
- Load-bearing: passes — The paper’s conclusions depend on it.
- Based: passes — The paper gives a reason why it holds.
A result the paper reports from its own data — it cites no other source for it, so there is none to check. The quote shows it is in the paper.
In the paper
“APOE4s2G mice fed a normal chow diet also showed elevations in TGs, cholesterol and phospholipids relative to the APOE4s2 controls, although the increases were more modest (Extended Data Fig. 2e–j).”
§ APOE4 to APOE2 allelic switching in mice improves Alzheimer’s disease-related metabolic signatures, neuropathology and cognition > Whole-body switch results in an ‘E2-like’ metabolic profile
plaincorrelational- Asserted: passes — The authors put it forward as true.
- Checkable: passes — It can be checked against evidence.
- Load-bearing: unclear — It is unclear whether the paper’s conclusions depend on it.
- Based: passes — The paper gives a reason why it holds.
A result the paper reports from its own data — it cites no other source for it, so there is none to check. The quote shows it is in the paper.
In the paper
“Interestingly, several cell types that continued expressing E4 in APOE4s2A mice (that is, microglia, oligodendrocytes) still showed a high number of DEGs, suggesting non-cell-autonomous effects of astrocyte-derived E2.”
§ APOE4 to APOE2 allelic switching in mice improves Alzheimer’s disease-related metabolic signatures, neuropathology and cognition > Astrocyte-only switch to E2 drives similar gene expression
hedgedconditional- Asserted: passes — The authors put it forward as true.
- Checkable: passes — It can be checked against evidence.
- Load-bearing: passes — The paper’s conclusions depend on it.
- Based: passes — The paper gives a reason why it holds.
A result the paper reports from its own data — it cites no other source for it, so there is none to check. The quote shows it is in the paper.
In the paper
“For reference, a comparison of E2-TR and E4-TR control mice identified 57 lipids of differing abundance, again most of which were glycerophospholipids (Extended Data Fig. 2o,p).”
§ APOE4 to APOE2 allelic switching in mice improves Alzheimer’s disease-related metabolic signatures, neuropathology and cognition > Whole-body switch results in an ‘E2-like’ metabolic profile
plaincorrelational- Asserted: passes — The authors put it forward as true.
- Checkable: passes — It can be checked against evidence.
- Load-bearing: unclear — It is unclear whether the paper’s conclusions depend on it.
- Based: passes — The paper gives a reason why it holds.
A result the paper reports from its own data — it cites no other source for it, so there is none to check. The quote shows it is in the paper.
In the paper
“Gene Ontology (GO) analysis of switch-related DEGs highlighted a number of pathways related to metabolism, including substrate transport, redox management and cellular respiration (Fig. 3d–g and Supplementary Table 2).”
§ APOE4 to APOE2 allelic switching in mice improves Alzheimer’s disease-related metabolic signatures, neuropathology and cognition > Full-body switching drives AD-relevant transcriptomic changes
plaincorrelational- Asserted: passes — The authors put it forward as true.
- Checkable: passes — It can be checked against evidence.
- Load-bearing: passes — The paper’s conclusions depend on it.
- Based: passes — The paper gives a reason why it holds.
A result the paper reports from its own data — it cites no other source for it, so there is none to check. The quote shows it is in the paper.
In the paper
“A whole-body allelic switch results in a metabolic profile resembling E2/E2 humans and drives AD-relevant alterations in the lipidome and single-cell transcriptome, particularly in astrocytes.”
§ APOE4 to APOE2 allelic switching in mice improves Alzheimer’s disease-related metabolic signatures, neuropathology and cognition > Abstract
plaindirect- Asserted: passes — The authors put it forward as true.
- Checkable: passes — It can be checked against evidence.
- Load-bearing: passes — The paper’s conclusions depend on it.
- Based: passes — The paper gives a reason why it holds.
A result the paper reports from its own data — it cites no other source for it, so there is none to check. The quote shows it is in the paper.
In the paper
“Together, these data demonstrate that even a short-term transition from E4 to E2 in the adult mouse is sufficient to drive alterations in ApoE concentrations and lipid metabolism, most notably increases in multiple PC species within the brain.”
§ APOE4 to APOE2 allelic switching in mice improves Alzheimer’s disease-related metabolic signatures, neuropathology and cognition > Whole-body switch results in an ‘E2-like’ metabolic profile
boosteddirect- Asserted: passes — The authors put it forward as true.
- Checkable: passes — It can be checked against evidence.
- Load-bearing: passes — The paper’s conclusions depend on it.
- Based: passes — The paper gives a reason why it holds.
A result the paper reports from its own data — it cites no other source for it, so there is none to check. The quote shows it is in the paper.
In the paper
“Enzyme-linked immunosorbent assay (ELISA) quantification of Aβ42 and Aβ40 in whole-brain soluble and insoluble fractions revealed reductions in both soluble and insoluble Aβ42 and Aβ40 observed in 4s2A/FAD brains (Fig. 5i–l and Extended Data Fig. 7).”
§ APOE4 to APOE2 allelic switching in mice improves Alzheimer’s disease-related metabolic signatures, neuropathology and cognition > Astrocyte-only E4 to E2 switch decreases amyloid plaque load
plaindirect- Asserted: passes — The authors put it forward as true.
- Checkable: passes — It can be checked against evidence.
- Load-bearing: passes — The paper’s conclusions depend on it.
- Based: passes — The paper gives a reason why it holds.
The paper states this without a source or data behind it here, so there is nothing to check it against. The quote shows it is in the paper.
In the paper
“we describe a new APOE ‘switch’ model (APOE4s2) that allows for inducible, cell-specific, in vivo replacement of the high-risk APOE4 allele with the protective APOE2 variant.”
§ APOE4 to APOE2 allelic switching in mice improves Alzheimer’s disease-related metabolic signatures, neuropathology and cognition > Discussion
plaindirect- Asserted: passes — The authors put it forward as true.
- Checkable: passes — It can be checked against evidence.
- Load-bearing: passes — The paper’s conclusions depend on it.
- Based: passes — The paper gives a reason why it holds.
- Rests on an assumption: APOE4 is a high-risk allele and APOE2 is protective for Alzheimer's disease.
A result the paper reports from its own data — it cites no other source for it, so there is none to check. The quote shows it is in the paper.
In the paper
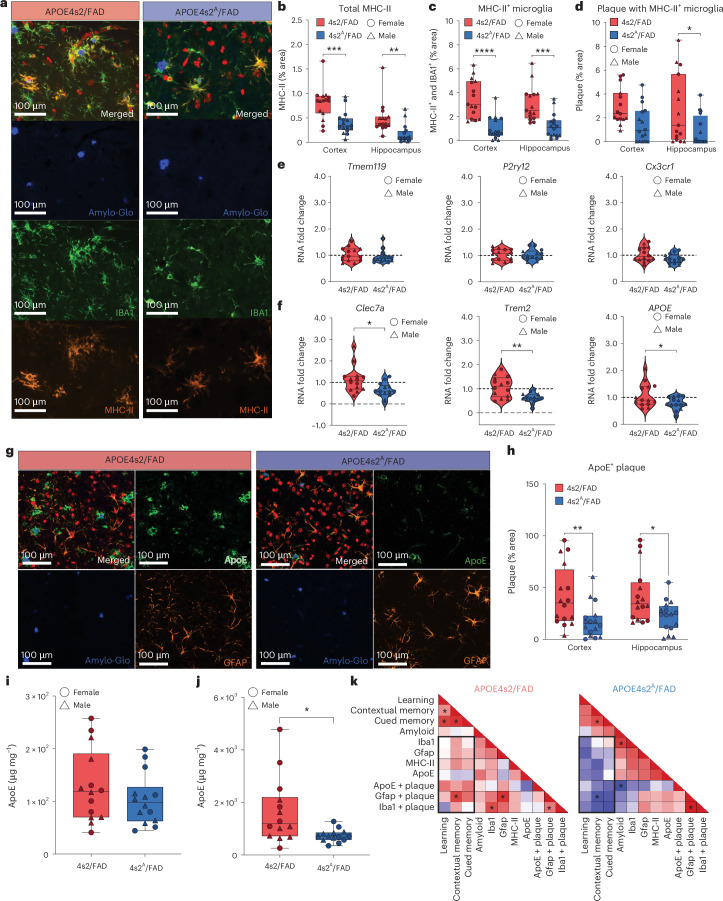
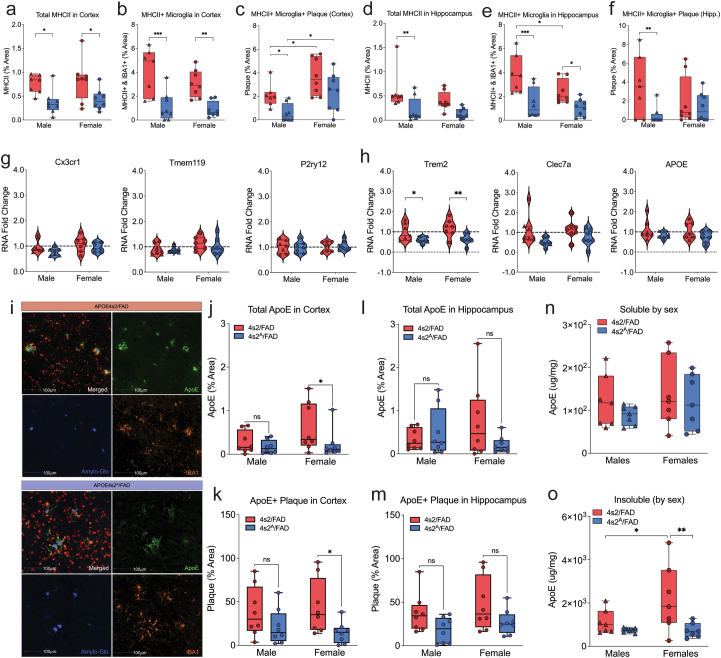
“ELISA quantification of ApoE supported these findings, with significant reductions of ApoE within the insoluble (plaque-associated) brain fractions from 4s2A/FAD mice, but no differences in soluble ApoE (Fig. 7i,j and Extended Data Fig. 9n,o).”
§ APOE4 to APOE2 allelic switching in mice improves Alzheimer’s disease-related metabolic signatures, neuropathology and cognition > E4 to E2 switch reduces reactive microglia and plaque ApoE
plain- Asserted: passes — The authors put it forward as true.
- Checkable: passes — It can be checked against evidence.
- Load-bearing: passes — The paper’s conclusions depend on it.
- Based: passes — The paper gives a reason why it holds.
- Rests on an assumption: The insoluble brain fraction corresponds to plaque-associated ApoE.
A result the paper reports from its own data — it cites no other source for it, so there is none to check. The quote shows it is in the paper.
In the paper
“Strikingly, we show that a 2-month-long astrocyte-specific E4 to E2 switch after pathology onset is sufficient to decrease plaque load, reduce markers of glial reactivity and improve associative, but not spatial, memory in the 5xFAD model.”
§ APOE4 to APOE2 allelic switching in mice improves Alzheimer’s disease-related metabolic signatures, neuropathology and cognition > Discussion
boosteddirect- Asserted: passes — The authors put it forward as true.
- Checkable: passes — It can be checked against evidence.
- Load-bearing: passes — The paper’s conclusions depend on it.
- Based: passes — The paper gives a reason why it holds.
- Rests on an assumption: The 5xFAD model is an amyloidosis model of Alzheimer's disease.
A result the paper reports from its own data — it cites no other source for it, so there is none to check. The quote shows it is in the paper.
In the paper
“While higher amyloid plaque loads were observed in female compared to male 4s2/FAD Cre− controls, we did not detect any other amyloid-dependent sex differences, nor was this difference reflected in the soluble and insoluble Aβ42 and Aβ40 measures (Extended Data Fig. 7e–h).”
§ APOE4 to APOE2 allelic switching in mice improves Alzheimer’s disease-related metabolic signatures, neuropathology and cognition > Astrocyte-only E4 to E2 switch decreases amyloid plaque load
plaincorrelational- Asserted: passes — The authors put it forward as true.
- Checkable: passes — It can be checked against evidence.
- Load-bearing: unclear — It is unclear whether the paper’s conclusions depend on it.
- Based: passes — The paper gives a reason why it holds.
A result the paper reports from its own data — it cites no other source for it, so there is none to check. The quote shows it is in the paper.
In the paper
“However, these intense bursts of plaque-associated ApoE signal were largely absent in 4s2A/FAD mice”
§ APOE4 to APOE2 allelic switching in mice improves Alzheimer’s disease-related metabolic signatures, neuropathology and cognition > E4 to E2 switch reduces reactive microglia and plaque ApoE
plain- Asserted: passes — The authors put it forward as true.
- Checkable: passes — It can be checked against evidence.
- Load-bearing: passes — The paper’s conclusions depend on it.
- Based: passes — The paper gives a reason why it holds.
A result the paper reports from its own data — it cites no other source for it, so there is none to check. The quote shows it is in the paper.
In the paper
“In this study, we observed that expression of astrocytic E2 slowed amyloid deposition during the 2-month period after the allelic switch in 4s2A/FAD mice.”
§ APOE4 to APOE2 allelic switching in mice improves Alzheimer’s disease-related metabolic signatures, neuropathology and cognition > Discussion
plaindirect- Asserted: passes — The authors put it forward as true.
- Checkable: passes — It can be checked against evidence.
- Load-bearing: passes — The paper’s conclusions depend on it.
- Based: passes — The paper gives a reason why it holds.
A result the paper reports from its own data — it cites no other source for it, so there is none to check. The quote shows it is in the paper.
In the paper
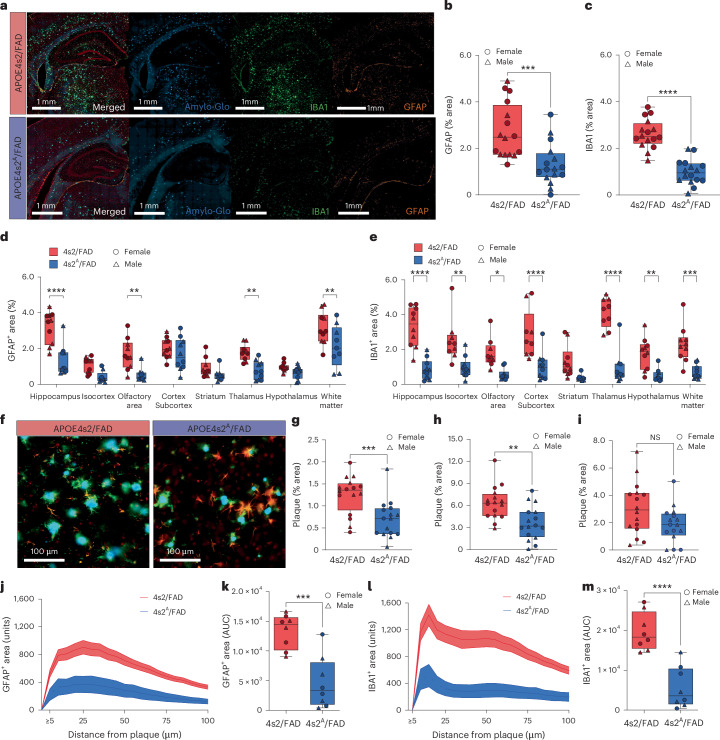
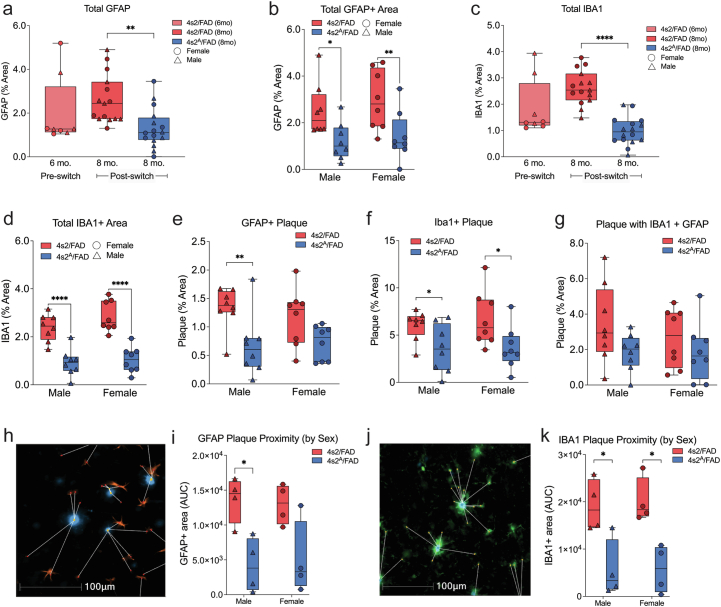
“4s2A/FAD mice showed decreased colocalization of amyloid with GFAP+ and IBA1+ puncta (Fig. 6f–i and Extended Data Fig. 8d–g)”
§ APOE4 to APOE2 allelic switching in mice improves Alzheimer’s disease-related metabolic signatures, neuropathology and cognition > Astrocyte E4 to E2 replacement lowers plaque-associated gliosis
plaincorrelational- Asserted: passes — The authors put it forward as true.
- Checkable: passes — It can be checked against evidence.
- Load-bearing: passes — The paper’s conclusions depend on it.
- Based: passes — The paper gives a reason why it holds.
A result the paper reports from its own data — it cites no other source for it, so there is none to check. The quote shows it is in the paper.
In the paper
“Although there was no change in homeostatic gene expression, decreased expression of several disease-associated microglia (DAM) genes, including Trem2, Clec7a and APOE, was also noted after the astrocyte-specific transition to E2 (Fig. 7e,f and Extended Data Fig. 9g,h).”
§ APOE4 to APOE2 allelic switching in mice improves Alzheimer’s disease-related metabolic signatures, neuropathology and cognition > E4 to E2 switch reduces reactive microglia and plaque ApoE
plain- Asserted: passes — The authors put it forward as true.
- Checkable: passes — It can be checked against evidence.
- Load-bearing: unclear — It is unclear whether the paper’s conclusions depend on it.
- Based: passes — The paper gives a reason why it holds.
A result the paper reports from its own data — it cites no other source for it, so there is none to check. The quote shows it is in the paper.
In the paper
“Reductions in total GFAP and IBA1 levels were especially pronounced in close proximity to amyloid plaques.”
§ APOE4 to APOE2 allelic switching in mice improves Alzheimer’s disease-related metabolic signatures, neuropathology and cognition > Astrocyte E4 to E2 replacement lowers plaque-associated gliosis
plaincorrelational- Asserted: passes — The authors put it forward as true.
- Checkable: passes — It can be checked against evidence.
- Load-bearing: passes — The paper’s conclusions depend on it.
- Based: passes — The paper gives a reason why it holds.
A result the paper reports from its own data — it cites no other source for it, so there is none to check. The quote shows it is in the paper.
In the paper
“we also observed significantly lower levels of GFAP in 4s2A/FAD mice compared to controls (Fig. 6a,b).”
§ APOE4 to APOE2 allelic switching in mice improves Alzheimer’s disease-related metabolic signatures, neuropathology and cognition > Astrocyte E4 to E2 replacement lowers plaque-associated gliosis
plaincorrelational- Asserted: passes — The authors put it forward as true.
- Checkable: passes — It can be checked against evidence.
- Load-bearing: passes — The paper’s conclusions depend on it.
- Based: passes — The paper gives a reason why it holds.
A result the paper reports from its own data — it cites no other source for it, so there is none to check. The quote shows it is in the paper.
In the paper
“Finally, we measured the expression of the tight junction protein ZO1 and found no change after the switch to astrocyte-derived E2 (Extended Data Fig. 7n–r).”
§ APOE4 to APOE2 allelic switching in mice improves Alzheimer’s disease-related metabolic signatures, neuropathology and cognition > Astrocyte-only E4 to E2 switch decreases amyloid plaque load
plain- Asserted: passes — The authors put it forward as true.
- Checkable: passes — It can be checked against evidence.
- Load-bearing: unclear — It is unclear whether the paper’s conclusions depend on it.
- Based: passes — The paper gives a reason why it holds.
A result the paper reports from its own data — it cites no other source for it, so there is none to check. The quote shows it is in the paper.
In the paper
“we noted a dramatic reduction in microglial IBA1 positivity (Fig. 6c)”
§ APOE4 to APOE2 allelic switching in mice improves Alzheimer’s disease-related metabolic signatures, neuropathology and cognition > Astrocyte E4 to E2 replacement lowers plaque-associated gliosis
plaindirect- Asserted: passes — The authors put it forward as true.
- Checkable: passes — It can be checked against evidence.
- Load-bearing: passes — The paper’s conclusions depend on it.
- Based: passes — The paper gives a reason why it holds.
A result the paper reports from its own data — it cites no other source for it, so there is none to check. The quote shows it is in the paper.
In the paper
“While there was no difference in total ApoE protein levels between the 4s2A/FAD and 4s2/FAD mice, we observed a striking difference in plaque-associated ApoE.”
§ APOE4 to APOE2 allelic switching in mice improves Alzheimer’s disease-related metabolic signatures, neuropathology and cognition > E4 to E2 switch reduces reactive microglia and plaque ApoE
plaincorrelational- Asserted: passes — The authors put it forward as true.
- Checkable: passes — It can be checked against evidence.
- Load-bearing: passes — The paper’s conclusions depend on it.
- Based: passes — The paper gives a reason why it holds.
A result the paper reports from its own data — it cites no other source for it, so there is none to check. The quote shows it is in the paper.
In the paper
“In this study, we show that short-term expression of astrocyte-derived E2 reduces proximity and colocalization of reactive microglia to plaques.”
§ APOE4 to APOE2 allelic switching in mice improves Alzheimer’s disease-related metabolic signatures, neuropathology and cognition > Discussion
plaindirect- Asserted: passes — The authors put it forward as true.
- Checkable: passes — It can be checked against evidence.
- Load-bearing: passes — The paper’s conclusions depend on it.
- Based: passes — The paper gives a reason why it holds.
A result the paper reports from its own data — it cites no other source for it, so there is none to check. The quote shows it is in the paper.
In the paper
“These findings were mirrored by histopathological reductions in microglial reactivity in 4s2A/FAD mice”
§ APOE4 to APOE2 allelic switching in mice improves Alzheimer’s disease-related metabolic signatures, neuropathology and cognition > Discussion
plaincorrelational- Asserted: passes — The authors put it forward as true.
- Checkable: passes — It can be checked against evidence.
- Load-bearing: passes — The paper’s conclusions depend on it.
- Based: passes — The paper gives a reason why it holds.
A result the paper reports from its own data — it cites no other source for it, so there is none to check. The quote shows it is in the paper.
In the paper
“4s2A/FAD mice showed a decrease in total MHC-II+ area and a decrease in colocalization between MHC-II + IBA1+ cells and amyloid plaques (Fig. 7a–d and Extended Data Fig. 9a–f)”
§ APOE4 to APOE2 allelic switching in mice improves Alzheimer’s disease-related metabolic signatures, neuropathology and cognition > E4 to E2 switch reduces reactive microglia and plaque ApoE
plaindirect- Asserted: passes — The authors put it forward as true.
- Checkable: passes — It can be checked against evidence.
- Load-bearing: passes — The paper’s conclusions depend on it.
- Based: passes — The paper gives a reason why it holds.
A result the paper reports from its own data — it cites no other source for it, so there is none to check. The quote shows it is in the paper.
In the paper
“We further show that an astrocyte-selective replacement of E4 with E2 significantly alters the transcriptomic profiles of multiple CNS cell types, reduces amyloid plaque load, dampens gliosis and improves cognitive outcomes in an amyloidosis model of AD.”
§ APOE4 to APOE2 allelic switching in mice improves Alzheimer’s disease-related metabolic signatures, neuropathology and cognition > Discussion
plaindirect- Asserted: passes — The authors put it forward as true.
- Checkable: passes — It can be checked against evidence.
- Load-bearing: passes — The paper’s conclusions depend on it.
- Based: passes — The paper gives a reason why it holds.
- Rests on an assumption: The 5xFAD model is an amyloidosis model of Alzheimer's disease.
A result the paper reports from its own data — it cites no other source for it, so there is none to check. The quote shows it is in the paper.
In the paper
“We further show that an astrocyte-selective replacement of E4 with E2 significantly alters the transcriptomic profiles of multiple CNS cell types, reduces amyloid plaque load, dampens gliosis and improves cognitive outcomes in an amyloidosis model of AD.”
§ APOE4 to APOE2 allelic switching in mice improves Alzheimer’s disease-related metabolic signatures, neuropathology and cognition > Discussion
boosteddirect- Asserted: passes — The authors put it forward as true.
- Checkable: passes — It can be checked against evidence.
- Load-bearing: passes — The paper’s conclusions depend on it.
- Based: passes — The paper gives a reason why it holds.
A result the paper reports from its own data — it cites no other source for it, so there is none to check. The quote shows it is in the paper.
In the paper
“Control mice expressing E4 in all cell types displayed many bright halos of ApoE staining surrounding the cores of plaques (Fig. 7g,h and Extended Data Fig. 8i–m).”
§ APOE4 to APOE2 allelic switching in mice improves Alzheimer’s disease-related metabolic signatures, neuropathology and cognition > E4 to E2 switch reduces reactive microglia and plaque ApoE
plain- Asserted: passes — The authors put it forward as true.
- Checkable: passes — It can be checked against evidence.
- Load-bearing: passes — The paper’s conclusions depend on it.
- Based: passes — The paper gives a reason why it holds.
A result the paper reports from its own data — it cites no other source for it, so there is none to check. The quote shows it is in the paper.
In the paper
“Despite reductions in parenchymal plaque load, we observed similar levels of CAA in the 4s2A/FAD and 4s2/FAD mice.”
§ APOE4 to APOE2 allelic switching in mice improves Alzheimer’s disease-related metabolic signatures, neuropathology and cognition > Discussion
plain- Asserted: passes — The authors put it forward as true.
- Checkable: passes — It can be checked against evidence.
- Load-bearing: passes — The paper’s conclusions depend on it.
- Based: passes — The paper gives a reason why it holds.
A result the paper reports from its own data — it cites no other source for it, so there is none to check. The quote shows it is in the paper.
In the paper
“Further analyses of these DEGs revealed that the pathways most affected by the E4 to E2 switch—both whole-body and astrocyte-specific—were pathways centered on cerebral metabolism, inflammation and cytoskeleton/vascular integrity”
§ APOE4 to APOE2 allelic switching in mice improves Alzheimer’s disease-related metabolic signatures, neuropathology and cognition > Discussion
plaindirect- Asserted: passes — The authors put it forward as true.
- Checkable: passes — It can be checked against evidence.
- Load-bearing: passes — The paper’s conclusions depend on it.
- Based: passes — The paper gives a reason why it holds.
A result the paper reports from its own data — it cites no other source for it, so there is none to check. The quote shows it is in the paper.
In the paper
“sex-based analysis showed significantly more cortical plaques with MHC-II+ microglia in female mice than males (Extended Data Fig. 9c).”
§ APOE4 to APOE2 allelic switching in mice improves Alzheimer’s disease-related metabolic signatures, neuropathology and cognition > E4 to E2 switch reduces reactive microglia and plaque ApoE
plaincorrelational- Asserted: passes — The authors put it forward as true.
- Checkable: passes — It can be checked against evidence.
- Load-bearing: unclear — It is unclear whether the paper’s conclusions depend on it.
- Based: passes — The paper gives a reason why it holds.
A result the paper reports from its own data — it cites no other source for it, so there is none to check. The quote shows it is in the paper.
In the paper
“Direct comparison of the DEGs distinguishing E2-TR from E4-TR mice to the DEGs of APOE4s2G versus APOE4s2 mice showed some commonality (~20%) across multiple cell types”
§ APOE4 to APOE2 allelic switching in mice improves Alzheimer’s disease-related metabolic signatures, neuropathology and cognition > Discussion
plaincorrelational- Asserted: passes — The authors put it forward as true.
- Checkable: passes — It can be checked against evidence.
- Load-bearing: passes — The paper’s conclusions depend on it.
- Based: passes — The paper gives a reason why it holds.
A result the paper reports from its own data — it cites no other source for it, so there is none to check. The quote shows it is in the paper.
In the paper
“the most significantly upregulated lipid in our dataset is a CER (Cer(d40:2)) involved in glucosylceramide synthesis”
§ APOE4 to APOE2 allelic switching in mice improves Alzheimer’s disease-related metabolic signatures, neuropathology and cognition > Discussion
plain- Asserted: passes — The authors put it forward as true.
- Checkable: passes — It can be checked against evidence.
- Load-bearing: unclear — It is unclear whether the paper’s conclusions depend on it.
- Based: passes — The paper gives a reason why it holds.
A result the paper reports from its own data — it cites no other source for it, so there is none to check. The quote shows it is in the paper.
In the paper
“Interestingly, we observed no differences in CAA between 4s2A/FAD and 4s2/FAD controls at 8 months of age (Fig. 5m,n).”
§ APOE4 to APOE2 allelic switching in mice improves Alzheimer’s disease-related metabolic signatures, neuropathology and cognition > Astrocyte-only E4 to E2 switch decreases amyloid plaque load
plain- Asserted: passes — The authors put it forward as true.
- Checkable: passes — It can be checked against evidence.
- Load-bearing: passes — The paper’s conclusions depend on it.
- Based: passes — The paper gives a reason why it holds.
A result the paper reports from its own data — it cites no other source for it, so there is none to check. The quote shows it is in the paper.
In the paper
“Although there was no change in homeostatic gene expression, decreased expression of several disease-associated microglia (DAM) genes, including Trem2, Clec7a and APOE, was also noted after the astrocyte-specific transition to E2 (Fig. 7e,f and Extended Data Fig. 9g,h).”
§ APOE4 to APOE2 allelic switching in mice improves Alzheimer’s disease-related metabolic signatures, neuropathology and cognition > E4 to E2 switch reduces reactive microglia and plaque ApoE
plaindirect- Asserted: passes — The authors put it forward as true.
- Checkable: passes — It can be checked against evidence.
- Load-bearing: passes — The paper’s conclusions depend on it.
- Based: passes — The paper gives a reason why it holds.
A result the paper reports from its own data — it cites no other source for it, so there is none to check. The quote shows it is in the paper.
In the paper
“While there was no difference in total ApoE protein levels between the 4s2A/FAD and 4s2/FAD mice, we observed a striking difference in plaque-associated ApoE.”
§ APOE4 to APOE2 allelic switching in mice improves Alzheimer’s disease-related metabolic signatures, neuropathology and cognition > E4 to E2 switch reduces reactive microglia and plaque ApoE
plain- Asserted: passes — The authors put it forward as true.
- Checkable: passes — It can be checked against evidence.
- Load-bearing: unclear — It is unclear whether the paper’s conclusions depend on it.
- Based: passes — The paper gives a reason why it holds.
A result the paper reports from its own data — it cites no other source for it, so there is none to check. The quote shows it is in the paper.
In the paper
“We further show that an astrocyte-selective replacement of E4 with E2 significantly alters the transcriptomic profiles of multiple CNS cell types, reduces amyloid plaque load, dampens gliosis and improves cognitive outcomes in an amyloidosis model of AD.”
§ APOE4 to APOE2 allelic switching in mice improves Alzheimer’s disease-related metabolic signatures, neuropathology and cognition > Discussion
boosteddirect- Asserted: passes — The authors put it forward as true.
- Checkable: passes — It can be checked against evidence.
- Load-bearing: passes — The paper’s conclusions depend on it.
- Based: passes — The paper gives a reason why it holds.
A result the paper reports from its own data — it cites no other source for it, so there is none to check. The quote shows it is in the paper.
In the paper
“peripheral phenotyping of APOE4s2G mice showed that the in vivo E4 to E2 switch shifted animals to an HLP-III-like plasma lipid profile.”
§ APOE4 to APOE2 allelic switching in mice improves Alzheimer’s disease-related metabolic signatures, neuropathology and cognition > Discussion
plaindirect- Asserted: passes — The authors put it forward as true.
- Checkable: passes — It can be checked against evidence.
- Load-bearing: passes — The paper’s conclusions depend on it.
- Based: passes — The paper gives a reason why it holds.
A result the paper reports from its own data — it cites no other source for it, so there is none to check. The quote shows it is in the paper.
In the paper
“We further show that an astrocyte-selective replacement of E4 with E2 significantly alters the transcriptomic profiles of multiple CNS cell types, reduces amyloid plaque load, dampens gliosis and improves cognitive outcomes in an amyloidosis model of AD.”
§ APOE4 to APOE2 allelic switching in mice improves Alzheimer’s disease-related metabolic signatures, neuropathology and cognition > Discussion
boosteddirect- Asserted: passes — The authors put it forward as true.
- Checkable: passes — It can be checked against evidence.
- Load-bearing: passes — The paper’s conclusions depend on it.
- Based: passes — The paper gives a reason why it holds.
A result the paper reports from its own data — it cites no other source for it, so there is none to check. The quote shows it is in the paper.
In the paper
“untargeted lipidomic profiling of the brain revealed that the allelic switch altered multiple PC, CER and lyso-PC (LPC) species”
§ APOE4 to APOE2 allelic switching in mice improves Alzheimer’s disease-related metabolic signatures, neuropathology and cognition > Discussion
plaindirect- Asserted: passes — The authors put it forward as true.
- Checkable: passes — It can be checked against evidence.
- Load-bearing: passes — The paper’s conclusions depend on it.
- Based: passes — The paper gives a reason why it holds.
- Rests on an assumption: LPCs are pro-inflammatory lipids that act as ‘find me’ signals for myeloid cells.
A result the paper reports from its own data — it cites no other source for it, so there is none to check. The quote shows it is in the paper.
In the paper
“ELISA quantification of ApoE supported these findings, with significant reductions of ApoE within the insoluble (plaque-associated) brain fractions from 4s2A/FAD mice, but no differences in soluble ApoE (Fig. 7i,j and Extended Data Fig. 9n,o).”
§ APOE4 to APOE2 allelic switching in mice improves Alzheimer’s disease-related metabolic signatures, neuropathology and cognition > E4 to E2 switch reduces reactive microglia and plaque ApoE
plain- Asserted: passes — The authors put it forward as true.
- Checkable: passes — It can be checked against evidence.
- Load-bearing: unclear — It is unclear whether the paper’s conclusions depend on it.
- Based: passes — The paper gives a reason why it holds.
- Rests on an assumption: The insoluble brain fraction corresponds to plaque-associated ApoE.
A result the paper reports from its own data — it cites no other source for it, so there is none to check. The quote shows it is in the paper.
In the paper
“Importantly, this overlap with AD scRNA-seq datasets occurred in both the global and astrocyte-specific switch models that lack overt AD pathology.”
§ APOE4 to APOE2 allelic switching in mice improves Alzheimer’s disease-related metabolic signatures, neuropathology and cognition > Discussion
plaincorrelational- Asserted: passes — The authors put it forward as true.
- Checkable: passes — It can be checked against evidence.
- Load-bearing: passes — The paper’s conclusions depend on it.
- Based: passes — The paper gives a reason why it holds.
A result the paper reports from its own data — it cites no other source for it, so there is none to check. The quote shows it is in the paper.
In the paper
“Strikingly, we show that a 2-month-long astrocyte-specific E4 to E2 switch after pathology onset is sufficient to decrease plaque load, reduce markers of glial reactivity and improve associative, but not spatial, memory in the 5xFAD model.”
§ APOE4 to APOE2 allelic switching in mice improves Alzheimer’s disease-related metabolic signatures, neuropathology and cognition > Discussion
boosteddirect- Asserted: passes — The authors put it forward as true.
- Checkable: passes — It can be checked against evidence.
- Load-bearing: passes — The paper’s conclusions depend on it.
- Based: passes — The paper gives a reason why it holds.
- Rests on an assumption: The 5xFAD model is an amyloidosis model of Alzheimer's disease.
A result the paper reports from its own data — it cites no other source for it, so there is none to check. The quote shows it is in the paper.
In the paper
“GFAP and IBA1 levels were most substantially decreased in the hippocampus, thalamus and cortical areas (Fig. 6d,e and Extended Data Fig. 8a–c).”
§ APOE4 to APOE2 allelic switching in mice improves Alzheimer’s disease-related metabolic signatures, neuropathology and cognition > Astrocyte E4 to E2 replacement lowers plaque-associated gliosis
plain- Asserted: passes — The authors put it forward as true.
- Checkable: passes — It can be checked against evidence.
- Load-bearing: passes — The paper’s conclusions depend on it.
- Based: passes — The paper gives a reason why it holds.
A result the paper reports from its own data — it cites no other source for it, so there is none to check. The quote shows it is in the paper.
In the paper
“4s2A/FAD mice showed a decrease in total MHC-II+ area and a decrease in colocalization between MHC-II + IBA1+ cells and amyloid plaques (Fig. 7a–d and Extended Data Fig. 9a–f)”
§ APOE4 to APOE2 allelic switching in mice improves Alzheimer’s disease-related metabolic signatures, neuropathology and cognition > E4 to E2 switch reduces reactive microglia and plaque ApoE
plaindirect- Asserted: passes — The authors put it forward as true.
- Checkable: passes — It can be checked against evidence.
- Load-bearing: passes — The paper’s conclusions depend on it.
- Based: passes — The paper gives a reason why it holds.
A result the paper reports from its own data — it cites no other source for it, so there is none to check. The quote shows it is in the paper.
In the paper
“Lastly, we show that a late disease stage ‘switch’ to expression of astrocytic E2 reduces plaque-associated ApoE.”
§ APOE4 to APOE2 allelic switching in mice improves Alzheimer’s disease-related metabolic signatures, neuropathology and cognition > Discussion
plaindirect- Asserted: passes — The authors put it forward as true.
- Checkable: passes — It can be checked against evidence.
- Load-bearing: passes — The paper’s conclusions depend on it.
- Based: passes — The paper gives a reason why it holds.
A result the paper reports from its own data — it cites no other source for it, so there is none to check. The quote shows it is in the paper.
In the paper
“Overall, there were very few sex differences in AD-related pathology.”
§ APOE4 to APOE2 allelic switching in mice improves Alzheimer’s disease-related metabolic signatures, neuropathology and cognition > Astrocyte-only E4 to E2 switch decreases amyloid plaque load
plain- Asserted: passes — The authors put it forward as true.
- Checkable: passes — It can be checked against evidence.
- Load-bearing: unclear — It is unclear whether the paper’s conclusions depend on it.
- Based: passes — The paper gives a reason why it holds.
A conclusion the paper draws from its own results — it cites no other source for it, so there is none to check. The quote shows it is in the paper.
In the paper
“Together, these data show that a short-term transition from APOE4 to APOE2 can broadly affect the cerebral transcriptome and lipidome, and that astrocyte-specific APOE replacement may be a viable strategy for future gene editing approaches to simultaneously reduce multiple AD-associated pathologies.”
§ APOE4 to APOE2 allelic switching in mice improves Alzheimer’s disease-related metabolic signatures, neuropathology and cognition > Abstract
plaindirect- Asserted: passes — The authors put it forward as true.
- Checkable: passes — It can be checked against evidence.
- Load-bearing: passes — The paper’s conclusions depend on it.
- Based: passes — The paper gives a reason why it holds.
A conclusion the paper draws from its own results — it cites no other source for it, so there is none to check. The quote shows it is in the paper.
In the paper
“Collectively, these results demonstrate that, even in the absence of AD pathology, a postdevelopmental transition from expression of E4 to E2 is sufficient to drive transcriptomic changes in pathways previously implicated in AD.”
§ APOE4 to APOE2 allelic switching in mice improves Alzheimer’s disease-related metabolic signatures, neuropathology and cognition > Full-body switching drives AD-relevant transcriptomic changes
boosteddirect- Asserted: passes — The authors put it forward as true.
- Checkable: passes — It can be checked against evidence.
- Load-bearing: passes — The paper’s conclusions depend on it.
- Based: passes — The paper gives a reason why it holds.
- Rests on an assumption: Overlap of mouse DEGs with human AD gene lists indicates AD relevance.
A conclusion the paper draws from its own results — it cites no other source for it, so there is none to check. The quote shows it is in the paper.
In the paper
“Together, these data suggest that astrocyte-exclusive expression of E2 is sufficient to drive AD-relevant alterations in the glial transcriptome, even when all other cell types continue to express E4 and even in a model that lacks overt AD pathology.”
§ APOE4 to APOE2 allelic switching in mice improves Alzheimer’s disease-related metabolic signatures, neuropathology and cognition > Astrocyte-only switch to E2 drives similar gene expression
hedgeddirect- Asserted: passes — The authors put it forward as true.
- Checkable: passes — It can be checked against evidence.
- Load-bearing: passes — The paper’s conclusions depend on it.
- Based: passes — The paper gives a reason why it holds.
- Rests on an assumption: Overlap of mouse DEGs with human AD gene lists indicates AD relevance.
A conclusion the paper draws from its own results — it cites no other source for it, so there is none to check. The quote shows it is in the paper.
In the paper
“Together, these data show that a short-term transition from APOE4 to APOE2 can broadly affect the cerebral transcriptome and lipidome, and that astrocyte-specific APOE replacement may be a viable strategy for future gene editing approaches to simultaneously reduce multiple AD-associated pathologies.”
§ APOE4 to APOE2 allelic switching in mice improves Alzheimer’s disease-related metabolic signatures, neuropathology and cognition > Abstract
hedgedconditional- Asserted: passes — The authors put it forward as true.
- Checkable: passes — It can be checked against evidence.
- Load-bearing: passes — The paper’s conclusions depend on it.
- Based: passes — The paper gives a reason why it holds.
- Rests on an assumption: The APOE4s2 mouse model faithfully recapitulates human APOE allelic switching and its effects.
- Rests on an assumption: Findings in APOE4s2 mice will translate to human APOE4 carriers.
What the paper did — it cites no source for this, so there is none to check. The quote shows it is in the paper.
In the paper
“Cell-type specificity was confirmed via colocalization of GFAP with tdTomato expression in APOE4s2A mice crossed to an Ai9 Cre reporter strain (Fig. 4b and Extended Data Fig. 5a).”
§ APOE4 to APOE2 allelic switching in mice improves Alzheimer’s disease-related metabolic signatures, neuropathology and cognition > Astrocyte-only switch to E2 drives similar gene expression
plaincorrelational- Asserted: passes — The authors put it forward as true.
- Checkable: passes — It can be checked against evidence.
- Load-bearing: passes — The paper’s conclusions depend on it.
- Based: passes — The paper gives a reason why it holds.
A conclusion the paper draws from its own results — it cites no other source for it, so there is none to check. The quote shows it is in the paper.
In the paper
“Together, these studies suggest that an approach where E4 is eliminated and replaced with E2 could be a highly effective therapeutic strategy.”
§ APOE4 to APOE2 allelic switching in mice improves Alzheimer’s disease-related metabolic signatures, neuropathology and cognition > Main
hedgedconditional- Asserted: passes — The authors put it forward as true.
- Checkable: passes — It can be checked against evidence.
- Load-bearing: passes — The paper’s conclusions depend on it.
- Based: passes — The paper gives a reason why it holds.
A conclusion the paper draws from its own results — it cites no other source for it, so there is none to check. The quote shows it is in the paper.
In the paper
“Excitingly, this may suggest that the overarching cellular pathways that define AD in the human brain could be altered by transitioning from E4 to E2.”
§ APOE4 to APOE2 allelic switching in mice improves Alzheimer’s disease-related metabolic signatures, neuropathology and cognition > Discussion
hedgedconditional- Asserted: passes — The authors put it forward as true.
- Checkable: passes — It can be checked against evidence.
- Load-bearing: passes — The paper’s conclusions depend on it.
- Based: passes — The paper gives a reason why it holds.
A conclusion the paper draws from its own results — it cites no other source for it, so there is none to check. The quote shows it is in the paper.
In the paper
“highlighting potential differential effects of the E2 versus E4 isoforms on plaque expansion or compaction.”
§ APOE4 to APOE2 allelic switching in mice improves Alzheimer’s disease-related metabolic signatures, neuropathology and cognition > E4 to E2 switch reduces reactive microglia and plaque ApoE
hedgedconditional- Asserted: passes — The authors put it forward as true.
- Checkable: passes — It can be checked against evidence.
- Load-bearing: passes — The paper’s conclusions depend on it.
- Based: passes — The paper gives a reason why it holds.
A conclusion the paper draws from its own results — it cites no other source for it, so there is none to check. The quote shows it is in the paper.
In the paper
“Our results showing changes in microglia, oligodendrocyte and endothelial cell transcriptomes after the astrocyte-selective switch also suggest strong non-cell-autonomous effects of astrocyte-derived E2.”
§ APOE4 to APOE2 allelic switching in mice improves Alzheimer’s disease-related metabolic signatures, neuropathology and cognition > Discussion
hedgedconditional- Asserted: passes — The authors put it forward as true.
- Checkable: passes — It can be checked against evidence.
- Load-bearing: passes — The paper’s conclusions depend on it.
- Based: passes — The paper gives a reason why it holds.
A conclusion the paper draws from its own results — it cites no other source for it, so there is none to check. The quote shows it is in the paper.
In the paper
“again suggestive of non-cell-autonomous effects of ApoE2.”
§ APOE4 to APOE2 allelic switching in mice improves Alzheimer’s disease-related metabolic signatures, neuropathology and cognition > Astrocyte E4 to E2 replacement lowers plaque-associated gliosis
hedgedconditional- Asserted: passes — The authors put it forward as true.
- Checkable: passes — It can be checked against evidence.
- Load-bearing: passes — The paper’s conclusions depend on it.
- Based: passes — The paper gives a reason why it holds.
A conclusion the paper draws from its own results — it cites no other source for it, so there is none to check. The quote shows it is in the paper.
In the paper
“suggest an alternative scenario where astrocyte-derived E2 could be having non-cell-autonomous effects on microglial activation and response to plaque”
§ APOE4 to APOE2 allelic switching in mice improves Alzheimer’s disease-related metabolic signatures, neuropathology and cognition > Discussion
hedgedconditional- Asserted: passes — The authors put it forward as true.
- Checkable: passes — It can be checked against evidence.
- Load-bearing: passes — The paper’s conclusions depend on it.
- Based: passes — The paper gives a reason why it holds.
A conclusion the paper draws from its own results — it cites no other source for it, so there is none to check. The quote shows it is in the paper.
In the paper
“Rather, many of these DEGs are acutely malleable, at least within the specific parameters tested in this study.”
§ APOE4 to APOE2 allelic switching in mice improves Alzheimer’s disease-related metabolic signatures, neuropathology and cognition > Discussion
hedgedconditional- Asserted: passes — The authors put it forward as true.
- Checkable: passes — It can be checked against evidence.
- Load-bearing: passes — The paper’s conclusions depend on it.
- Based: passes — The paper gives a reason why it holds.
A conclusion the paper draws from its own results — it cites no other source for it, so there is none to check. The quote shows it is in the paper.
In the paper
“Interestingly, these are the same primary cell types affected by a short-term E4 to E2 transition.”
§ APOE4 to APOE2 allelic switching in mice improves Alzheimer’s disease-related metabolic signatures, neuropathology and cognition > Discussion
plaincorrelational- Asserted: passes — The authors put it forward as true.
- Checkable: passes — It can be checked against evidence.
- Load-bearing: unclear — It is unclear whether the paper’s conclusions depend on it.
- Based: passes — The paper gives a reason why it holds.
A conclusion the paper draws from its own results — it cites no other source for it, so there is none to check. The quote shows it is in the paper.
In the paper
“Together, these findings highlight a strong decrease in plaque-associated astro-gliosis and micro-gliosis after an astrocytic E4 to E2 switch.”
§ APOE4 to APOE2 allelic switching in mice improves Alzheimer’s disease-related metabolic signatures, neuropathology and cognition > Astrocyte E4 to E2 replacement lowers plaque-associated gliosis
boosteddirect- Asserted: passes — The authors put it forward as true.
- Checkable: passes — It can be checked against evidence.
- Load-bearing: passes — The paper’s conclusions depend on it.
- Based: passes — The paper gives a reason why it holds.
A conclusion the paper draws from its own results — it cites no other source for it, so there is none to check. The quote shows it is in the paper.
In the paper
“and that these various measures of gliosis differentially correlate with memory.”
§ APOE4 to APOE2 allelic switching in mice improves Alzheimer’s disease-related metabolic signatures, neuropathology and cognition > E4 to E2 switch reduces reactive microglia and plaque ApoE
plaincorrelational- Asserted: passes — The authors put it forward as true.
- Checkable: passes — It can be checked against evidence.
- Load-bearing: unclear — It is unclear whether the paper’s conclusions depend on it.
- Based: passes — The paper gives a reason why it holds.
A conclusion the paper draws from its own results — it cites no other source for it, so there is none to check. The quote shows it is in the paper.
In the paper
“the increases in plasma TGs and ApoE observed in APOE4s2G mice ‘after the switch’ were exciting confirmatory results regarding the effectiveness of our model design.”
§ APOE4 to APOE2 allelic switching in mice improves Alzheimer’s disease-related metabolic signatures, neuropathology and cognition > Discussion
plaindirect- Asserted: passes — The authors put it forward as true.
- Checkable: passes — It can be checked against evidence.
- Load-bearing: unclear — It is unclear whether the paper’s conclusions depend on it.
- Based: passes — The paper gives a reason why it holds.
A conclusion the paper draws from its own results — it cites no other source for it, so there is none to check. The quote shows it is in the paper.
In the paper
“indicating a reduction in ARMs after the 2-month astrocyte-specific switch to E2.”
§ APOE4 to APOE2 allelic switching in mice improves Alzheimer’s disease-related metabolic signatures, neuropathology and cognition > E4 to E2 switch reduces reactive microglia and plaque ApoE
hedgeddirect- Asserted: passes — The authors put it forward as true.
- Checkable: passes — It can be checked against evidence.
- Load-bearing: passes — The paper’s conclusions depend on it.
- Based: passes — The paper gives a reason why it holds.
A conclusion the paper draws from its own results — it cites no other source for it, so there is none to check. The quote shows it is in the paper.
In the paper
“suggesting that E4’s transcriptional signature is not permanently established during development or early life.”
§ APOE4 to APOE2 allelic switching in mice improves Alzheimer’s disease-related metabolic signatures, neuropathology and cognition > Discussion
hedged- Asserted: passes — The authors put it forward as true.
- Checkable: passes — It can be checked against evidence.
- Load-bearing: passes — The paper’s conclusions depend on it.
- Based: passes — The paper gives a reason why it holds.
A conclusion the paper draws from its own results — it cites no other source for it, so there is none to check. The quote shows it is in the paper.
In the paper
“Our findings, taken together with the literature, suggest that astrocyte-derived E4’s ability to bind Aβ increases Aβ accumulation and ApoE protein aggregation within or surrounding the plaque.”
§ APOE4 to APOE2 allelic switching in mice improves Alzheimer’s disease-related metabolic signatures, neuropathology and cognition > Discussion
hedgeddirect- Asserted: passes — The authors put it forward as true.
- Checkable: passes — It can be checked against evidence.
- Load-bearing: passes — The paper’s conclusions depend on it.
- Based: passes — The paper gives a reason why it holds.
A conclusion the paper draws from its own results — it cites no other source for it, so there is none to check. The quote shows it is in the paper.
In the paper
“Our study suggests that astrocyte-exclusive ‘switching’ from E4 to E2 in the CNS can mitigate AD pathologies”
§ APOE4 to APOE2 allelic switching in mice improves Alzheimer’s disease-related metabolic signatures, neuropathology and cognition > Discussion
hedgeddirect- Asserted: passes — The authors put it forward as true.
- Checkable: passes — It can be checked against evidence.
- Load-bearing: passes — The paper’s conclusions depend on it.
- Based: passes — The paper gives a reason why it holds.
- Rests on an assumption: Aldh1l1-CreERT2 is highly selective for astrocytes in the CNS.
- Rests on an assumption: The 5xFAD model is an amyloidosis model of Alzheimer's disease.
- It may state two separate claims as one. 26
- Probably not a substantial claim. 25
Some cited sources support this claim and some don’t — read each source’s verdict below.
In the paper
“E2 carriage has been linked to a higher risk of melanoma38, age-related macular degeneration39 and even some neurological disorders such as posttraumatic stress disorder40 and progressive supranuclear palsy41.”
§ APOE4 to APOE2 allelic switching in mice improves Alzheimer’s disease-related metabolic signatures, neuropathology and cognition > Discussion
What the sources say
- Disputedcites [38] Ostendorf, B. N. et al. Common germline variants of the human APOE gene modulate melanoma progression and survival. Nat. Med. 26, 1048–1053 (2020). sourceExperimental — accuracy not yet measured
Citation 38 is attached to melanoma, not the other conditions in the sentence. The paper’s patient-genotype analysis states that APOE2 carriers were not enriched among melanoma patients and that APOE2 was not associated with increased melanoma incidence. It links APOE2 instead to poorer survival among patients with melanoma. (LLM, conf=0.90)
Checked by a reasoning model — may be wrong.
- Not checked — no full text of the sourcecites [39] Adams, M. K. M. et al. Apolipoprotein E gene associations in age-related macular degeneration: the Melbourne Collaborative Cohort Study. Am. J. Epidemiol. 175, 511–518 (2012). source
- Supportedcites [40] Johnson, L. A. et al. ApoE2 exaggerates PTSD-related behavioral, cognitive, and neuroendocrine alterations. Neuropsychopharmacology 40, 2443–2453 (2015). source
The Introduction states that E2 has been associated with increased risk and severity of PTSD. The Discussion reports more severe PTSD symptoms among E2/E3 combat veterans with PTSD, consistent with the cited sentence’s PTSD link. This citation is attached to PTSD, not to melanoma, macular degeneration, or progressive supranuclear palsy. (LLM, conf=0.91)
plaincorrelational- Asserted: passes — The authors put it forward as true.
- Checkable: passes — It can be checked against evidence.
- Load-bearing: unclear — It is unclear whether the paper’s conclusions depend on it.
- Based: passes — The paper gives a reason why it holds.
It may state two separate claims as one.
- Disputed
At least one cited source doesn’t support this claim or points to a different paper, and none confirmed it — see the verdicts below.
In the paper
“Because APOE4 is also a risk factor for cerebral amyloid angiopathy (CAA)31, we measured CAA before and after the inducible, astrocyte-specific transition to APOE2.”
§ APOE4 to APOE2 allelic switching in mice improves Alzheimer’s disease-related metabolic signatures, neuropathology and cognition > Astrocyte-only E4 to E2 switch decreases amyloid plaque load
What the sources say
- Misattributedcites [31] Castellano, J. M. et al. Human apoE isoforms differentially regulate brain amyloid-β peptide clearance. Sci. Transl. Med. 3, 89ra57 (2011). sourceExperimental — accuracy not yet measured
The Results section reports APOE4-associated brain amyloid burden and plaque biomarkers, not CAA risk. In the References section (page unavailable), the only explicit CAA statement is the title of a separate study by Fryer et al. (2005), which says apoE4 promotes CAA in a transgenic mouse model. (LLM, conf=0.82) It matches “Human apolipoprotein E4 alters the amyloid-beta 40:42 ratio and promotes the formation of cerebral amyloid angiopathy in an amyloid precursor protein transgenic model” (2005) instead.
Checked by a reasoning model — may be wrong.
plaincorrelational- Asserted: passes — The authors put it forward as true.
- Checkable: passes — It can be checked against evidence.
- Load-bearing: passes — The paper’s conclusions depend on it.
- Based: passes — The paper gives a reason why it holds.
Probably not a substantial claim.
- Misattributed
Every source the paper cites for this claim was checked and supports it.
In the paper
“Compared with E3, E4 confers up to a 13-fold increase in risk for AD in homozygous carriers1.”
§ APOE4 to APOE2 allelic switching in mice improves Alzheimer’s disease-related metabolic signatures, neuropathology and cognition > Main
What the sources say
- Supportedcites [1] Belloy, M. E. et al. APOE genotype and Alzheimer disease risk across age, sex, and population ancestry. JAMA Neurol. 80, 1284–1294 (2023). source
The Results table in the Race and Ethnicity Analyses uses APOE*33 (E3/E3) as the reference and reports an odds ratio of 13.04 for APOE*44 (E4/E4) among White individuals. This supports the approximately 13-fold comparison, though the estimate varies across population groups. (LLM, conf=0.93)
plaindirect- Asserted: passes — The authors put it forward as true.
- Checkable: passes — It can be checked against evidence.
- Load-bearing: fails — The paper’s conclusions may not depend on it.
- Based: passes — The paper gives a reason why it holds.
Probably not a substantial claim. The paper’s conclusions may not depend on it.
- Supported
The cited sources support only part of this claim — read each source’s verdict below.
In the paper
“Previous work established that human APOE affects amyloid plaque deposition in the 5xFAD brain in a genotype-dependent fashion (E4 > E2)31.”
§ APOE4 to APOE2 allelic switching in mice improves Alzheimer’s disease-related metabolic signatures, neuropathology and cognition > Astrocyte-only E4 to E2 switch decreases amyloid plaque load
What the sources say
- Partly supportedcites [31] Castellano, J. M. et al. Human apoE isoforms differentially regulate brain amyloid-β peptide clearance. Sci. Transl. Med. 3, 89ra57 (2011). sourceExperimental — accuracy not yet measured
The Results section on old PDAPP mice reports that hippocampal amyloid plaque load varied by human apoE isoform, with E4 showing greater Aβ deposition than E2. The mice studied were PDAPP/TRE, not 5xFAD, so the source does not establish the claim specifically for the 5xFAD brain. (LLM, conf=0.90)
boosteddirect- Asserted: passes — The authors put it forward as true.
- Checkable: passes — It can be checked against evidence.
- Load-bearing: passes — The paper’s conclusions depend on it.
- Based: passes — The paper gives a reason why it holds.
Probably not a substantial claim.
- Partly supported
The cited sources support only part of this claim — read each source’s verdict below.
In the paper
“Conversely, E2 is strongly neuroprotective, reducing AD risk by up to 40%, slowing cognitive decline and increasing longevity2–4.”
§ APOE4 to APOE2 allelic switching in mice improves Alzheimer’s disease-related metabolic signatures, neuropathology and cognition > Main
What the sources say
- Not checked — no full text of the sourcecites [2] Corder, E. et al. Protective effect of apolipoproteinE type 2 allele for late onset Alzheimer disease. Nat. Genet. 7, 180–184 (1994). source
- Partly supportedcites [3] Garatachea, N. et al. ApoE gene and exceptional longevity: insights from three independent cohorts. Exp. Gerontol. 53, 16–23 (2014). sourceExperimental — accuracy not yet measured
The Discussion (p. 7) reports lower amyloid-β oligomer levels in AD patients carrying ε2 and protection against cognitive decline in the oldest old. The paper also associates ε2 with exceptional longevity in its Italian and Japanese cohorts (abstract, p. 2), but it does not report a 40% reduction in AD risk or establish that ε2 is strongly neuroprotective. (LLM, conf=0.87)
- Partly supportedcites [4] Wilson, R., Bienias, J., Berry-Kravis, E., Evans, D. & Bennett, D. The apolipoprotein E ε2 allele and decline in episodic memory. J. Neurol. Neurosurg. Psychiatry 73, 672–677 (2002). sourceExperimental — accuracy not yet measured
The Incident AD in apoE subgroups section reports a relative risk of 0.76 for E2 versus E3/3—an estimated 24% reduction, not a reported 40% reduction—and its 95% confidence interval (0.40–1.44) includes no reduction. The Discussion explicitly says the lower AD incidence was not statistically significant, so calling E2 strongly neuroprotective overstates this finding. The Discussion supports slower episodic-memory decline, but not a general slowing of cognitive decline; the cited passages do not establish increased longevity. (LLM, conf=0.88)
boosteddirect- Asserted: passes — The authors put it forward as true.
- Checkable: passes — It can be checked against evidence.
- Load-bearing: passes — The paper’s conclusions depend on it.
- Based: passes — The paper gives a reason why it holds.
Probably not a substantial claim. It may state two separate claims as one.
The cited sources support only part of this claim — read each source’s verdict below.
In the paper
“ApoE is a major component of plaques51.”
§ APOE4 to APOE2 allelic switching in mice improves Alzheimer’s disease-related metabolic signatures, neuropathology and cognition > Discussion
What the sources say
- Partly supportedcites [51] Gal, J. et al. Apolipoprotein E proteinopathy is a major dementia-associated pathologic biomarker in individuals with or without the APOE Epsilon 4 Allele. Am. J. Pathol. 192, 564–578 (2022). sourceExperimental — accuracy not yet measured
The Results report strong ApoE staining in a plaque core and extensive ApoE localization in plaque-like structures. These findings support ApoE’s presence in plaques, but the paper does not establish that it is a major component of plaques. (LLM, conf=0.82)
plaincorrelational- Asserted: passes — The authors put it forward as true.
- Checkable: passes — It can be checked against evidence.
- Load-bearing: passes — The paper’s conclusions depend on it.
- Based: passes — The paper gives a reason why it holds.
Probably not a substantial claim.
- Partly supported
Every source the paper cites for this claim was checked and supports it.
In the paper
“findings from a study by Mahan et al.36 suggested a role for astrocyte-derived ApoE in amyloid reduction and associated gliosis.”
§ APOE4 to APOE2 allelic switching in mice improves Alzheimer’s disease-related metabolic signatures, neuropathology and cognition > Discussion
What the sources say
- Supportedcites Mahan et al.36 Mahan, T. E. et al. Selective reduction of astrocyte apoE3 and apoE4 strongly reduces Aβ accumulation and plaque-related pathology in a mouse model of amyloidosis. Mol. Neurodegener. 17, 13 (2022). source
The Conclusion reports that reducing astrocytic apoE3 or apoE4 decreased amyloid plaque deposition and microglial activation around fibrillar plaques. It also reports isoform-dependent effects on astrocyte activation, supporting the claim about associated gliosis in this mouse model. (LLM, conf=0.91)
hedgedconditional- Asserted: passes — The authors put it forward as true.
- Checkable: passes — It can be checked against evidence.
- Load-bearing: fails — The paper’s conclusions may not depend on it.
- Based: passes — The paper gives a reason why it holds.
Probably not a substantial claim. The paper’s conclusions may not depend on it.
- Supported
The cited sources support only part of this claim — read each source’s verdict below.
In the paper
“a process downregulated in AD brains34.”
§ APOE4 to APOE2 allelic switching in mice improves Alzheimer’s disease-related metabolic signatures, neuropathology and cognition > Discussion
What the sources say
- Partly supportedcites [34] Filippov, V. et al. Increased ceramide in brains with Alzheimer’s and other neurodegenerative diseases. J. Alzheimers Dis. 29, 537–547 (2012). sourceExperimental — accuracy not yet measured
The Discussion reports downregulated expression of UGCG, the enzyme that synthesizes glucosylceramide from ceramide, and cites lower UGCG activity in AD frontal cortex. But the Results report variable UGCG expression across the paper’s AD samples, including four with higher expression; the paper does not directly establish that glucosylceramide synthesis is generally downregulated in AD brains. (LLM, conf=0.84)
plain- Asserted: passes — The authors put it forward as true.
- Checkable: passes — It can be checked against evidence.
- Load-bearing: fails — The paper’s conclusions may not depend on it.
- Based: passes — The paper gives a reason why it holds.
Probably not a substantial claim. The paper’s conclusions may not depend on it.
- Partly supported
The cited sources support only part of this claim — read each source’s verdict below.
In the paper
“Additionally, microglia cluster around Aβ deposits in CAA49.”
§ APOE4 to APOE2 allelic switching in mice improves Alzheimer’s disease-related metabolic signatures, neuropathology and cognition > Discussion
What the sources say
- Partly supportedcites [49] Zabel, M. et al. A shift in microglial β-amyloid binding in Alzheimer’s disease is associated with cerebral amyloid angiopathy. Brain Pathol. 23, 390–401 (2013). sourceExperimental — accuracy not yet measured
The Results section ('Microglial Aβ binding via CD11b'; page unavailable) reports Aβ40 colocalized with microglial processes in AD/CAA brains. It does not report microglia clustering around Aβ deposits; the Discussion proposes that microglia transport Aβ to the vasculature, which is different from observing such clusters. (LLM, conf=0.84)
plaincorrelational- Asserted: passes — The authors put it forward as true.
- Checkable: passes — It can be checked against evidence.
- Load-bearing: fails — The paper’s conclusions may not depend on it.
- Based: passes — The paper gives a reason why it holds.
Probably not a substantial claim. The paper’s conclusions may not depend on it.
- Partly supported
The cited sources support only part of this claim — read each source’s verdict below.
In the paper
“Using an inverse approach, Liu et al.46 showed that astrocyte-specific expression of E4 suppressed amyloid clearance, with particularly strong effects during the amyloid seeding phase.”
§ APOE4 to APOE2 allelic switching in mice improves Alzheimer’s disease-related metabolic signatures, neuropathology and cognition > Discussion
What the sources say
- Partly supportedcites Liu et al.46 Liu, C.-C.et al. ApoE4 accelerates early seeding of amyloid pathology. Neuron 96, 1024–1032 (2017). sourceExperimental — accuracy not yet measured
The Results section, “Expression of apoE4 in astrocytes suppresses Aβ clearance” (page unavailable), reports impaired Aβ clearance with astrocytic apoE4. A separate Results section finds stronger effects on Aβ levels and amyloid deposition when apoE4 was expressed during seeding than during rapid plaque growth. It does not establish that the suppression of clearance itself was particularly strong during seeding. (LLM, conf=0.84)
boosteddirect- Asserted: passes — The authors put it forward as true.
- Checkable: passes — It can be checked against evidence.
- Load-bearing: unclear — It is unclear whether the paper’s conclusions depend on it.
- Based: passes — The paper gives a reason why it holds.
It may state two separate claims as one.
- Partly supported
Every source the paper cites for this claim was checked and supports it.
In the paper
“While that study did not report decreases in IBA1 as those seen in this study, they observed a similar decrease in reactive microglia using Clec7a, and a reduction in plaque-associated ApoE.”
§ APOE4 to APOE2 allelic switching in mice improves Alzheimer’s disease-related metabolic signatures, neuropathology and cognition > Discussion
What the sources say
- Supportedcites Mahan et al.36 Mahan, T. E. et al. Selective reduction of astrocyte apoE3 and apoE4 strongly reduces Aβ accumulation and plaque-related pathology in a mouse model of amyloidosis. Mol. Neurodegener. 17, 13 (2022). source
In Results, “Microglial activation after the loss of astrocytic apoE” (page not provided), Clec7a around plaques decreased by approximately 50–70%, and apoE in plaque-associated microglia decreased by approximately 60–70% in Cre+ mice. The same passage reports that overall cortical Iba1 staining and Iba1+ microglial clustering around plaques were unchanged between Cre+ and Cre− groups. (LLM, conf=0.93)
plain- Asserted: passes — The authors put it forward as true.
- Checkable: passes — It can be checked against evidence.
- Load-bearing: fails — The paper’s conclusions may not depend on it.
- Based: passes — The paper gives a reason why it holds.
Probably not a substantial claim. The paper’s conclusions may not depend on it. It may state two separate claims as one.
- Supported
The cited sources support only part of this claim — read each source’s verdict below.
In the paper
“The literature suggests that there are isoform-dependent differences in ApoE–plaque associations but that several factors, such as ApoE lipidation state, compartment or cell type of origin, and Aβ conformational state, also have important roles in ApoE–Aβ interactions52–56.”
§ APOE4 to APOE2 allelic switching in mice improves Alzheimer’s disease-related metabolic signatures, neuropathology and cognition > Discussion
What the sources say
- Not checked — no full text of the sourcecites [52] Strittmatter, W. J. et al. Binding of human apolipoprotein E to synthetic amyloid beta peptide: isoform-specific effects and implications for late-onset Alzheimer disease. Proc. Natl Acad. Sci. USA 90, 8098–8102 (1993). source
- Not checked — no full text of the sourcecites [53] LaDu, M. J. et al. Purification of apolipoprotein E attenuates isoform-specific binding to β-amyloid. J. Biol. Chem. 270, 9039–9042 (1995). source
- Not checked — no full text of the sourcecites [54] LaDu, M. J. et al. Isoform-specific binding of apolipoprotein E to β-amyloid. J. Biol. Chem. 269, 23403–23406 (1994). source
- Supportedcites [55] Tai, L. M. et al. Levels of soluble apolipoprotein E/amyloid-β (Aβ) complex are reduced and oligomeric Aβ increased with APOE4 and Alzheimer disease in a transgenic mouse model and human samples. J. Biol. Chem. 288, 5914–5926 (2013). source
Split into 2 atoms — 2 confirmed, 0 partially supported, 0 disputed, 0 misattributed, 0 unverifiable. Expand the claim to see per-atom verdicts.
- Partly supportedcites [56] Hashimoto, T. et al. Apolipoprotein E, especially apolipoprotein E4, increases the oligomerization of amyloid β peptide. J. Neurosci. 32, 15181–15192 (2012). sourceExperimental — accuracy not yet measured
Split into 2 atoms — 1 confirmed, 1 partially supported, 0 disputed, 0 misattributed, 0 unverifiable. Expand the claim to see per-atom verdicts.
hedgedcorrelational- Asserted: passes — The authors put it forward as true.
- Checkable: passes — It can be checked against evidence.
- Load-bearing: fails — The paper’s conclusions may not depend on it.
- Based: passes — The paper gives a reason why it holds.
Probably not a substantial claim. The paper’s conclusions may not depend on it. It may state two separate claims as one.
Every source the paper cites for this claim was checked and supports it.
In the paper
“These results are consistent with studies implicating ApoE in plaque compaction and reflect a similar loss of function as seen in Apoe knockout mice, which also feature reductions in plaque-associated microgliosis57.”
§ APOE4 to APOE2 allelic switching in mice improves Alzheimer’s disease-related metabolic signatures, neuropathology and cognition > Discussion
What the sources say
- Supportedcites [57] Ulrich, J. D. et al. ApoE facilitates the microglial response to amyloid plaque pathology. J. Exp. Med. 215, 1047–1058 (2018). source
The Introduction reports that plaques in Apoe-deficient mice were less compact and that plaque-associated microgliosis was significantly reduced. The plaque-morphology and microgliosis results sections report both findings in the knockout mouse models; page numbers were not supplied in our copy. (LLM, conf=0.94)
plaincorrelational- Asserted: passes — The authors put it forward as true.
- Checkable: passes — It can be checked against evidence.
- Load-bearing: unclear — It is unclear whether the paper’s conclusions depend on it.
- Based: passes — The paper gives a reason why it holds.
It may state two separate claims as one.
- Supported
Every source the paper cites for this claim was checked and supports it.
In the paper
“Also in line with these results is a recent study, which showed that plaque-associated ApoE attracts microglia to the plaque and stimulates their activation via a vascular cell adhesion molecule 1-based mechanism58.”
§ APOE4 to APOE2 allelic switching in mice improves Alzheimer’s disease-related metabolic signatures, neuropathology and cognition > Discussion
What the sources say
- Supportedcites [58] Lau, S.-F. et al. The VCAM1–ApoE pathway directs microglial chemotaxis and alleviates Alzheimer’s disease pathology. Nat. Aging 3, 1219–1236 (2023). source
The Results sections on ApoE chemoattraction and VCAM1–ApoE interaction report that plaque-associated ApoE directs VCAM1-dependent microglial migration toward Aβ plaques and is required for their subsequent transition to a phagocytic state. These effects were demonstrated after IL-33 treatment in APP/PS1 mice. (LLM, conf=0.91)
plaindirect- Asserted: passes — The authors put it forward as true.
- Checkable: passes — It can be checked against evidence.
- Load-bearing: fails — The paper’s conclusions may not depend on it.
- Based: passes — The paper gives a reason why it holds.
Probably not a substantial claim. The paper’s conclusions may not depend on it.
- Supported
The sources with a verdict support this claim; the rest weren’t checked yet, have no full text we could read, or their verdicts aren’t rated yet.
In the paper
“Canonical CNS cell type markers were compiled from previous studies66–69.”
§ APOE4 to APOE2 allelic switching in mice improves Alzheimer’s disease-related metabolic signatures, neuropathology and cognition > Methods > scRNA-seq data processing
What the sources say
- Supportedcites [66] McKenzie, A. T. et al. Brain cell type specific gene expression and co-expression network architectures. Sci. Rep. 8, 8868 (2018). source
The Discussion (page unavailable) says the study assembled a collection of brain cell type-specific marker genes and that its most enriched genes include well-known markers. This supports citing it as a previous study from which CNS cell type markers could be compiled; it does not establish what the other cited studies contributed. (LLM, conf=0.88)
- Supportedcites [67] Zeisel, A. et al. Molecular architecture of the mouse nervous system. Cell 174, 999–1014 (2018). source
The Results section on vascular cells identifies canonical markers for a CNS-associated cell type and reports additional distinguishing marker genes. The Discussion states that major nervous-system cell classes are distinguished by class-specific genes. This makes the paper a relevant previous study from which CNS cell-type markers could be compiled; the citing sentence does not attribute the compilation itself to this paper. (LLM, conf=0.88)
- Supportedcites [68] Ximerakis, M. et al. Single-cell transcriptomic profiling of the aging mouse brain. Nat. Neurosci. 22, 1696–1708 (2019). source
The ‘Determination of cell type identity’ section says the authors used cell-specific markers previously described in the literature. The Fig. 1 legend lists representative CNS cell-type markers and cites earlier studies for them. Our copy does not establish which works the citing document numbers 66–69 refer to, but it supports the attributed practice. (LLM, conf=0.93)
- Not checked — no full text of the sourcecites [69] Han, X. et al. Mapping the mouse cell atlas by Microwell-seq. Cell 172, 1091–1107 (2018). source
plain- Asserted: passes — The authors put it forward as true.
- Checkable: passes — It can be checked against evidence.
- Load-bearing: fails — The paper’s conclusions may not depend on it.
- Based: passes — The paper gives a reason why it holds.
Probably not a substantial claim. The paper’s conclusions may not depend on it.
- Supported
A result the paper reports from its own data — it cites no other source for it, so there is none to check. The quote shows it is in the paper.
In the paper
“A similar, albeit more modest, shift toward APOE2 expression was observed in whole-brain tissue, suggesting that most of total brain ApoE is derived from astrocytes, which were now synthesizing E2 (Fig. 4d).”
§ APOE4 to APOE2 allelic switching in mice improves Alzheimer’s disease-related metabolic signatures, neuropathology and cognition > Astrocyte-only switch to E2 drives similar gene expression
hedgedcorrelational- Asserted: passes — The authors put it forward as true.
- Checkable: passes — It can be checked against evidence.
- Load-bearing: passes — The paper’s conclusions depend on it.
- Based: passes — The paper gives a reason why it holds.
It may state two separate claims as one.
A result the paper reports from its own data — it cites no other source for it, so there is none to check. The quote shows it is in the paper.
In the paper
“However, 1 month after TAM, APOE4s2G mice fed a Western diet displayed a substantial increase in very-low-density lipoprotein (VLDL) TGs and plasma ApoE levels, which rose to E2-TR levels (Fig. 2b–e and Extended Data Fig. 2d).”
§ APOE4 to APOE2 allelic switching in mice improves Alzheimer’s disease-related metabolic signatures, neuropathology and cognition > Whole-body switch results in an ‘E2-like’ metabolic profile
plaindirect- Asserted: passes — The authors put it forward as true.
- Checkable: passes — It can be checked against evidence.
- Load-bearing: passes — The paper’s conclusions depend on it.
- Based: passes — The paper gives a reason why it holds.
It may state two separate claims as one.
A result the paper reports from its own data — it cites no other source for it, so there is none to check. The quote shows it is in the paper.
In the paper
“While neurons synthesize ApoE under certain conditions, we observed negligible colocalization of ApoE with NeuN (Extended Data Fig. 2k–o).”
§ APOE4 to APOE2 allelic switching in mice improves Alzheimer’s disease-related metabolic signatures, neuropathology and cognition > Whole-body switch results in an ‘E2-like’ metabolic profile
plain- Asserted: passes — The authors put it forward as true.
- Checkable: passes — It can be checked against evidence.
- Load-bearing: fails — The paper’s conclusions may not depend on it.
- Based: passes — The paper gives a reason why it holds.
Probably not a substantial claim. The paper’s conclusions may not depend on it.
A result the paper reports from its own data — it cites no other source for it, so there is none to check. The quote shows it is in the paper.
In the paper
“Dimensionality reduction identified 41 clusters, which were assigned to one of 12 unique cell types, with cell and cluster proportions similarly distributed across all groups (Fig. 3a and Extended Data Fig. 3).”
§ APOE4 to APOE2 allelic switching in mice improves Alzheimer’s disease-related metabolic signatures, neuropathology and cognition > Full-body switching drives AD-relevant transcriptomic changes
plain- Asserted: passes — The authors put it forward as true.
- Checkable: passes — It can be checked against evidence.
- Load-bearing: unclear — It is unclear whether the paper’s conclusions depend on it.
- Based: passes — The paper gives a reason why it holds.
It may state two separate claims as one.
A result the paper reports from its own data — it cites no other source for it, so there is none to check. The quote shows it is in the paper.
In the paper
“Colocalization of ApoE with cell-specific markers for astrocytes, microglia and neurons showed that like the E2-TR, E4-TR and APOE4s2 controls, ApoE primarily colocalized with astrocytes (glial fibrillary acidic protein (GFAP)+) in APOE4s2G mice, with measurable, but much lower, colocalization with the microglial marker IBA1 (Fig. 2g,h and Extended Data Fig. 2k–o).”
§ APOE4 to APOE2 allelic switching in mice improves Alzheimer’s disease-related metabolic signatures, neuropathology and cognition > Whole-body switch results in an ‘E2-like’ metabolic profile
plaincorrelational- Asserted: passes — The authors put it forward as true.
- Checkable: passes — It can be checked against evidence.
- Load-bearing: unclear — It is unclear whether the paper’s conclusions depend on it.
- Based: passes — The paper gives a reason why it holds.
It may state two separate claims as one.
A result the paper reports from its own data — it cites no other source for it, so there is none to check. The quote shows it is in the paper.
In the paper
“While the Morris water maze did not show striking differences in spatial learning or memory, 4s2A/FAD mice showed improvements in associative learning and more robust contextual and cued memory, an effect that was strongest in females (Fig. 5b–d and Extended Data Fig. 6a–d).”
§ APOE4 to APOE2 allelic switching in mice improves Alzheimer’s disease-related metabolic signatures, neuropathology and cognition > Astrocyte-only E4 to E2 switch decreases amyloid plaque load
plaindirect- Asserted: passes — The authors put it forward as true.
- Checkable: passes — It can be checked against evidence.
- Load-bearing: passes — The paper’s conclusions depend on it.
- Based: passes — The paper gives a reason why it holds.
It may state two separate claims as one.
A result the paper reports from its own data — it cites no other source for it, so there is none to check. The quote shows it is in the paper.
In the paper
“Gene expression and proteomic analyses confirm that APOE4s2 mice synthesize E4 at baseline and E2 after tamoxifen administration.”
- Also stated in: § APOE‘switch’ mice efficiently transition from E4 to E2 · boosted
“Together, these data demonstrate that APOE4s2G mice synthesize human ApoE4 at baseline, and that TAM induces a highly efficient transition to APOE2 and ApoE2 at the gene and protein level.”
§ APOE4 to APOE2 allelic switching in mice improves Alzheimer’s disease-related metabolic signatures, neuropathology and cognition > Abstract
boosteddirect- Asserted: passes — The authors put it forward as true.
- Checkable: passes — It can be checked against evidence.
- Load-bearing: passes — The paper’s conclusions depend on it.
- Based: passes — The paper gives a reason why it holds.
It may state two separate claims as one.
- Also stated in: § APOE‘switch’ mice efficiently transition from E4 to E2 · boosted
A result the paper reports from its own data — it cites no other source for it, so there is none to check. The quote shows it is in the paper.
In the paper
“We then performed a weighted gene coexpression network analysis (WGCNA) on the cerebral lipidome, where we identified five coexpression modules, including one network that was significantly correlated with the E4 to E2 switch (blue module) and consisted primarily of PC and phosphatidylethanolamine (PE) species (Fig. 2k,l).”
§ APOE4 to APOE2 allelic switching in mice improves Alzheimer’s disease-related metabolic signatures, neuropathology and cognition > Whole-body switch results in an ‘E2-like’ metabolic profile
plaincorrelational- Asserted: passes — The authors put it forward as true.
- Checkable: passes — It can be checked against evidence.
- Load-bearing: unclear — It is unclear whether the paper’s conclusions depend on it.
- Based: passes — The paper gives a reason why it holds.
It may state two separate claims as one.
A result the paper reports from its own data — it cites no other source for it, so there is none to check. The quote shows it is in the paper.
In the paper
“plaque proximity analyses showed more pronounced decreases in GFAP and IBA1 in 4s2A/FAD mice when close to the plaque center, with distribution of the GFAP+ and IBA1+ signal becoming more similar to controls as the distance from the center increased (Fig. 6j–m and Extended Data Fig. 8h–k).”
§ APOE4 to APOE2 allelic switching in mice improves Alzheimer’s disease-related metabolic signatures, neuropathology and cognition > Astrocyte E4 to E2 replacement lowers plaque-associated gliosis
plaincorrelational- Asserted: passes — The authors put it forward as true.
- Checkable: passes — It can be checked against evidence.
- Load-bearing: passes — The paper’s conclusions depend on it.
- Based: passes — The paper gives a reason why it holds.
It may state two separate claims as one.
A result the paper reports from its own data — it cites no other source for it, so there is none to check. The quote shows it is in the paper.
In the paper
“APOE4s2G mice, in which all cell types transition from APOE4 to APOE2, reliably phenocopy the humanized E4-TR mice before the switch and E2-TR mice within 1 month after the switch.”
§ APOE4 to APOE2 allelic switching in mice improves Alzheimer’s disease-related metabolic signatures, neuropathology and cognition > Discussion
plaincorrelational- Asserted: passes — The authors put it forward as true.
- Checkable: passes — It can be checked against evidence.
- Load-bearing: passes — The paper’s conclusions depend on it.
- Based: passes — The paper gives a reason why it holds.
It may state two separate claims as one.
A result the paper reports from its own data — it cites no other source for it, so there is none to check. The quote shows it is in the paper.
In the paper
“We did note subtle sex differences in the expression of the postsynaptic density marker PSD95 in the cortex, although this was limited to plaque-distal regions and was not seen in the hippocampus (Extended Data Fig. 7i–m).”
§ APOE4 to APOE2 allelic switching in mice improves Alzheimer’s disease-related metabolic signatures, neuropathology and cognition > Astrocyte-only E4 to E2 switch decreases amyloid plaque load
plain- Asserted: passes — The authors put it forward as true.
- Checkable: passes — It can be checked against evidence.
- Load-bearing: fails — The paper’s conclusions may not depend on it.
- Based: passes — The paper gives a reason why it holds.
Probably not a substantial claim. The paper’s conclusions may not depend on it. It may state two separate claims as one.
A result the paper reports from its own data — it cites no other source for it, so there is none to check. The quote shows it is in the paper.
In the paper
“Strikingly, we show that a 2-month-long astrocyte-specific E4 to E2 switch after pathology onset is sufficient to decrease plaque load, reduce markers of glial reactivity and improve associative, but not spatial, memory in the 5xFAD model.”
§ APOE4 to APOE2 allelic switching in mice improves Alzheimer’s disease-related metabolic signatures, neuropathology and cognition > Discussion
boosteddirect- Asserted: passes — The authors put it forward as true.
- Checkable: passes — It can be checked against evidence.
- Load-bearing: passes — The paper’s conclusions depend on it.
- Based: passes — The paper gives a reason why it holds.
It may state two separate claims as one.
- Rests on an assumption: The 5xFAD model is an amyloidosis model of Alzheimer's disease.
A result the paper reports from its own data — it cites no other source for it, so there is none to check. The quote shows it is in the paper.
In the paper
“Several measures were significantly correlated but, paradoxically, positively correlated in 4s2/FAD mice yet negatively correlated in 4s2A/FAD mice (Fig. 7k).”
§ APOE4 to APOE2 allelic switching in mice improves Alzheimer’s disease-related metabolic signatures, neuropathology and cognition > E4 to E2 switch reduces reactive microglia and plaque ApoE
plaincorrelational- Asserted: passes — The authors put it forward as true.
- Checkable: passes — It can be checked against evidence.
- Load-bearing: unclear — It is unclear whether the paper’s conclusions depend on it.
- Based: passes — The paper gives a reason why it holds.
It may state two separate claims as one.
A result the paper reports from its own data — it cites no other source for it, so there is none to check. The quote shows it is in the paper.
In the paper
“While higher amyloid plaque loads were observed in female compared to male 4s2/FAD Cre− controls, we did not detect any other amyloid-dependent sex differences, nor was this difference reflected in the soluble and insoluble Aβ42 and Aβ40 measures (Extended Data Fig. 7e–h).”
§ APOE4 to APOE2 allelic switching in mice improves Alzheimer’s disease-related metabolic signatures, neuropathology and cognition > Astrocyte-only E4 to E2 switch decreases amyloid plaque load
plain- Asserted: passes — The authors put it forward as true.
- Checkable: passes — It can be checked against evidence.
- Load-bearing: unclear — It is unclear whether the paper’s conclusions depend on it.
- Based: passes — The paper gives a reason why it holds.
It may state two separate claims as one.
A result the paper reports from its own data — it cites no other source for it, so there is none to check. The quote shows it is in the paper.
In the paper
“We characterize how a global E4 to E2 replacement drives peripheral metabolic changes and AD-relevant alterations in the cerebral transcriptome and lipidome.”
§ APOE4 to APOE2 allelic switching in mice improves Alzheimer’s disease-related metabolic signatures, neuropathology and cognition > Discussion
plaindirect- Asserted: passes — The authors put it forward as true.
- Checkable: passes — It can be checked against evidence.
- Load-bearing: passes — The paper’s conclusions depend on it.
- Based: passes — The paper gives a reason why it holds.
It may state two separate claims as one.
A result the paper reports from its own data — it cites no other source for it, so there is none to check. The quote shows it is in the paper.
In the paper
“Forty-five clusters were identified.”
§ APOE4 to APOE2 allelic switching in mice improves Alzheimer’s disease-related metabolic signatures, neuropathology and cognition > Methods > scRNA-seq data processing
plain- Asserted: passes — The authors put it forward as true.
- Checkable: passes — It can be checked against evidence.
- Load-bearing: fails — The paper’s conclusions may not depend on it.
- Based: passes — The paper gives a reason why it holds.
Probably not a substantial claim. The paper’s conclusions may not depend on it.
What the paper did — it cites no source for this, so there is none to check. The quote shows it is in the paper.
In the paper
“Leveraging the Ai9 cross, we then used cell sorting and qPCR to validate the high efficiency and cell specificity of the astrocyte-specific E4 to E2 switch (Fig. 4c).”
§ APOE4 to APOE2 allelic switching in mice improves Alzheimer’s disease-related metabolic signatures, neuropathology and cognition > Astrocyte-only switch to E2 drives similar gene expression
plain- Asserted: passes — The authors put it forward as true.
- Checkable: passes — It can be checked against evidence.
- Load-bearing: passes — The paper’s conclusions depend on it.
- Based: passes — The paper gives a reason why it holds.
It may state two separate claims as one.
A conclusion the paper draws from its own results — it cites no other source for it, so there is none to check. The quote shows it is in the paper.
In the paper
“Considering the potential translational concerns associated with germline, whole-body APOE editing, we reasoned that a central nervous system (CNS)-selective APOE4 to APOE2 switch could afford the neuroprotection of E2 while minimizing off-target effects.”
§ APOE4 to APOE2 allelic switching in mice improves Alzheimer’s disease-related metabolic signatures, neuropathology and cognition > Astrocyte-only switch to E2 drives similar gene expression
hedgedconditional- Asserted: passes — The authors put it forward as true.
- Checkable: passes — It can be checked against evidence.
- Load-bearing: passes — The paper’s conclusions depend on it.
- Based: passes — The paper gives a reason why it holds.
Probably not a substantial claim.
A conclusion the paper draws from its own results — it cites no other source for it, so there is none to check. The quote shows it is in the paper.
In the paper
“Taken together, these results suggest that astrocyte-selective expression of ApoE2 leads to downstream reductions in microglial activation and lower levels of plaque-associated ApoE”
§ APOE4 to APOE2 allelic switching in mice improves Alzheimer’s disease-related metabolic signatures, neuropathology and cognition > E4 to E2 switch reduces reactive microglia and plaque ApoE
hedgeddirect- Asserted: passes — The authors put it forward as true.
- Checkable: passes — It can be checked against evidence.
- Load-bearing: passes — The paper’s conclusions depend on it.
- Based: passes — The paper gives a reason why it holds.
It may state two separate claims as one.
A conclusion the paper draws from its own results — it cites no other source for it, so there is none to check. The quote shows it is in the paper.
In the paper
“These findings underscore the dynamic and reversible nature of APOE’s contribution to AD pathology”
§ APOE4 to APOE2 allelic switching in mice improves Alzheimer’s disease-related metabolic signatures, neuropathology and cognition > Discussion
plaindirect- Asserted: passes — The authors put it forward as true.
- Checkable: passes — It can be checked against evidence.
- Load-bearing: passes — The paper’s conclusions depend on it.
- Based: passes — The paper gives a reason why it holds.
It may state two separate claims as one.
A conclusion the paper draws from its own results — it cites no other source for it, so there is none to check. The quote shows it is in the paper.
In the paper
“Together, these results suggest that a relatively late-stage switch to astrocytic expression of E2 is sufficient to substantially lower parenchymal plaque burden, but not CAA, and improve some, but not all, of the cognitive deficits associated with E4.”
§ APOE4 to APOE2 allelic switching in mice improves Alzheimer’s disease-related metabolic signatures, neuropathology and cognition > Astrocyte-only E4 to E2 switch decreases amyloid plaque load
hedgeddirect- Asserted: passes — The authors put it forward as true.
- Checkable: passes — It can be checked against evidence.
- Load-bearing: passes — The paper’s conclusions depend on it.
- Based: passes — The paper gives a reason why it holds.
It may state two separate claims as one.
- Rests on an assumption: The 5xFAD mouse model recapitulates key aspects of human AD pathology relevant to APOE.
What the paper did — it cites no source for this, so there is none to check. The quote shows it is in the paper.
In the paper
“Four mixed clusters with high hemoglobin were removed along with several clusters with pituitary contamination (high expression of Gh, Prl and Lhx3).”
§ APOE4 to APOE2 allelic switching in mice improves Alzheimer’s disease-related metabolic signatures, neuropathology and cognition > Methods > scRNA-seq data processing
plain- Asserted: passes — The authors put it forward as true.
- Checkable: passes — It can be checked against evidence.
- Load-bearing: fails — The paper’s conclusions may not depend on it.
- Based: passes — The paper gives a reason why it holds.
Probably not a substantial claim. The paper’s conclusions may not depend on it. It may state two separate claims as one.
What the paper did — it cites no source for this, so there is none to check. The quote shows it is in the paper.
In the paper
“Cell viability was checked using the Acridine Orange/Propidium Iodide viability kit (cat. no. LGBD10012, Logos Biosystems).”
- Also stated in: § Fluorescence-activated cell sorting · plain
“Cell viability was checked using the Acridine Orange/Propidium Iodide viability kit.”
§ APOE4 to APOE2 allelic switching in mice improves Alzheimer’s disease-related metabolic signatures, neuropathology and cognition > Methods > Brain single-cell suspension, cDNA library and sequencing
plain- Asserted: passes — The authors put it forward as true.
- Checkable: passes — It can be checked against evidence.
- Load-bearing: fails — The paper’s conclusions may not depend on it.
- Based: passes — The paper gives a reason why it holds.
Probably not a substantial claim. The paper’s conclusions may not depend on it.
- Also stated in: § Fluorescence-activated cell sorting · plain
What the paper did — it cites no source for this, so there is none to check. The quote shows it is in the paper.
In the paper
“Feature counts were normalized using sctransform and the effects of percent.mito were regressed out.”
§ APOE4 to APOE2 allelic switching in mice improves Alzheimer’s disease-related metabolic signatures, neuropathology and cognition > Methods > scRNA-seq data processing
plain- Asserted: passes — The authors put it forward as true.
- Checkable: passes — It can be checked against evidence.
- Load-bearing: fails — The paper’s conclusions may not depend on it.
- Based: passes — The paper gives a reason why it holds.
Probably not a substantial claim. The paper’s conclusions may not depend on it. It may state two separate claims as one.
What the paper did — it cites no source for this, so there is none to check. The quote shows it is in the paper.
In the paper
“Cells were then filtered to reduce the potential of including low-quality cells with the following criteria: 200 < nGene < 2000; 200 < nCount; and percent.mito <20%.”
§ APOE4 to APOE2 allelic switching in mice improves Alzheimer’s disease-related metabolic signatures, neuropathology and cognition > Methods > scRNA-seq data processing
plain- Asserted: passes — The authors put it forward as true.
- Checkable: passes — It can be checked against evidence.
- Load-bearing: fails — The paper’s conclusions may not depend on it.
- Based: passes — The paper gives a reason why it holds.
Probably not a substantial claim. The paper’s conclusions may not depend on it.
What the paper did — it cites no source for this, so there is none to check. The quote shows it is in the paper.
In the paper
“Final library quantification and quality checking were performed using a Bioanalyzer instrument (Agilent Technologies); 150-bp paired-end sequencing (Novogene) was performed on a NovaSeq 6000 S4 flow cell.”
§ APOE4 to APOE2 allelic switching in mice improves Alzheimer’s disease-related metabolic signatures, neuropathology and cognition > Methods > Brain single-cell suspension, cDNA library and sequencing
plain- Asserted: passes — The authors put it forward as true.
- Checkable: passes — It can be checked against evidence.
- Load-bearing: fails — The paper’s conclusions may not depend on it.
- Based: passes — The paper gives a reason why it holds.
Probably not a substantial claim. The paper’s conclusions may not depend on it.
What the paper did — it cites no source for this, so there is none to check. The quote shows it is in the paper.
In the paper
“This process resulted in stringent filtering of cells with ambiguous assignments, leaving a total of 85,701 cells in 41 carefully assigned clusters.”
§ APOE4 to APOE2 allelic switching in mice improves Alzheimer’s disease-related metabolic signatures, neuropathology and cognition > Methods > scRNA-seq data processing
plaindirect- Asserted: passes — The authors put it forward as true.
- Checkable: passes — It can be checked against evidence.
- Load-bearing: fails — The paper’s conclusions may not depend on it.
- Based: passes — The paper gives a reason why it holds.
Probably not a substantial claim. The paper’s conclusions may not depend on it.
What the paper did — it cites no source for this, so there is none to check. The quote shows it is in the paper.
In the paper
“Doublets were removed using the scDblFinder package.”
§ APOE4 to APOE2 allelic switching in mice improves Alzheimer’s disease-related metabolic signatures, neuropathology and cognition > Methods > scRNA-seq data processing
plain- Asserted: passes — The authors put it forward as true.
- Checkable: passes — It can be checked against evidence.
- Load-bearing: fails — The paper’s conclusions may not depend on it.
- Based: passes — The paper gives a reason why it holds.
Probably not a substantial claim. The paper’s conclusions may not depend on it.
What the paper did — it cites no source for this, so there is none to check. The quote shows it is in the paper.
In the paper
“Ambient RNA contamination was removed using the SoupX R package.”
§ APOE4 to APOE2 allelic switching in mice improves Alzheimer’s disease-related metabolic signatures, neuropathology and cognition > Methods > scRNA-seq data processing
plain- Asserted: passes — The authors put it forward as true.
- Checkable: passes — It can be checked against evidence.
- Load-bearing: fails — The paper’s conclusions may not depend on it.
- Based: passes — The paper gives a reason why it holds.
Probably not a substantial claim. The paper’s conclusions may not depend on it.
What the paper did — it cites no source for this, so there is none to check. The quote shows it is in the paper.
In the paper
“However, the location in which mice were dropped into the pool differed for each session between the four quadrants to avoid procedural bias in task learning.”
§ APOE4 to APOE2 allelic switching in mice improves Alzheimer’s disease-related metabolic signatures, neuropathology and cognition > Methods > Behavioral assessments
plaindirect- Asserted: passes — The authors put it forward as true.
- Checkable: passes — It can be checked against evidence.
- Load-bearing: fails — The paper’s conclusions may not depend on it.
- Based: passes — The paper gives a reason why it holds.
Probably not a substantial claim. The paper’s conclusions may not depend on it.
The paper relies on this without support.
The APOE4s2 mouse model faithfully recapitulates human APOE allelic switching and its effects.
“To generate a preclinical model in which we could investigate the feasibility and therapeutic potential of a full APOE4 to APOE2 transition in vivo, we developed a knock-in model coined the APOE ‘switch’ mouse (APOE4s2).”
The paper relies on this without support.
Findings in APOE4s2 mice will translate to human APOE4 carriers.
“Together, these data show that a short-term transition from APOE4 to APOE2 can broadly affect the cerebral transcriptome and lipidome, and that astrocyte-specific APOE replacement may be a viable strategy for future gene editing approaches to simultaneously reduce multiple AD-associated pathologies.”
The paper relies on this without support.
The 5xFAD mouse model recapitulates key aspects of human AD pathology relevant to APOE.
“To this end, we crossed APOE4s2A mice to the 5xFAD model of AD (4s2A/FAD) and administered TAM at 6 months of age.”
The paper relies on this without support.
Overlap of mouse DEGs with human AD gene lists indicates AD relevance.
“Finally, the DEGs associated with the E4 to E2 switch also strongly reflected several APOE-associated and AD-associated gene lists, particularly the late-onset AD (LOAD) genes identified in and merged from publicly available human transcriptomic datasets (Fig. 3i)25–28.”
The paper relies on this without support.
APOE4 is a high-risk allele and APOE2 is protective for Alzheimer's disease.
“replacement of the high-risk APOE4 allele with the protective APOE2 variant”
The paper relies on this without support.
The insoluble brain fraction corresponds to plaque-associated ApoE.
“significant reductions of ApoE within the insoluble (plaque-associated) brain fractions”
The paper relies on this without support.
LPCs are pro-inflammatory lipids that act as ‘find me’ signals for myeloid cells.
“a class of pro-inflammatory lipids that act as ‘find me’ signals for myeloid cells.”
The paper relies on this without support.
Aldh1l1-CreERT2 is highly selective for astrocytes in the CNS.
“Aldh1l1-CreERT2 is highly selective for astrocytes in the CNS”
The paper relies on this without support.
The 5xFAD model is an amyloidosis model of Alzheimer's disease.
“improves cognitive outcomes in an amyloidosis model of AD”
Claims other papers make about this one
Each is checked against this paper’s own text: does it say what the citing paper says it does?
The source backs part of the claim, not all of it — or backs it for a different population, condition or comparison.
In the citing paper
“Previous studies using homozygous APOE knock-in mice have been essential for de fi ning isoform-speci fi c effects of APOE2 , APOE3 , and APOE4”
From APOE2 attenuates APOE4-associated amyloid pathology and related toxicity in a mouse model of Alzheimer’s disease (2026) · cites this paper as [7]
Experimental — accuracy not yet measuredThe source backs part of the claim, not all of it — or backs it for a different population, condition or comparison.
In the citing paper
“Using our novel APOE “switch” model that allows for the inducible and cell-specific replacement of E4 with E2”
From Older adult APOE4 mice exhibit modest immunometabolic adaptation following microglial APOE2 replacement (2027) · cites this paper as Golden et al., 2025
Experimental — accuracy not yet measuredThe source backs part of the claim, not all of it — or backs it for a different population, condition or comparison.
In the citing paper
“We generated APOE4s2flox/flox xTmem119-CreERT2 APOE switch mice (4s2M) that would express APOE4 in all cell types except microglia, which would selectively transition to APOE2 expression upon tamoxifen injection”
From Older adult APOE4 mice exhibit modest immunometabolic adaptation following microglial APOE2 replacement (2027) · cites this paper as Golden et al., 2025
Experimental — accuracy not yet measuredThe cited source says what the claim attributes to it.
In the citing paper
“while viral APOE2 delivery, APOE2 gene therapy, and inducible APOE4 to APOE2 switching have demonstrated that increasing APOE2 expression or replacing APOE4 with APOE2 can ameliorate AD-related phenotypes 7,8,33,34 .”
From APOE2 attenuates APOE4-associated amyloid pathology and related toxicity in a mouse model of Alzheimer’s disease (2026) · cites this paper as [7]
The cited source says what the claim attributes to it.
In the citing paper
“Notably, a recent inducible APOE4 to APOE2 allelic switching model showed that converting APOE4 to APOE2 in adult mice, particularly in astrocytes, reduces amyloid pathology and gliosis and improves cognitive outcomes on the 5xFAD background 7 .”
From APOE2 attenuates APOE4-associated amyloid pathology and related toxicity in a mouse model of Alzheimer’s disease (2026) · cites this paper as [7]
Self-check
Percentages, sums and reported differences re-computed from the paper’s own numbers.
Each contradiction between two passages listed here was confirmed by an independent check.
Rated major: it would touch a result — a value a result rests on, reported and recomputed p-values on opposite sides of the significance level, two passages that conflict with no sign which is right, or a cited work retracted before this paper was published.
In the paper
§ APOE4 to APOE2 allelic switching in mice improves Alzheimer’s disease-related metabolic signatures, neuropathology and cognition > Astrocyte-only switch to E2 drives similar gene expression
“APOE4s2A, n = 3; APOE4s2, n = 3”
§ APOE4 to APOE2 allelic switching in mice improves Alzheimer’s disease-related metabolic signatures, neuropathology and cognition > Methods > Brain single-cell suspension, cDNA library and sequencing
“n = 3 APOE4s2G, n = 3 APOE4s2A, n = 1 APOE4s2, n = 2 E2-TR and n = 1 E4-TR”
Rated major: it would touch a result — a value a result rests on, reported and recomputed p-values on opposite sides of the significance level, two passages that conflict with no sign which is right, or a cited work retracted before this paper was published.
In the paper
§ APOE4 to APOE2 allelic switching in mice improves Alzheimer’s disease-related metabolic signatures, neuropathology and cognition > Full-body switching drives AD-relevant transcriptomic changes
“APOE4s2G, n = 3; APOE4s2, n = 3; E2-TR, n = 3, E4-TR, n = 2; all females”
§ APOE4 to APOE2 allelic switching in mice improves Alzheimer’s disease-related metabolic signatures, neuropathology and cognition > Methods > Brain single-cell suspension, cDNA library and sequencing
“n = 3 APOE4s2G, n = 3 APOE4s2A, n = 1 APOE4s2, n = 2 E2-TR and n = 1 E4-TR”
Rated minor: it would not touch a result — a value no result rests on, a p-value that stays on the same side of the significance level, or a conflict that is clerical, resolved elsewhere in the paper, or outside its own findings.
In the paper
§ APOE4 to APOE2 allelic switching in mice improves Alzheimer’s disease-related metabolic signatures, neuropathology and cognition > APOE‘switch’ mice efficiently transition from E4 to E2
“e,f, Ratio of unique E2 versus E4 peptides detected using LC–MS/MS-based proteomic analysis showing an efficient transition to E2 in both the brain (f) and plasma (g)”
§ APOE4 to APOE2 allelic switching in mice improves Alzheimer’s disease-related metabolic signatures, neuropathology and cognition > APOE‘switch’ mice efficiently transition from E4 to E2
“Targeted mass spectrometry (MS)-based proteomic analysis confirmed the E4 to E2 transition at the protein level, where 84–93% and 92–99% of the ApoE peptides detected in the brain and plasma respectively from APOE4s2G mice were unique to E2 (Fig. 1e,f, Extended Data Fig. 1).”
Rated minor: it would not touch a result — a value no result rests on, a p-value that stays on the same side of the significance level, or a conflict that is clerical, resolved elsewhere in the paper, or outside its own findings.
In the paper
§ APOE4 to APOE2 allelic switching in mice improves Alzheimer’s disease-related metabolic signatures, neuropathology and cognition > Whole-body switch results in an ‘E2-like’ metabolic profile
“c, TGs in each lipoprotein fraction after switching (E2-TR, n = 3 pooled; E4-TR, n = 3 pooled; APOE4s2, n = 3 pooled; APOE4s2G, n = 3 pooled).”
§ APOE4 to APOE2 allelic switching in mice improves Alzheimer’s disease-related metabolic signatures, neuropathology and cognition > Methods > Plasma lipid quantification
“Plasma samples were pooled to a final volume of 100 μl (n = 4 per group)”
Citations
Cites
A Unique Microglia Type Associated with Restricting Development of Alzheimer’s Disease
Keren-Shaul, H., Spinrad, A., Weiner, A., Matcovitch-Natan, O., Dvir-Szternfeld, R., Ulland, T. K., David, E., Baruch, K., Lara-Astaiso, D., Toth, B., et al. (2017) · Cell · doi:10.1016/j.cell.2017.05.018 · Cited by 5,493 · cited 1×
“3i) 25–28 .”
Molecular Architecture of the Mouse Nervous System
Zeisel, A., Hochgerner, H., Lönnerberg, P., Johnsson, A., Memic, F., van der Zwan, J., Häring, M., Braun, E., Borm, L. E., La Manno, G., et al. (2018) · Cell · doi:10.1016/j.cell.2018.06.021 · Cited by 2,552
Protective effect of apolipoprotein E type 2 allele for late onset Alzheimer disease
Corder, E. H., Saunders, A. M., Risch, N. J., Strittmatter, W. J., Schmechel, D. E., Gaskell, P. C., Rimmler, J. B., Locke, P. A., Conneally, P. M., Schmader, K. E., et al. (1994) · Nature Genetics · doi:10.1038/ng0694-180 · Cited by 1,920
Mapping the Mouse Cell Atlas by Microwell-Seq
Han, X., Wang, R., Zhou, Y., Fei, L., Sun, H., Lai, S., Saadatpour, A., Zhou, Z., Chen, H., Ye, F., et al. (2018) · Cell · doi:10.1016/j.cell.2018.02.001 · Cited by 1,597
Strittmatter, W. J., Weisgraber, K. H., Huang, D. Y., Dong, L. M., Salvesen, G. S., Pericak-Vance, M., Schmechel, D., Saunders, A. M., Goldgaber, D., & Roses, A. D. (1993) · Proceedings of the National Academy of Sciences · doi:10.1073/pnas.90.17.8098 · Cited by 1,363
Signaling through phosphatidylcholine breakdown.
Exton, J. H. (1990) · Journal of Biological Chemistry · doi:10.1016/s0021-9258(19)40184-1 · Cited by 1,358
Human ApoE isoforms differentially regulate brain amyloid-β peptide clearance
Castellano, J. M., Kim, J., Stewart, F. R., Jiang, H., DeMattos, R. B., Patterson, B. W., Fagan, A. M., Morris, J. C., Mawuenyega, K. G., Cruchaga, C., et al. (2011) · Science Translational Medicine · doi:10.1126/scitranslmed.3002156 · Cited by 1,242 · cited 12×
“Additionally, microglia cluster around Aβ deposits in CAA 49 .”
InfluentialLin, Y.-T., Seo, J., Gao, F., Feldman, H. M., Wen, H.-L., Penney, J., Cam, H. P., Gjoneska, E., Raja, W. K., Cheng, J., et al. (2018) · Neuron · doi:10.1016/j.neuron.2018.05.008 · Cited by 1,125
Disease-associated astrocytes in Alzheimer’s disease and aging
Habib, N., McCabe, C., Medina, S., Varshavsky, M., Kitsberg, D., Dvir-Szternfeld, R., Green, G., Dionne, D., Nguyen, L., Marshall, J. L., et al. (2020) · Nature Neuroscience · doi:10.1038/s41593-020-0624-8 · Cited by 1,009
Sala Frigerio, C., Wolfs, L., Fattorelli, N., Thrupp, N., Voytyuk, I., Schmidt, I., Mancuso, R., Chen, W.-T., Woodbury, M. E., Srivastava, G., et al. (2019) · Cell Reports · doi:10.1016/j.celrep.2019.03.099 · Cited by 926
Cited by
Sorted by citations
Lifestyle-associated blood metabolic pathways and functional performance in cognitive aging
Chen, Y., Gui, H., Ma, K., Zhang, Z., Zhao, T., & Wang, M. (2026) · Scientific Reports · doi:10.1038/s41598-026-58782-7 · Cited by 12
Delivanoglou, N., Todd, K. T., Almeida, F., Rego, S., Changavi, A., Spajer, M., Ayuso, V. E., Pinho-Correia, L. M., Sánchez, G., das Neves, S. P., et al. (2026) · Neuron · doi:10.1016/j.neuron.2026.02.030 · Cited by 5
Cerebral amyloid angiopathy and Alzheimer's and related pathologies across APOE genotypes
Mehta, R. I., Wang, T., Leurgans, S. E., Bennett, D. A. A., & Schneider, J. A. (2026) · Brain · doi:10.1093/brain/awag025 · Cited by 3
Amyloid-β clearance: an astrocytic perspective
Li, J., Lv, Z., Chen, X. P., Fu, F., Yang, K., Lai, G., Wu, H., & Xie, G. (2026) · Frontiers in Neuroscience · doi:10.3389/fnins.2026.1812081 · Cited by 3
ApoE expression across the CNS: Who, What, Where, When, and How (much)?
Nolt, G. L., Lucido, C. C., Smith, L. M., & Johnson, L. A. (2026) · Molecular Neurodegeneration Advances · doi:10.1186/s44477-026-00028-x · Cited by 2
Self-citation
Metadata
- Authors
- Golden, L. R., Siano, D. S., Stephens, I. O., MacLean, S. M., Saito, K., Nolt, G. L., Funnell, J. L., Pallerla, A. V., Lee, S., Smith, C., Chen, J., Zhu, H., Voy, C., Whitus, C. M., Hernandez, G., Farmer, B. C., Pandya, K., Cowley, D. O., Macauley, S. L., Gordon, S. M., Morganti, J. M., & Johnson, L. A.
- Affiliations
- University of Kentucky (US)
- University of Arizona (US)
- University of North Carolina at Chapel Hill (US)
- Corresponding author
- Johnson, Lance A.
- ORCID
- Venue
- Nature Neuroscience
- Published
- 2025-11-11
- Volume
- 28
- Issue
- 12
- Pages
- 2461-2475
- ISSN
- 1097-6256 (ISSN-L)
- 1546-1726
- PMC
- PMC12672373
- OpenAlex
- W4416102807
- Semantic Scholar
- f7eb38aa3b6a5194fcf83c646d4927cac964670e
- Cited by
- 18
- References
- 69
- Citations by year
- 2026: 17 · 2025: 1
- FWCI
- 9.87
- Type
- journal article
- Language
- en
- Open access
- hybrid
- doi.org
- Licence
- Locations
- Nature Neuroscience (publishedVersion, cc-by-nc-nd)
- PubMed (publishedVersion)
- UKnowledge (University of Kentucky) (submittedVersion)
- Funders
- U.S. Department of Health & Human Services | NIH | National Institute on Aging (R01AG081421)
- U.S. Department of Health & Human Services | NIH | National Institute of General Medical Sciences (P20 GM148326)
- Alzheimer's Association
- Topics
- Life Sciences › Neuroscience › Cellular and Molecular Neuroscience › Alzheimer's disease research and treatments
- Life Sciences › Neuroscience › Neurology › Neuroinflammation and Neurodegeneration Mechanisms
- Health Sciences › Medicine › Psychiatry and Mental health › Dementia and Cognitive Impairment Research
- Keywords
- apolipoprotein E, APOE ε4, APOE2, Alzheimer's disease, knock-in mice, astrocytes, lipidome, amyloid pathology, gliosis, cognitive function, genome editing
- MeSH terms
- Alleles, Alzheimer Disease, Animals, Astrocytes, Brain, Cognition, Disease Models, Animal, Female, Humans, Male, Mice, Inbred C57BL, Mice, Transgenic, Mice, Apolipoprotein E4, Apolipoprotein E2, Gene Knock-In Techniques, Transcriptome
About these checks
Registry, retraction, Cites and statistics results are computed, not judged, with one exception: a printed reference that no index lists is read once by a model before it counts as a citation error. Claims are extracted by a model and kept only when their quote appears verbatim in the text; each cited source is then checked, with a model’s help, for whether it says what the claim relies on. Those verdicts can be wrong — read the claim’s quote and the cited source before relying on one.
A language model drew the claims from the paper on 2026-10-11, under version 3 of the claim definition (model deepseek-v4.1-flash, prompt extract-v3).
A second model labelled each claim on 2026-10-11 (model jev-1.13-20260917, definition revision gold-guideline-v0.2).
Cited sources are checked with a language model’s help (gpt-6-sol).
Statistics and arithmetic are recomputed, not judged.
Confidence bands are shown only for fields calibrated on our annotated test set. None is calibrated yet, so no band is shown.
What counts as a claim ›How we measure confidence ›How we check this ›
Are you an author, or do you see a problem with this page? Request a review
