

The DOI matches its Crossref record; 2 of the 2 references it cites were found in a registry or an index.
The saliva microbiome profiles are minimally affected by collection method or DNA extraction protocols
Abstract
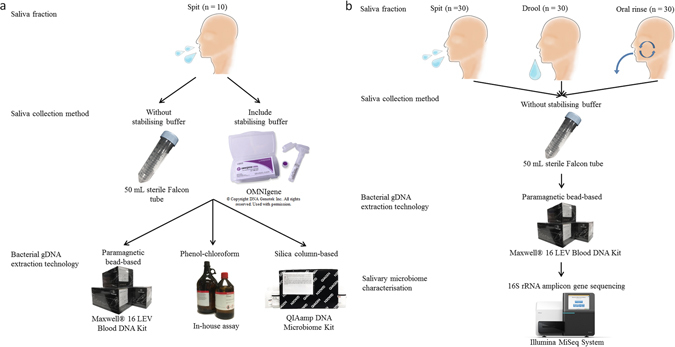
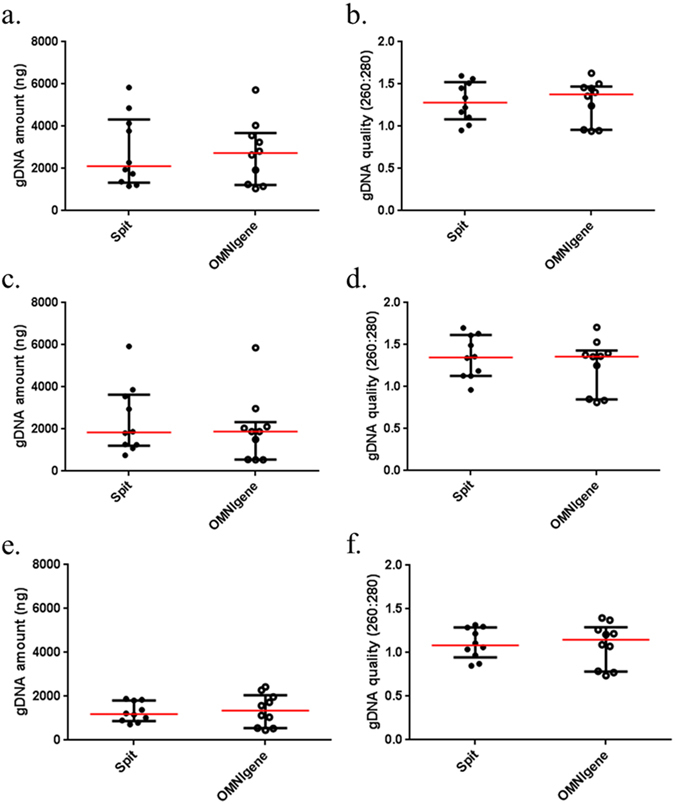
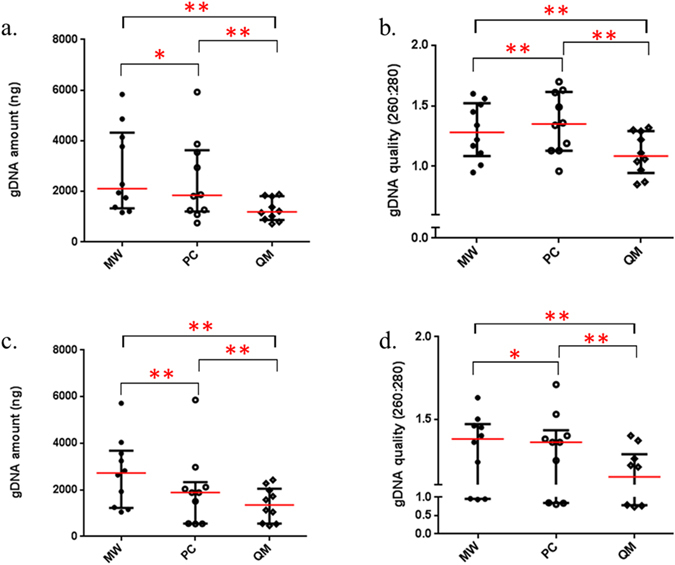
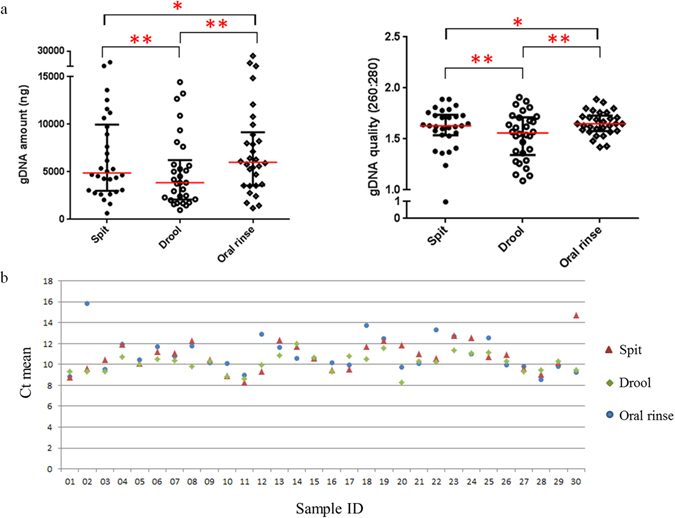
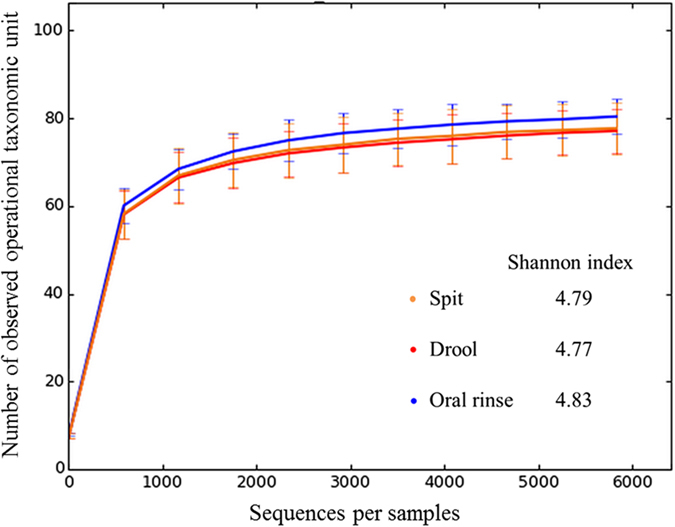
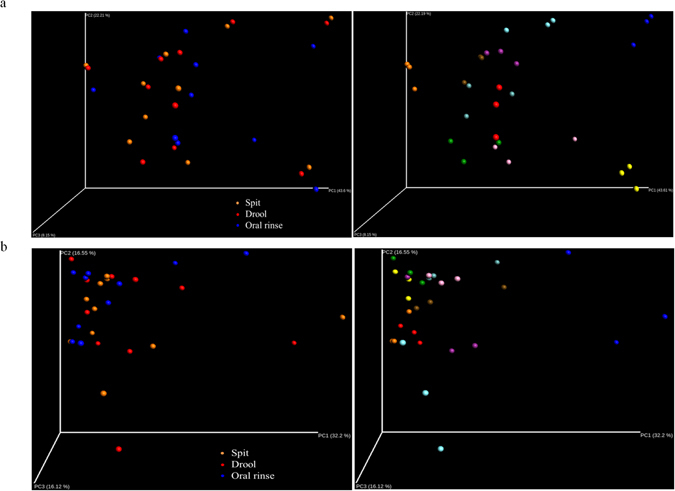
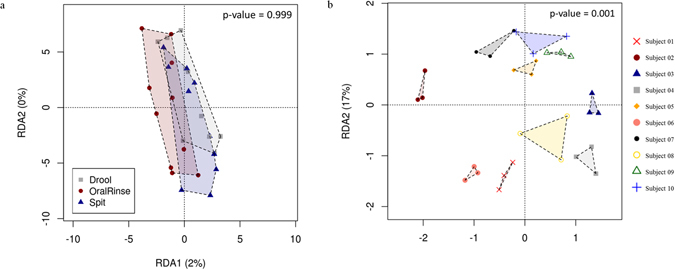
Saliva has attracted attention as a diagnostic fluid due to the association of oral microbiota with systemic diseases. However, the lack of standardised methods for saliva collection has led to the slow uptake of saliva in microbiome research. The aim of this study was to systematically evaluate the potential effects on salivary microbiome profiles using different methods of saliva collection, storage and gDNA extraction. Three types of saliva fractions were collected from healthy individuals with or without the gDNA stabilising buffer. Subsequently, three types of gDNA extraction methods were evaluated to determine the gDNA extraction efficiencies from saliva samples. The purity of total bacterial gDNA was evaluated using the ratio of human β-globin to bacterial 16S rRNA PCR while 16S rRNA gene amplicon sequencing was carried out to identify the bacterial profiles present in these samples. The quantity and quality of extracted gDNA were similar among all three gDNA extraction methods and there were no statistically significant differences in the bacterial profiles among different saliva fractions at the genus-level of taxonomic classification. In conclusion, saliva sampling, processing and gDNA preparation do not have major influence on microbiome profiles.
Overview
The claims and statistics of this paper haven’t been checked yet.
Run the check — free, no account needed. It reads the open-access text and checks the sources it cites.
Integrity signals
Registry
Cites
Statistics
Figures
Verification
Claims the paper makes
The claims and statistics of this paper haven’t been checked yet.
Run the check — free, no account needed. It reads the open-access text and checks the sources it cites.
Claims other papers make about this one
Each is checked against this paper’s own text: does it say what the citing paper says it does?
In the citing paper
“Saliva samples were collected using a mouth wash and using a protocol that had been previously tested and compared with other procedures during a pilot phase of the project. Of note, this procedure is used in other oral microbiome studies and have been shown to produce consistent results with other sampling procedures [51].”
From Citizen science charts two major “stomatotypes” in the oral microbiome of adolescents and reveals links with habits and drinking water composition (2018) · cites this paper as [51]
Self-check
Percentages, sums and reported differences re-computed from the paper’s own numbers.
The self-check needs the paper’s full text.
Citations
Cites
Dewhirst, F. E., Chen, T., Izard, J., Paster, B. J., Tanner, A. C. R., Yu, W.-H., Lakshmanan, A., & Wade, W. G. (2010) · Journal of Bacteriology · doi:10.1128/jb.00542-10 · Cited by 3,352
Clinical and diagnostic utility of saliva as a non-invasive diagnostic fluid: a systematic review
Soares Nunes, L. A., Mussavira, S., & Sukumaran Bindhu, O. (2015) · Biochemia Medica · doi:10.11613/bm.2015.018 · Cited by 333
Research works printed but not linked: 32
- na Head and Neck Cancer Biomarkers Detected in Saliva. Cancer Biol Ther 4, 6–12 (2005). · DOI
- Pepe, M. S. et al. Phases of Biomarker Development for Early Detection of Cancer. J Natl Cancer Inst 93, 1054–1061 (2001). · DOI · Paper page
- Lucs, A. V., Saltman, B., Chung, C. H., Steinberg, B. M. & Schwartz, D. L. Opportunities and challenges facing biomarker development for personalized head and neck cancer treatment. Head Neck 35, 294–306 (2013). · DOI
- Bandhakavi, S., Stone, M. D., Onsongo, G., Van Riper, S. K. & Griffin, T. J. A dynamic range compression and three-dimensional peptide fractionation analysis platform expands proteome coverage and the diagnostic potential of whole saliva. J. Proteome Res. 8, 5590–5600 (2009). · DOI
- Iorgulescu, G. Saliva between normal and pathological. Important factors in determining systemic and oral health. J Med Life 2, 303–307 (2009).
- Pfaffe, T., Cooper-White, J., Beyerlein, P., Kostner, K. & Punyadeera, C. Diagnostic potential of saliva: current state and future applications. Clin Chem 57, 675–687 (2011). · DOI
- Malamud, D. Saliva as a diagnostic fluid. Dent Clin North Am 55, 159–178 (2011). · DOI
- Chai, R. C. et al. A pilot study to compare the detection of HPV-16 biomarkers in salivary oral rinses with tumour p16INK4a expression in head and neck squamous cell carcinoma patients. BMC Cancer 16, 1–8 (2016). · DOI
- Lim, Y. et al. Salivary DNA methylation panel to diagnose HPV-positive and HPV-negative head and neck cancers. BMC Cancer 16, 1–12 (2016). · DOI
- Ovchinnikov, D. A. et al. DNA Methylation at the Novel CpG Sites in the Promoter of MED15/PCQAP Gene as a Biomarker for Head and Neck Cancers. Biomark Insights 9, 53–60 (2014). · DOI
- Ovchinnikov, D. A. et al. Tumor-suppressor Gene Promoter Hypermethylation in Saliva of Head and Neck Cancer Patients. Transl Oncol 5, 321–326 (2012). · DOI
- Salazar, C. et al. A novel saliva-based microRNA biomarker panel to detect head and neck cancers. Cell Oncol (Dordr) 37, 331–338 (2014). · DOI
- Zhang, X. et al. Quantification of D-dimer levels in human saliva. Bioanalysis 5 (2013). · DOI
- Zhang, X., Dimeski, G. & Punyadeera, C. Validation of an immunoassay to measure plasminogen-activator inhibitor-1 concentrations in human saliva. Biochem Med 24, 258–265 (2014). · DOI
- Wong, D. T. Salivary extracellular noncoding RNA: emerging biomarkers for molecular diagnostics. Clin Ther 37, 540–551 (2015). · DOI
- Guerrero-Preston, R. et al. 16S rRNA amplicon sequencing identifies microbiota associated with oral cancer, Human Papilloma Virus infection and surgical treatment. Oncotarget (2016). · DOI
- Weidlich, P., Cimões, R., Pannuti, C. M. & Oppermann, R. V. Association between periodontal diseases and systemic diseases. Braz Oral Res 22, 32–43 (2008). · DOI
- Vogelmann, R. & Amieva, M. R. The role of bacterial pathogens in cancer. Curr Opin Microbiol 10, 76–81 (2007). · DOI
- Chen, M. et al. The impact of different DNA extraction methods on the analysis of microbial diversity of oral saliva from healthy youths by polymerase chain reaction-denaturing gradient gel electrophoresis. JDS 11, 54–58 (2016).
- Jenkinson, H. F. Beyond the oral microbiome. Environ Microbiol 13, 3077–3087 (2011). · DOI
- Shanahan, E. R., Zhong, L., Talley, N. J., Morrison, M. & Holtmann, G. Characterisation of the gastrointestinal mucosa-associated microbiota: a novel technique to prevent cross-contamination during endoscopic procedures. Aliment Pharmacol Ther 43, 1186–1196 (2016). · DOI
- Haas, B. J. et al. Chimeric 16S rRNA sequence formation and detection in Sanger and 454-pyrosequenced PCR amplicons. Genome Res 21, 494–504 (2011). · DOI
- McDonald, D. et al. An improved Greengenes taxonomy with explicit ranks for ecological and evolutionary analyses of bacteria and archaea. ISME J 6, 610–618 (2012). · DOI
- Takeshita, T. et al. Bacterial diversity in saliva and oral health-related conditions: the Hisayama Study. Sci Rep 6, 22164 (2016). · DOI · Paper page
- Lazarevic, V., Gaia, N., Girard, M., Francois, P. & Schrenzel, J. Comparison of DNA extraction methods in analysis of salivary bacterial communities. PLoS One 8, e67699 (2013). · DOI
- Sohrabi, M. et al. The yield and quality of cellular and bacterial DNA extracts from human oral rinse samples are variably affected by the cell lysis methodology. J Microbiol Methods 122, 64–72 (2016). · DOI
- Vesty, A., Biswas, K., Taylor, M. W., Gear, K. & Douglas, R. G. Evaluating the Impact of DNA Extraction Method on the Representation of Human Oral Bacterial and Fungal Communities. PLoS ONE 12, e0169877 (2017). · DOI
- Hull, M. W. & Chow, A. W. Indigenous microflora and innate immunity of the head and neck. Infect Dis Clin North Am 21, 265–282 (2007). · DOI
- Taylan, I. et al. Comparison of the Surface and Core Bacteria in Tonsillar and Adenoid Tissue With Beta-Lactamase Production. Indian J Otolaryngol Head Neck Surg 63, 223–228 (2011). · DOI
- Danser, M. M., Gómez, S. M. & Van der Weijden, G. A. Tongue coating and tongue brushing: a literature review. Int J Dent Hyg 1, 151–158 (2003). · DOI
- Bik, E. M. et al. Bacterial diversity in the oral cavity of ten healthy individuals. The ISME J 4, 962–974 (2010). · DOI · Paper page
- Ozga, A.T. et al. Oral microbiome diversity among Cheyenne and Arapaho individuals from Oklahoma. Am J Phys Anthropol (2016). · DOI
Cited by
Sorted by citations
Willis, J. R., González-Torres, P., Pittis, A. A., Bejarano, L. A., Cozzuto, L., Andreu-Somavilla, N., Alloza-Trabado, M., Valentín, A., Ksiezopolska, E., Company, C., et al. (2018) · Microbiome · doi:10.1186/s40168-018-0592-3 · Cited by 158
Metadata
- Authors
- Lim, Y., Totsika, M., Morrison, M., & Punyadeera, C.
- Venue
- Scientific Reports
- Published
- 2017-08-17
- Volume
- 7
- Issue
- 1
- ISSN
- 2045-2322
- PMC
- PMC5561025
- Cited by
- 119
- References
- 2
- Language
- en
About these checks
Registry, retraction, Cites and statistics results are computed, not judged, with one exception: a printed reference that no index lists is read once by a model before it counts as a citation error. Claims are extracted by a model and kept only when their quote appears verbatim in the text; each cited source is then checked, with a model’s help, for whether it says what the claim relies on. Those verdicts can be wrong — read the claim’s quote and the cited source before relying on one.
Statistics and arithmetic are recomputed, not judged.
Confidence bands are shown only for fields calibrated on our annotated test set. None is calibrated yet, so no band is shown.
What counts as a claim ›How we measure confidence ›How we check this ›
Are you an author, or do you see a problem with this page? Request a review
