Cited by 142Immune cells in cancerWound Healing and TreatmentsNeuropeptides and Animal Physiology

The DOI matches its Crossref record; 59 of the 59 references it cites were found in a registry or an index.

A neuropeptide, Substance-P, directly induces tissue-repairing M2 like macrophages by activating the PI3K/Akt/mTOR pathway even in the presence of IFNγ

Open access
Lim, Ji Eun, Chung, Eunkyung, Son, Youngsook·2017·Scientific Reports

Abstract

Macrophage polarization plays an important role in tissue damage and repair. In this study, we show that Substance-P (SP) can directly induce M2 polarization of inflammatory macrophages. SP induced the differentiation of GM-CSF-differentiated pro-inflammatory macrophages into alternatively activated phagocytic M2 like macrophages (M2 SP) through direct activation of the PI3K/Akt/mTOR/S6kinase pathway and induction of Arginase-1, CD163, and CD206, all of which were nullified by pretreatment with the neurokinin-1 receptor (NK-1R) antagonist RP67580 and specific signaling pathway inhibitors. M2 SP were distinct from IL-4/IL-13-induced M2a and IL-10-induced M2c subtypes; they did not show STAT activation and exhibited high phagocytic and endothelial adhesive activity. Furthermore, SP had a dominant effect on M2 polarization over Interferon gamma (IFNγ), a potent M1-skewing cytokine, and effectively induced the M2 phenotype in monocytes and the human THP-1 cell line. Finally, adoptively transferred M2 SP migrated to a spinal cord injury (SCI) lesion site and improved functional recovery. Collectively, our findings show that SP, a neuropeptide, plays a role as a novel cytokine by inducing tissue-repairing M2 SP macrophages and thus may be developed for pharmacological intervention in diseases involving chronic inflammation and acute injury.

Overview

The claims and statistics of this paper haven’t been checked yet.

Run the check — free, no account needed. It reads the open-access text and checks the sources it cites.

A few free checks a day · papers already verified open instantly · results are public

Integrity signals

Registry

Crossref · 10.1038/s41598-017-09639-7

Cites

59 of 59 references verified0 citation errors · 0 not checkable

Statistics

Figures

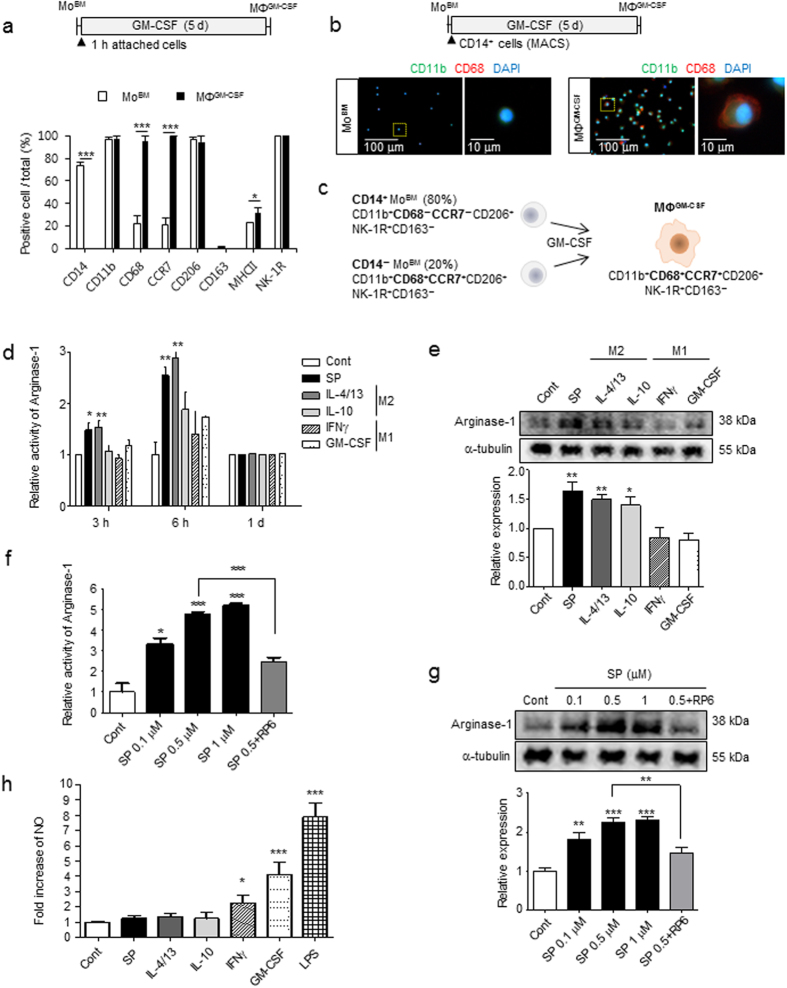
Figure 1 SP induces M2 polarization through early induction of Arginase-1. (a) MoBM were collected after 1-h of attachment and differentiated into MΦGM-CSF by GM-CSF treatment for 5 d. MΦGM-CSF (CD14−CD11b+CD68+CCR7+CD206+) were defined as M1-like precursors that were differentiated from MoBM (CD14+CD11b+CD68−CCR7−CD206+). For the immunofluorescence staining results (Supplementary Fig. 1a), the number of positive-cells was counted (5 random fields/coverslip) at 100 × magnification (0.85 mm2) (n = 3). (b) CD14+ MACS-isolated monocytes were differentiated with GM-CSF treatment for 5 d, and cells were further characterized as CD11b+CD68+ macrophages. (Green = CD11b, Red = CD68, Blue = DAPI) (n = 3). (c) Proposed model for MΦGM-CSF from MoBM with 80% CD14+ and 20% CD14− phenotypes. (d) Increased Arginase-1 activity was detected at the indicated time point of SP treatment using the Arginase-1 activity assay, and the results were compared with typical M1/M2-inducing cytokines (n = 3). (e) The increased expression of Arginase-1 was detected after 6 h of SP treatment. The western blot samples derived from the same experiment and were quantified with ImageJ. Full-length blots are presented in Supplementary Figure 16a (n = 4). (f–g) Dose-dependent increased activity and expression of Arginase-1 determined after 6 h of SP treatment. This was completely blocked by pretreatment with the NK-1R antagonist RP67580 (1 μM). (f) Arginase-1 activity assay (n = 3). (g) The western blot samples derived from the same experiment and were quantified with ImageJ. Full-length blots are presented in Supplementary Figure 16b (n = 4). (h) Increased NO was detected in culture with IFNγ, GM-CSF, or LPS but not with SP, IL-4/13, or IL-10. Quantitative analysis of NO production was performed in conditioned medium from MΦGM-CSF that had been treated with SP or cytokines for 1 d. LPS treatment served as a positive control (n = 6). Data represent the mean ± SEM (*p < 0.05, **p < 0.01, ***p < 0.001, unpaired t test). Scale bar = 100 μm (b) and 10 μm (high-magnification image of inset in b).
Figure 1 SP induces M2 polarization through early induction of Arginase-1. (a) MoBM were collected after 1-h of attachment and differentiated into MΦGM-CSF by GM-CSF treatment for 5 d. MΦGM-CSF (CD14−CD11b+CD68+CCR7+CD206+) were defined as M1-like precursors that were differentiated from MoBM (CD14+CD11b+CD68−CCR7−CD206+). For the immunofluorescence staining results (Supplementary Fig. 1a), the number of positive-cells was counted (5 random fields/coverslip) at 100 × magnification (0.85 mm2) (n = 3). (b) CD14+ MACS-isolated monocytes were differentiated with GM-CSF treatment for 5 d, and cells were further characterized as CD11b+CD68+ macrophages. (Green = CD11b, Red = CD68, Blue = DAPI) (n = 3). (c) Proposed model for MΦGM-CSF from MoBM with 80% CD14+ and 20% CD14− phenotypes. (d) Increased Arginase-1 activity was detected at the indicated time point of SP treatment using the Arginase-1 activity assay, and the results were compared with typical M1/M2-inducing cytokines (n = 3). (e) The increased expression of Arginase-1 was detected after 6 h of SP treatment. The western blot samples derived from the same experiment and were quantified with ImageJ. Full-length blots are presented in Supplementary Figure 16a (n = 4). (f–g) Dose-dependent increased activity and expression of Arginase-1 determined after 6 h of SP treatment. This was completely blocked by pretreatment with the NK-1R antagonist RP67580 (1 μM). (f) Arginase-1 activity assay (n = 3). (g) The western blot samples derived from the same experiment and were quantified with ImageJ. Full-length blots are presented in Supplementary Figure 16b (n = 4). (h) Increased NO was detected in culture with IFNγ, GM-CSF, or LPS but not with SP, IL-4/13, or IL-10. Quantitative analysis of NO production was performed in conditioned medium from MΦGM-CSF that had been treated with SP or cytokines for 1 d. LPS treatment served as a positive control (n = 6). Data represent the mean ± SEM (*p < 0.05, **p < 0.01, ***p < 0.001, unpaired t test). Scale bar = 100 μm (b) and 10 μm (high-magnification image of inset in b).CC BY · PubMed Central
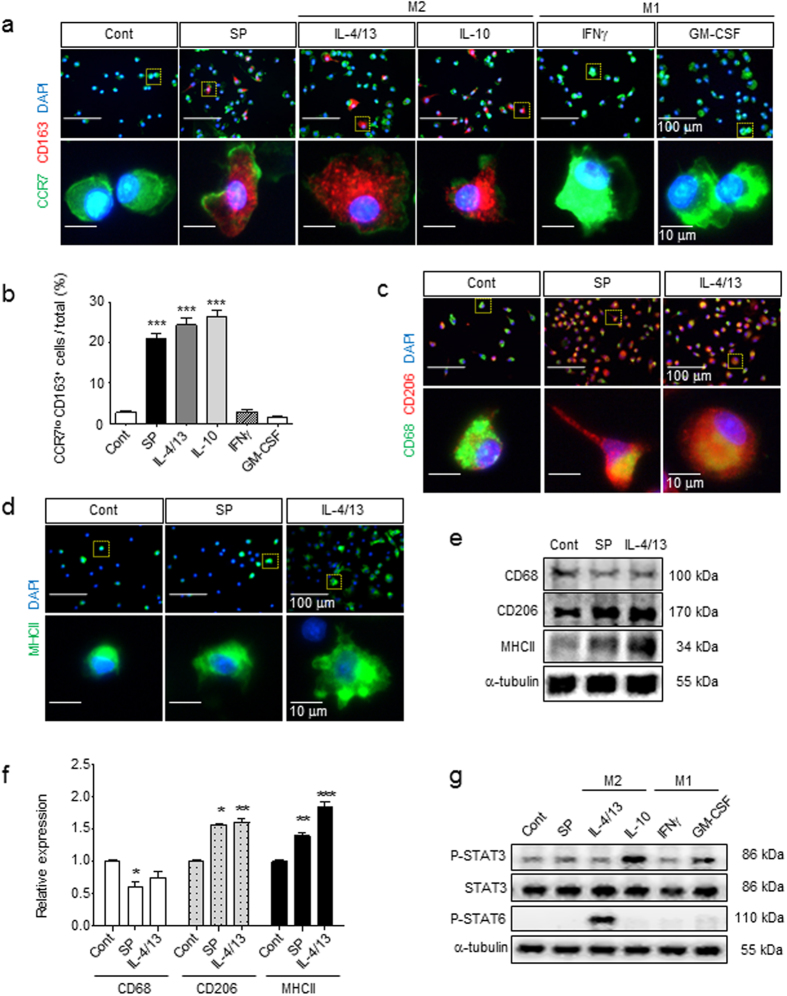
Figure 2 Identification of SP-induced macrophages as a distinct M2 subtype compared with IL-4/13- and IL-10-induced macrophages. (a,b) After 3 d of culture with SP or cytokines, MΦ were immunostained with specific M1/M2 markers. The induction of CD163 expression and reduction of CCR7 expression were induced to a similar extent in SP, IL-4/13 and IL-10 but not in IFNγ or GM-CSF treated with MΦGM-CSF at 3 d (Green = CCR7, Red = CD163, Blue = DAPI). The number of CCR7loCD163+ M2 cells was counted (5 random fields/coverslip) at 100 × magnification (0.85 mm2) (n = 3). (c) Decreased expression of CD68 and increased expression of CD206 were detected in response to SP treatment, which was similar to IL-4/13 treatment (Green = CD68, Red = CD206, Blue = DAPI) (n = 3). (d) MHCII was up-regulated by SP treatment, but the increased expression was much higher in response to IL-4/13 treatment (Green = MHCII, Blue = DAPI) (n = 3). (e–f) After 1 d of treatment, CD68, CD206, and MHCII were examined by western blot analysis and quantified using ImageJ. The samples derived from the same experiment and full-length blots are presented in Supplementary Figure 17 (n = 3). (g) Neither STAT3 nor STAT6 was activated by SP treatment at 6 h, which are known to involved in the IL-10 and IL-4/13-induced signaling pathway, respectively. The samples derived from the same experiment and full-length blots are presented in Supplementary Figure 18 (n = 2). Data represent the mean ± SEM (*p < 0.05, **p < 0.01, ***p < 0.001, unpaired t test). Scale bar = 100 μm (a,c,d) and 10 μm (high-magnification image inset in a,c,d).
Figure 2 Identification of SP-induced macrophages as a distinct M2 subtype compared with IL-4/13- and IL-10-induced macrophages. (a,b) After 3 d of culture with SP or cytokines, MΦ were immunostained with specific M1/M2 markers. The induction of CD163 expression and reduction of CCR7 expression were induced to a similar extent in SP, IL-4/13 and IL-10 but not in IFNγ or GM-CSF treated with MΦGM-CSF at 3 d (Green = CCR7, Red = CD163, Blue = DAPI). The number of CCR7loCD163+ M2 cells was counted (5 random fields/coverslip) at 100 × magnification (0.85 mm2) (n = 3). (c) Decreased expression of CD68 and increased expression of CD206 were detected in response to SP treatment, which was similar to IL-4/13 treatment (Green = CD68, Red = CD206, Blue = DAPI) (n = 3). (d) MHCII was up-regulated by SP treatment, but the increased expression was much higher in response to IL-4/13 treatment (Green = MHCII, Blue = DAPI) (n = 3). (e–f) After 1 d of treatment, CD68, CD206, and MHCII were examined by western blot analysis and quantified using ImageJ. The samples derived from the same experiment and full-length blots are presented in Supplementary Figure 17 (n = 3). (g) Neither STAT3 nor STAT6 was activated by SP treatment at 6 h, which are known to involved in the IL-10 and IL-4/13-induced signaling pathway, respectively. The samples derived from the same experiment and full-length blots are presented in Supplementary Figure 18 (n = 2). Data represent the mean ± SEM (*p < 0.05, **p < 0.01, ***p < 0.001, unpaired t test). Scale bar = 100 μm (a,c,d) and 10 μm (high-magnification image inset in a,c,d).CC BY · PubMed Central
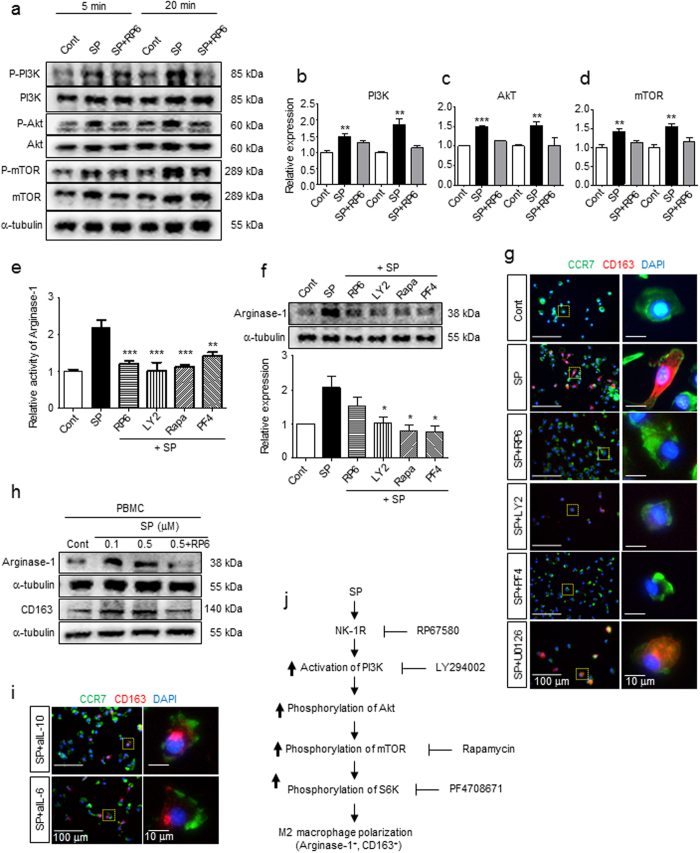
Figure 3 SP activates the NK-1R/PI3K/Akt/mTOR/S6K signaling pathway, leading to the induction of Arginase-1 and CD163 expression. (a) Western blot analysis showed that SP-activated PI3K, Akt, and mTOR were detected at 5 min and 20 min. The blockade of NK-1R by pretreatment with RP67580 led to inhibition of PI3K, Akt, and mTOR. The samples derived from the same experiment and full-length blots are presented in Supplementary Figures 19, 20 (n = 3). (b–d) Relative expression of p-PI3K/PI3K, p-Akt/Akt, and p-mTOR/mTOR was quantified with ImageJ (n = 3). (e) All inhibitors, such as the NK-1R antagonist RP67580, PI3K inhibitor LY294002, mTOR inhibitor rapamycin, and S6K inhibitor PF4708671, completely blocked the elevated SP-induced Arginase-1 activity at 6 h (n = 6). (f) All inhibitors blocked SP-induced Arginase-1 expression. The western blot results were quantified with ImageJ. The samples derived from the same experiment and full-length blots are presented in Supplementary Figure 21 (n = 3). (g) Pretreatment with RP67580 completely blocked CD163 induction in SP-induced M2 at 3 d. Inhibitors of PI3K (LY294002) and S6K (PF4708671), but not MEK/ERK (U0126), prevented the induction of CD163 expression following the administration of SP (Green = CCR7, Red = CD163, Blue = DAPI) (n = 3). (h) Rat PBMCs also showed increased expression of Arginase-1 and CD163 at 6 h and 1 d after SP treatment, respectively. Pretreatment with RP67580 blocked the increased SP-induced expression of Arginase-1 and CD163, as demonstrated by western blot analysis. The samples derived from the same experiment and full-length blots are presented in Supplementary Figure 22 (n = 2). (i) Treatment of functional blocking antibodies to IL-10 (aIL-10) and IL-6 (aIL-6) failed to block SP-induced CD163 expression at 3 d (Green = CCR7, Red = CD163, Blue = DAPI) (n = 3). (j) Schematic representation of Arginase-1+CD163+ M2 polarization in response to SP via NK-1R/PI3K/Akt/mTOR/S6K activation. Data represent the mean ± SEM (*p < 0.05, **p < 0.01, ***p < 0.001, unpaired t test). Scale bar = 100 μm (g,i) and 10 μm (high-magnification image inset in g,i).
Figure 3 SP activates the NK-1R/PI3K/Akt/mTOR/S6K signaling pathway, leading to the induction of Arginase-1 and CD163 expression. (a) Western blot analysis showed that SP-activated PI3K, Akt, and mTOR were detected at 5 min and 20 min. The blockade of NK-1R by pretreatment with RP67580 led to inhibition of PI3K, Akt, and mTOR. The samples derived from the same experiment and full-length blots are presented in Supplementary Figures 19, 20 (n = 3). (b–d) Relative expression of p-PI3K/PI3K, p-Akt/Akt, and p-mTOR/mTOR was quantified with ImageJ (n = 3). (e) All inhibitors, such as the NK-1R antagonist RP67580, PI3K inhibitor LY294002, mTOR inhibitor rapamycin, and S6K inhibitor PF4708671, completely blocked the elevated SP-induced Arginase-1 activity at 6 h (n = 6). (f) All inhibitors blocked SP-induced Arginase-1 expression. The western blot results were quantified with ImageJ. The samples derived from the same experiment and full-length blots are presented in Supplementary Figure 21 (n = 3). (g) Pretreatment with RP67580 completely blocked CD163 induction in SP-induced M2 at 3 d. Inhibitors of PI3K (LY294002) and S6K (PF4708671), but not MEK/ERK (U0126), prevented the induction of CD163 expression following the administration of SP (Green = CCR7, Red = CD163, Blue = DAPI) (n = 3). (h) Rat PBMCs also showed increased expression of Arginase-1 and CD163 at 6 h and 1 d after SP treatment, respectively. Pretreatment with RP67580 blocked the increased SP-induced expression of Arginase-1 and CD163, as demonstrated by western blot analysis. The samples derived from the same experiment and full-length blots are presented in Supplementary Figure 22 (n = 2). (i) Treatment of functional blocking antibodies to IL-10 (aIL-10) and IL-6 (aIL-6) failed to block SP-induced CD163 expression at 3 d (Green = CCR7, Red = CD163, Blue = DAPI) (n = 3). (j) Schematic representation of Arginase-1+CD163+ M2 polarization in response to SP via NK-1R/PI3K/Akt/mTOR/S6K activation. Data represent the mean ± SEM (*p < 0.05, **p < 0.01, ***p < 0.001, unpaired t test). Scale bar = 100 μm (g,i) and 10 μm (high-magnification image inset in g,i).CC BY · PubMed Central
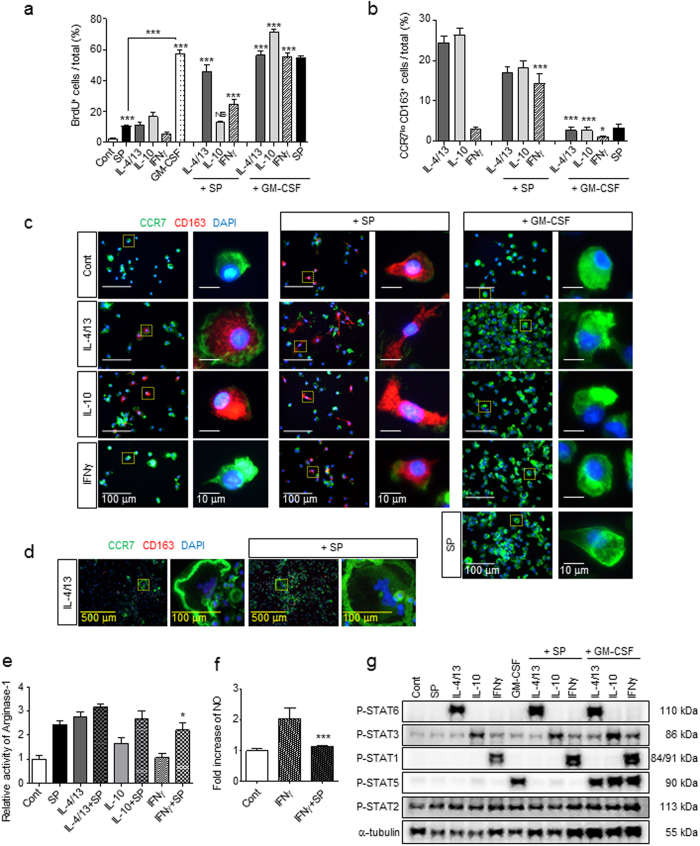
Figure 4 SP is a mitogen for macrophages and affects M2 polarization in a dominant manner even in the presence of the Th1 cytokine INFγ. (a) BrdU incorporation analysis revealed that SP was less potent at inducing proliferation than GM-CSF and that SP and GM-CSF had a synergistic effect on proliferation on all types of macrophages at 3 d. Fold change of BrdU incorporation in MΦGM-CSF was shown in Supplementary Figure 2a. The number of BrdU+ cells was counted (5 random fields/coverslip) at 100 × magnification (0.85 mm2) (n = 3). (b–c) The percentage of CCR7loCD163+ M2 macrophages was maintained in M2aIL-4/13 and M2cIL-10 subtypes in the presence of SP but completely diminished after 3 d of GM-CSF treatment. SP-induced M2 macrophages in M1INFγ showed similar proportions of the M2aIL-4/13 and M2cIL-10 subtypes (Green = CCR7, Red = CD163, Blue = DAPI). The number of CCR7loCD163+ M2 cells was counted (5 random fields/coverslip) at 100 × magnification (0.85 mm2) (n = 3). (d) IL-4/13-induced MGCs were still present in response to SP co-treatment at 3 d (Green = CCR7, Red = CD163, Blue = DAPI) (n = 6). (e) The activity of Arginase-1 was increased at 6 h in response to IL-4/13, IL-10 or IFNγ co-treatment with SP, as determined by Arginase-1 activity assay. SP-induced M2 polarization is dominantly working over Th1 cytokines, IFNγ (n = 6). (f) The iNOS activity assay revealed a decrease in IFNγ activity after SP co-treatment compared with that after IFNγ treatment at 1 d (n = 3). (g) SP did not activate STAT1, STAT3, STAT5, or STAT6, and SP co-treatment did not affect specific cytokine-mediated STAT expression such as STAT6 by IL-4/13, STAT3 by IL-10, STAT1 by IFNγ, and STAT5 by GM-CSF at 6 h. The western blot samples derived from the same experiment and full-length blots are presented in Supplementary Figure 23. (n = 2). Data represent the mean ± SEM (*p < 0.05, ***p < 0.001, unpaired t test). Scale bar = 500 μm (d), 100 μm (c, high-magnification image inset in d) and 10 μm (high-magnification image inset in c).
Figure 4 SP is a mitogen for macrophages and affects M2 polarization in a dominant manner even in the presence of the Th1 cytokine INFγ. (a) BrdU incorporation analysis revealed that SP was less potent at inducing proliferation than GM-CSF and that SP and GM-CSF had a synergistic effect on proliferation on all types of macrophages at 3 d. Fold change of BrdU incorporation in MΦGM-CSF was shown in Supplementary Figure 2a. The number of BrdU+ cells was counted (5 random fields/coverslip) at 100 × magnification (0.85 mm2) (n = 3). (b–c) The percentage of CCR7loCD163+ M2 macrophages was maintained in M2aIL-4/13 and M2cIL-10 subtypes in the presence of SP but completely diminished after 3 d of GM-CSF treatment. SP-induced M2 macrophages in M1INFγ showed similar proportions of the M2aIL-4/13 and M2cIL-10 subtypes (Green = CCR7, Red = CD163, Blue = DAPI). The number of CCR7loCD163+ M2 cells was counted (5 random fields/coverslip) at 100 × magnification (0.85 mm2) (n = 3). (d) IL-4/13-induced MGCs were still present in response to SP co-treatment at 3 d (Green = CCR7, Red = CD163, Blue = DAPI) (n = 6). (e) The activity of Arginase-1 was increased at 6 h in response to IL-4/13, IL-10 or IFNγ co-treatment with SP, as determined by Arginase-1 activity assay. SP-induced M2 polarization is dominantly working over Th1 cytokines, IFNγ (n = 6). (f) The iNOS activity assay revealed a decrease in IFNγ activity after SP co-treatment compared with that after IFNγ treatment at 1 d (n = 3). (g) SP did not activate STAT1, STAT3, STAT5, or STAT6, and SP co-treatment did not affect specific cytokine-mediated STAT expression such as STAT6 by IL-4/13, STAT3 by IL-10, STAT1 by IFNγ, and STAT5 by GM-CSF at 6 h. The western blot samples derived from the same experiment and full-length blots are presented in Supplementary Figure 23. (n = 2). Data represent the mean ± SEM (*p < 0.05, ***p < 0.001, unpaired t test). Scale bar = 500 μm (d), 100 μm (c, high-magnification image inset in d) and 10 μm (high-magnification image inset in c).CC BY · PubMed Central
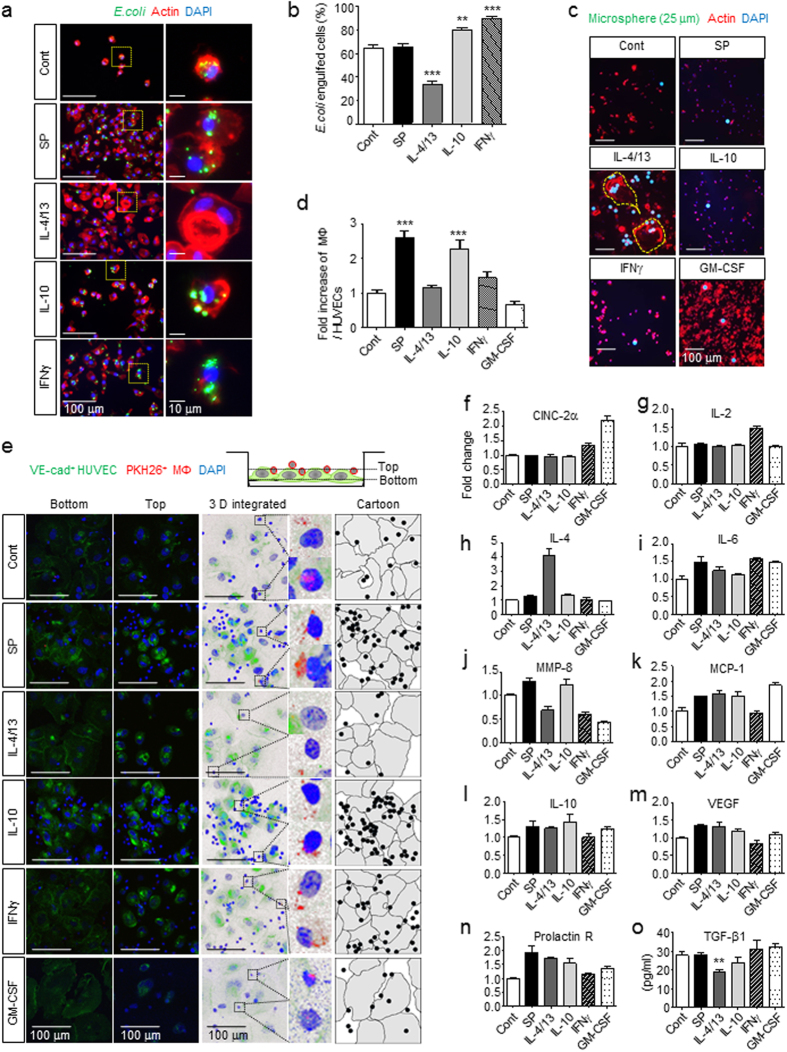
Figure 5 M2SP reveal highly phagocytic and endothelial adhesive activity and a distinct cytokine profile. (a,b) Anti-microbial activity was determined based on phagocytic activity toward FITC-labeled E. coli particles for 30 min. Analysis of E. coli-engulfed cells demonstrated strong anti-microbial activity of all types of macrophages, M2SP, M2cIL-10, and M1INFγ-like MΦGM-CSF, except M2aIL-4/13 (Green = FITC-E.coli particles, Red = Actin, Blue = DAPI). The number of E. coli-engulfed cells was counted (10 random fields/coverslip) at 200 × magnification (2.74 mm2) (n = 3). (c) IL-4/13-induced MGCs engulfed the large microspheres (Green = 25 μm Fluoresbrite microspheres, Red = Actin, Blue = DAPI). Enlarged images were shown in Supplementary Figure 6a and engulfed microspheres were confirmed inside of the MGCs in Supplementary Figure 6b (n = 3). (d,e) The adhesive activity of M2SP to HUVECs was determined. M2SP demonstrated a high adhesion ability like M2cIL-10, which was not detected in M2aIL-4/13 (Green = VE-cadherin, Red = PKH26-MΦ, Blue = DAPI). “Bottom” image confirms the VE-cadherin boundary of HUVECs and “Top” image confirms the attachment of macrophages. “3 D integrated image” was acquired from Z stack microscopic images and was presented as cartoons (Gray = HUVECs, Black = MΦ). The number of MΦ and HUVECs was counted (5 random fields/coverslip) at 100 × magnification (0.85 mm2) (n = 2). (f–o) M2SP released IL-6, MMP-8, MCP-1, IL-10, VEGF, and Prolactin R. M2SP, M2aIL-4/13, and M2cIL-10 commonly secreted MCP-1, IL-10, VEGF and Prolactin R after 1 d of treatment. (f–n) Quantification of cytokine array density was performed with ImageJ (n = 1). (o) ELISA (n = 3). Data represent the mean ± SEM (**p < 0.01, ***p < 0.001, unpaired t test). Scale bar = 100 μm (a,c,e) and 10 μm (high-magnification image inset in a).
Figure 5 M2SP reveal highly phagocytic and endothelial adhesive activity and a distinct cytokine profile. (a,b) Anti-microbial activity was determined based on phagocytic activity toward FITC-labeled E. coli particles for 30 min. Analysis of E. coli-engulfed cells demonstrated strong anti-microbial activity of all types of macrophages, M2SP, M2cIL-10, and M1INFγ-like MΦGM-CSF, except M2aIL-4/13 (Green = FITC-E.coli particles, Red = Actin, Blue = DAPI). The number of E. coli-engulfed cells was counted (10 random fields/coverslip) at 200 × magnification (2.74 mm2) (n = 3). (c) IL-4/13-induced MGCs engulfed the large microspheres (Green = 25 μm Fluoresbrite microspheres, Red = Actin, Blue = DAPI). Enlarged images were shown in Supplementary Figure 6a and engulfed microspheres were confirmed inside of the MGCs in Supplementary Figure 6b (n = 3). (d,e) The adhesive activity of M2SP to HUVECs was determined. M2SP demonstrated a high adhesion ability like M2cIL-10, which was not detected in M2aIL-4/13 (Green = VE-cadherin, Red = PKH26-MΦ, Blue = DAPI). “Bottom” image confirms the VE-cadherin boundary of HUVECs and “Top” image confirms the attachment of macrophages. “3 D integrated image” was acquired from Z stack microscopic images and was presented as cartoons (Gray = HUVECs, Black = MΦ). The number of MΦ and HUVECs was counted (5 random fields/coverslip) at 100 × magnification (0.85 mm2) (n = 2). (f–o) M2SP released IL-6, MMP-8, MCP-1, IL-10, VEGF, and Prolactin R. M2SP, M2aIL-4/13, and M2cIL-10 commonly secreted MCP-1, IL-10, VEGF and Prolactin R after 1 d of treatment. (f–n) Quantification of cytokine array density was performed with ImageJ (n = 1). (o) ELISA (n = 3). Data represent the mean ± SEM (**p < 0.01, ***p < 0.001, unpaired t test). Scale bar = 100 μm (a,c,e) and 10 μm (high-magnification image inset in a).CC BY · PubMed Central
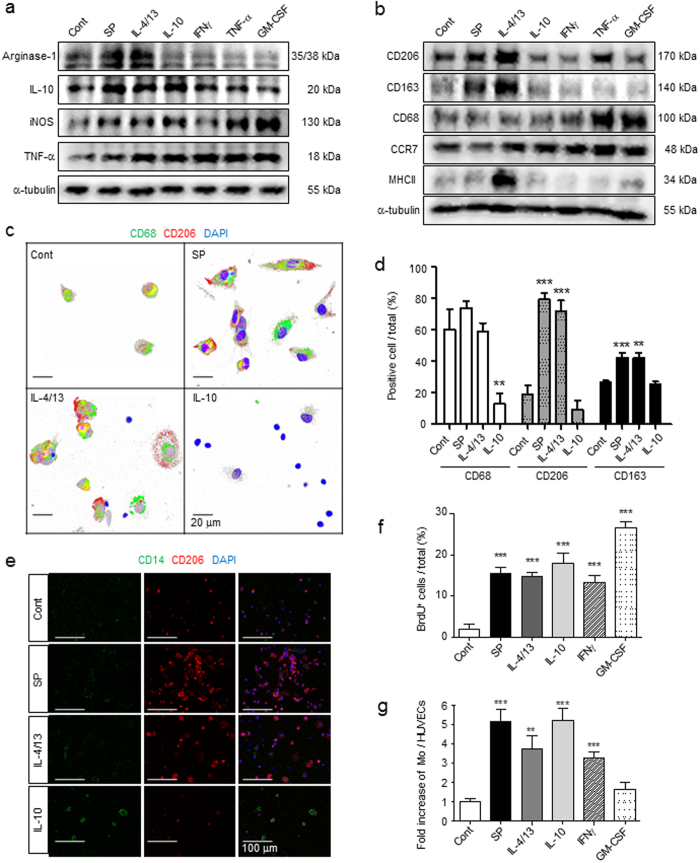
Figure 6 SP can activate bone marrow-derived monocytes to express an M2 phenotype. (a) Western blot analysis showed that SP increased the expression of Arginase-1 and IL-10 but not the expression of iNOS or TNF-α in MoBM after 6 h of treatment. The samples derived from the same experiment and full-length blots are presented in Supplementary Figure 24. (n = 2). (b) SP and IL-4/13 increased the expression of CD206 and CD163 but not the expression of CD68 or CCR7 after 1 d of treatment. Only IL-4/13 Strongly increased the expression of MHCII. The samples derived from the same experiment and full-length blots are presented in Supplementary Figure 25. (n = 2). (c) Immunofluorescent staining showed that MoBM differentiated into CD68+CD206+ macrophages following SP and IL-4/13 treatment at 3 d (Green = CD68, Red = CD206, Blue = DAPI). SP-primed monocytes had an elongated morphology based on confocal microscope Z stack section analysis. (d) IL-10 blocked differentiation into CD68+-activated macrophages, but SP and IL-4/13 induced CD68+CD206+CD163+ M2-phenotype macrophages at 3 d. For the immunofluorescence staining results (Fig. 6c and Supplementary Fig. 8), the number of positive-cells was counted (5 random fields/coverslip) at 100 × magnification (0.85 mm2) (n = 3). (e) Immunofluorescent staining showed that MoBM were maintained as CD14+ monocytes only by IL-10 treatment at 3 d (Green = CD14, Red = CD206, Blue = DAPI) (n = 3). (f) BrdU incorporation assays revealed a similarly potent proliferating ability of SP to that of cytokines, but a less potent proliferating ability in comparison to GM-CSF. The number of BrdU+ cells was counted (5 random fields/coverslip) at 100 × magnification (0.85 mm2) (n = 3). (g) MoSP demonstrated high adhesion ability to HUVECs, and eventually were highly migratory like MoIL-10. The numbers of MΦ and HUVECs were counted (5 random fields/coverslip) at 100 × magnification (0.85 mm2) (n = 2). Data represent the mean ± SEM (**p < 0.01, ***p < 0.001, unpaired t test). Scale bar = 20 μm (c) and 100 μm (e).
Figure 6 SP can activate bone marrow-derived monocytes to express an M2 phenotype. (a) Western blot analysis showed that SP increased the expression of Arginase-1 and IL-10 but not the expression of iNOS or TNF-α in MoBM after 6 h of treatment. The samples derived from the same experiment and full-length blots are presented in Supplementary Figure 24. (n = 2). (b) SP and IL-4/13 increased the expression of CD206 and CD163 but not the expression of CD68 or CCR7 after 1 d of treatment. Only IL-4/13 Strongly increased the expression of MHCII. The samples derived from the same experiment and full-length blots are presented in Supplementary Figure 25. (n = 2). (c) Immunofluorescent staining showed that MoBM differentiated into CD68+CD206+ macrophages following SP and IL-4/13 treatment at 3 d (Green = CD68, Red = CD206, Blue = DAPI). SP-primed monocytes had an elongated morphology based on confocal microscope Z stack section analysis. (d) IL-10 blocked differentiation into CD68+-activated macrophages, but SP and IL-4/13 induced CD68+CD206+CD163+ M2-phenotype macrophages at 3 d. For the immunofluorescence staining results (Fig. 6c and Supplementary Fig. 8), the number of positive-cells was counted (5 random fields/coverslip) at 100 × magnification (0.85 mm2) (n = 3). (e) Immunofluorescent staining showed that MoBM were maintained as CD14+ monocytes only by IL-10 treatment at 3 d (Green = CD14, Red = CD206, Blue = DAPI) (n = 3). (f) BrdU incorporation assays revealed a similarly potent proliferating ability of SP to that of cytokines, but a less potent proliferating ability in comparison to GM-CSF. The number of BrdU+ cells was counted (5 random fields/coverslip) at 100 × magnification (0.85 mm2) (n = 3). (g) MoSP demonstrated high adhesion ability to HUVECs, and eventually were highly migratory like MoIL-10. The numbers of MΦ and HUVECs were counted (5 random fields/coverslip) at 100 × magnification (0.85 mm2) (n = 2). Data represent the mean ± SEM (**p < 0.01, ***p < 0.001, unpaired t test). Scale bar = 20 μm (c) and 100 μm (e).CC BY · PubMed Central
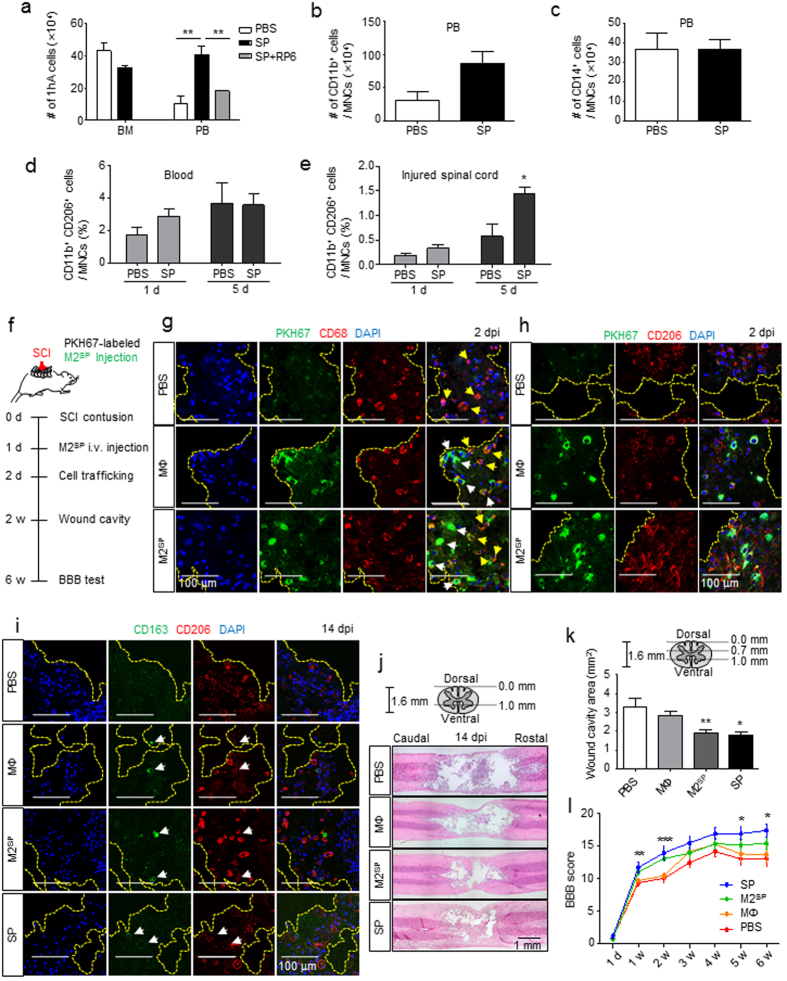
Figure 7 SP stimulates peripheral mobilization of CD11b+CD206+ cells from bone marrow and M2SP adoptive transfer improves functional recovery from SCI. (a) At 4.5 h after SP-injection, the number of 1-h adherent cells from the blood had increased. RP67580 blocked the increased number of 1-h adherent cells in PBMCs (n = 3). (b) At 4.5 h after SP-injection, MACS analysis showed that CD11b+ cells had increased in the blood (n = 3). (c) At 4.5 h after SP-injection, MACS analysis showed that the number of CD14+ cells did not differ in the blood (n = 3). (d) At 1 dpi, CD11b+CD206+ cells among the SP-injected PBMCs increased by 1.7-fold compared with that after PBS-injection. At 5 d, CD11b+CD206+ cells in response to SP-treatment was similar to that after PBS injection (n = 3). (e) At 1 dpi, SP treatment increased CD11b+CD206+ cells in injured spinal cord by 1.7-fold compared with that after PBS treatment. At 5 dpi, the number of CD11b+CD206+ macrophages increased by 2.5-fold in response to SP compared with that after PBS injection (n = 3). (f) A schematic of the procedure used for the adoptive transfer of M2SP in a rat SCI. PKH67-labeled MΦ and M2SP were injected at 1 dpi. (g) At 2 dpi, PKH67-labeled cells were observed at the injury core-lesion site. Longitudinal tissue sections were chosen at a distance of ~ 700 μm from the dorsal surface of the injury site. White arrows represent the PKH67+CD68+ adoptive transferred cells and yellow arrows represent PKH67−CD68+ resident microglia (Green = PKH67, Red = CD68, Blue = DAPI) (n = 3). (h) At 2 dpi, PKH67-labeled cells co-localized with CD206 (Green = PKH67, Red = CD206, Blue = DAPI) (n = 3). (i) At 14 dpi, CD163+CD206+ cells were observed in the MΦ, M2SP and SP groups but not in the PBS group (Green = CD163, Red = CD206, Blue = DAPI) (n = 3). (j,k) Histology and quantitative analysis of the lesion cavity delineated by H&E staining at 14 dpi. Every 2 stained tissue samples per rat were chosen at a distance of 0.7 mm and 1.0 mm from the dorsal section and lesion cavity was analyzed using ImageJ (PBS, n = 8; MΦ, n = 8; M2SP, n = 8; SP, n = 3). (l) The BBB score was evaluated for 6 weeks (1 d ~ 2 w- PBS, n = 14; MΦ, n = 14; M2SP, n = 15; SP, n = 5/3 w ~ 6 w- PBS group, n = 6; MΦ, n = 6; M2SP, n = 6; SP, n = 5). Data represent the mean ± SEM (*p < 0.05, **p < 0.01, ***p < 0.001). (a-e,k) Unpaired t test. (l) one-way ANOVA. Scale bar = 100 μm (g–i) and 1 mm (j).
Figure 7 SP stimulates peripheral mobilization of CD11b+CD206+ cells from bone marrow and M2SP adoptive transfer improves functional recovery from SCI. (a) At 4.5 h after SP-injection, the number of 1-h adherent cells from the blood had increased. RP67580 blocked the increased number of 1-h adherent cells in PBMCs (n = 3). (b) At 4.5 h after SP-injection, MACS analysis showed that CD11b+ cells had increased in the blood (n = 3). (c) At 4.5 h after SP-injection, MACS analysis showed that the number of CD14+ cells did not differ in the blood (n = 3). (d) At 1 dpi, CD11b+CD206+ cells among the SP-injected PBMCs increased by 1.7-fold compared with that after PBS-injection. At 5 d, CD11b+CD206+ cells in response to SP-treatment was similar to that after PBS injection (n = 3). (e) At 1 dpi, SP treatment increased CD11b+CD206+ cells in injured spinal cord by 1.7-fold compared with that after PBS treatment. At 5 dpi, the number of CD11b+CD206+ macrophages increased by 2.5-fold in response to SP compared with that after PBS injection (n = 3). (f) A schematic of the procedure used for the adoptive transfer of M2SP in a rat SCI. PKH67-labeled MΦ and M2SP were injected at 1 dpi. (g) At 2 dpi, PKH67-labeled cells were observed at the injury core-lesion site. Longitudinal tissue sections were chosen at a distance of ~ 700 μm from the dorsal surface of the injury site. White arrows represent the PKH67+CD68+ adoptive transferred cells and yellow arrows represent PKH67−CD68+ resident microglia (Green = PKH67, Red = CD68, Blue = DAPI) (n = 3). (h) At 2 dpi, PKH67-labeled cells co-localized with CD206 (Green = PKH67, Red = CD206, Blue = DAPI) (n = 3). (i) At 14 dpi, CD163+CD206+ cells were observed in the MΦ, M2SP and SP groups but not in the PBS group (Green = CD163, Red = CD206, Blue = DAPI) (n = 3). (j,k) Histology and quantitative analysis of the lesion cavity delineated by H&E staining at 14 dpi. Every 2 stained tissue samples per rat were chosen at a distance of 0.7 mm and 1.0 mm from the dorsal section and lesion cavity was analyzed using ImageJ (PBS, n = 8; MΦ, n = 8; M2SP, n = 8; SP, n = 3). (l) The BBB score was evaluated for 6 weeks (1 d ~ 2 w- PBS, n = 14; MΦ, n = 14; M2SP, n = 15; SP, n = 5/3 w ~ 6 w- PBS group, n = 6; MΦ, n = 6; M2SP, n = 6; SP, n = 5). Data represent the mean ± SEM (*p < 0.05, **p < 0.01, ***p < 0.001). (a-e,k) Unpaired t test. (l) one-way ANOVA. Scale bar = 100 μm (g–i) and 1 mm (j).CC BY · PubMed Central
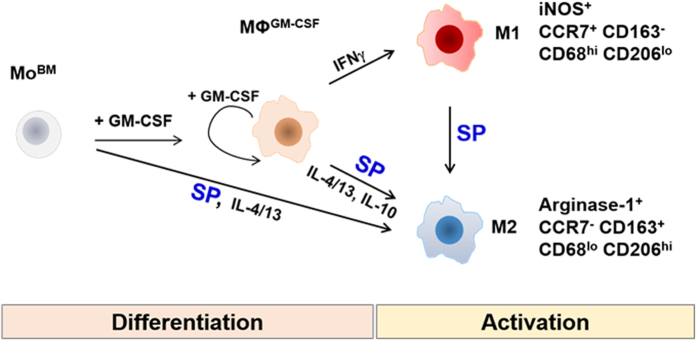
Figure 8 Summary of the characteristics of M2SP compared with other M2 and M1 subtypes.
Figure 8 Summary of the characteristics of M2SP compared with other M2 and M1 subtypes.CC BY · PubMed Central

Verification

Claims the paper makes

The claims and statistics of this paper haven’t been checked yet.

Run the check — free, no account needed. It reads the open-access text and checks the sources it cites.

A few free checks a day · papers already verified open instantly · results are public

Claims other papers make about this one

Each is checked against this paper’s own text: does it say what the citing paper says it does?

Self-check

Percentages, sums and reported differences re-computed from the paper’s own numbers.

The self-check needs the paper’s full text.

Citations

Cites

Show all 59 references

Cited by

Sorted by citations

Items 101–142 of 142

Metadata

Authors
Lim, J. E., Chung, E., & Son, Y.
Affiliations
Kyung Hee University (KR)
Corresponding author
  • Lim, Ji Eun
  • Chung, Eunkyung
  • Son, Youngsook
Venue
Scientific Reports
Published
2017-08-25
Volume
7
Issue
1
Pages
9417-9417
ISSN
2045-2322 (ISSN-L)
OpenAlex
W2750028600
Cited by
136
References
59
Citations by year
2026: 14 · 2025: 15 · 2024: 15 · 2023: 16 · 2022: 18 · 2021: 10 · 2020: 16 · 2019: 19 · 2018: 12 · 2017: 1
FWCI
5.94
Type
journal article
Language
en
Open access
Locations
  • Scientific Reports (publishedVersion, cc-by)
  • PubMed Central (publishedVersion, cc-by)
  • PubMed (publishedVersion)
  • DOAJ (DOAJ: Directory of Open Access Journals) (submittedVersion)
Funders
Ministry of Science, ICT and Future Planning (HI13C1479)
Topics
  • Life Sciences › Immunology and Microbiology › Immunology › Immune cells in cancer
  • Health Sciences › Medicine › Surgery › Wound Healing and Treatments
  • Life Sciences › Neuroscience › Cellular and Molecular Neuroscience › Neuropeptides and Animal Physiology
Keywords
substance P, neuropeptides, M2 macrophage polarization, M2 macrophages, interferon-gamma, neurokinin-1 receptor, arginase-1, CD163, CD206, spinal cord injury, tissue repair, macrophage migration, chronic inflammation
MeSH terms
THP-1 Cells, Animals, Cell Differentiation, Humans, Interferon-gamma, Macrophage Activation, Macrophages, Male, Substance P, Signal Transduction, Cytokines, Rats, Sprague-Dawley, Neurotransmitter Agents, Phosphatidylinositol 3-Kinases, Proto-Oncogene Proteins c-akt, TOR Serine-Threonine Kinases

About these checks

Registry, retraction, Cites and statistics results are computed, not judged, with one exception: a printed reference that no index lists is read once by a model before it counts as a citation error. Claims are extracted by a model and kept only when their quote appears verbatim in the text; each cited source is then checked, with a model’s help, for whether it says what the claim relies on. Those verdicts can be wrong — read the claim’s quote and the cited source before relying on one.

Statistics and arithmetic are recomputed, not judged.

Confidence bands are shown only for fields calibrated on our annotated test set. None is calibrated yet, so no band is shown.

What counts as a claim ›How we measure confidence ›How we check this ›

Are you an author, or do you see a problem with this page? Request a review