

The DOI matches its Crossref record; 48 of the 48 references it cites were found in a registry or an index.
Unveiling the gut microbiota composition and functionality associated with constipation through metagenomic analyses
Open accessAbstract
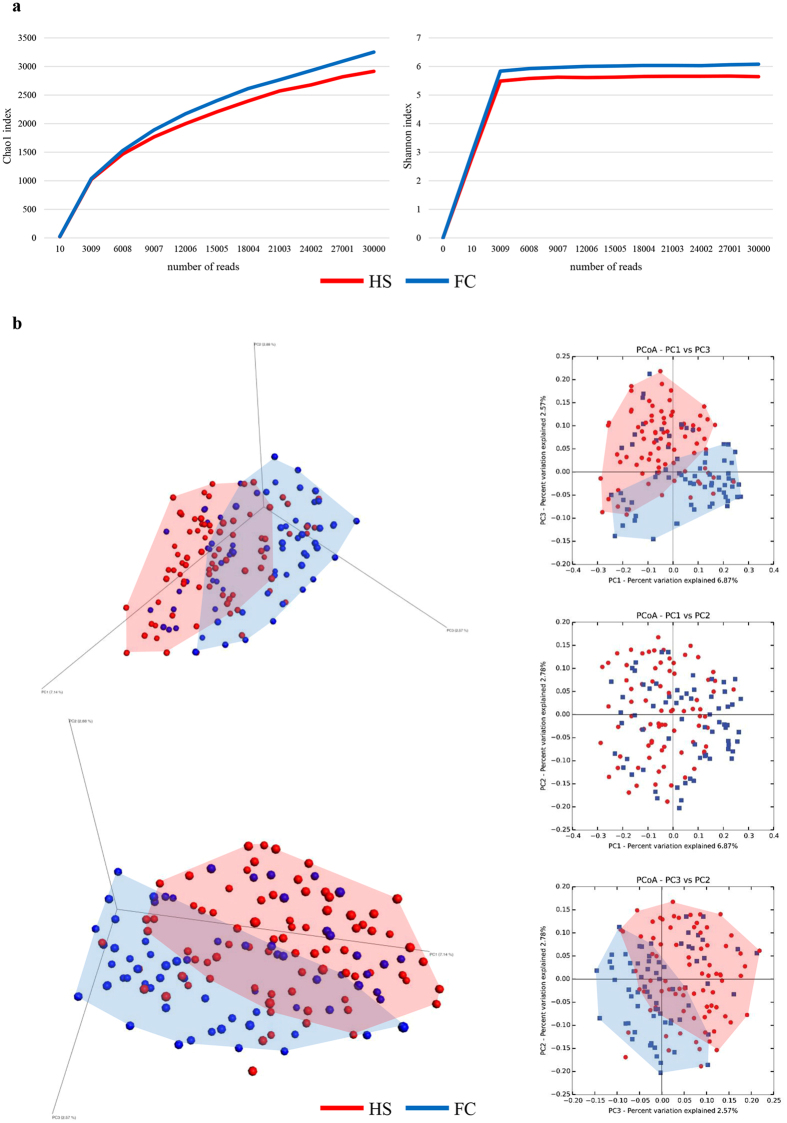
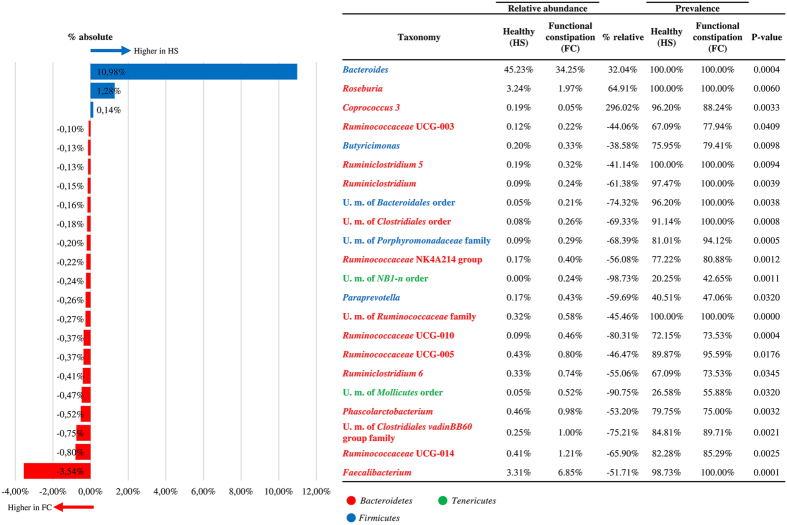
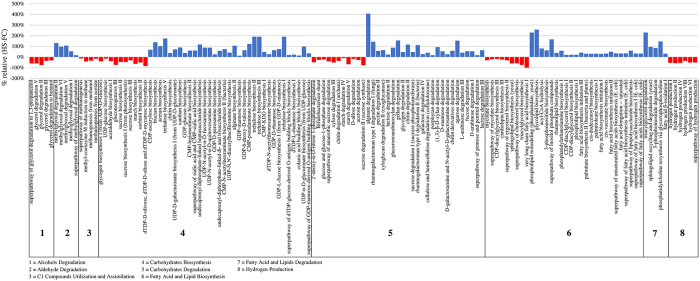
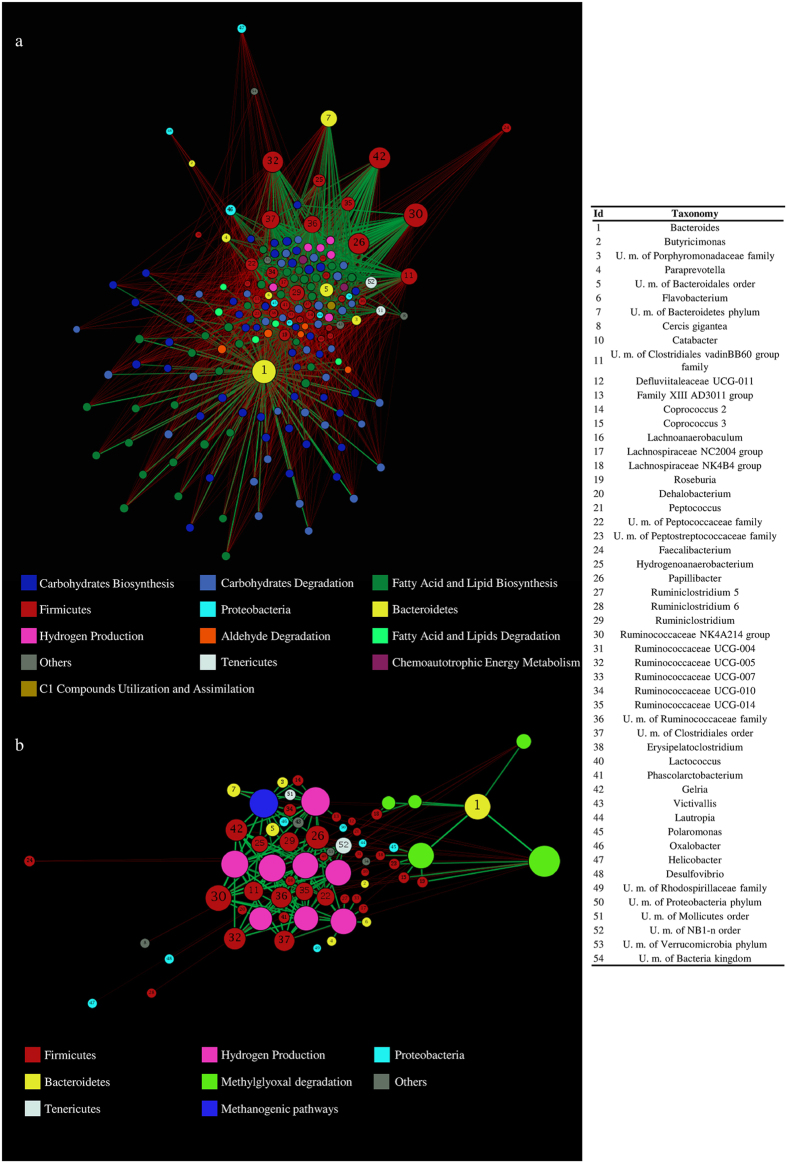
Functional constipation (FC) is a gastrointestinal disorder with a high prevalence among the general population. The precise causes of FC are still unknown and are most likely multifactorial. Growing evidence indicates that alterations of gut microbiota composition contribute to constipation symptoms. Nevertheless, many discrepancies exist in literature and no clear link between FC and gut microbiota composition has as yet been identified. In this study, we performed 16 S rRNA-based microbial profiling analysis of 147 stool samples from 68 FC individuals and compared their microbial profiles with those of 79 healthy subjects (HS). Notably, the gut microbiota of FC individuals was shown to be depleted of members belonging to Bacteroides, Roseburia and Coprococcus 3 . Furthermore, the metabolic capabilities of the gut microbiomes of five FC and five HS individuals were evaluated through shotgun metagenomics using a MiSeq platform, indicating that HS are enriched in pathways involved in carbohydrate, fatty acid and lipid metabolism as compared to FC. In contrast, the microbiomes corresponding to FC were shown to exhibit high abundance of genes involved in hydrogen production, methanogenesis and glycerol degradation. The identified differences in bacterial composition and metabolic capabilities may play an important role in development of FC symptoms.
Overview
The claims and statistics of this paper haven’t been checked yet.
Run the check — free, no account needed. It reads the open-access text and checks the sources it cites.
Integrity signals
Registry
Cites
Statistics
Figures
Verification
Claims the paper makes
The claims and statistics of this paper haven’t been checked yet.
Run the check — free, no account needed. It reads the open-access text and checks the sources it cites.
Claims other papers make about this one
Each is checked against this paper’s own text: does it say what the citing paper says it does?
In the citing paper
“Furthermore, healthy volunteers were found to have a gut microbiome enriched in genes involved in carbohydrate, fatty acid, and lipid metabolism while FC patients harbored a high abundance of genes involved in methanogenic pathways, hydrogen production, and glycerol162.”
From The gut Microbiome in adult and pediatric functional gastrointestinal disorders (2019) · cites this paper as [162]
In the citing paper
“Taxonomic profiling of the fecal microbiome from patients with functional constipation (FC) and healthy volunteers has shown decreased abundance of Bacteroides, Roseburia, and Coprococcus in FC patients.”
From The gut Microbiome in adult and pediatric functional gastrointestinal disorders (2019) · cites this paper as [162]
In the citing paper
“Shotgun metagenomic sequencing by Mancabelli et al . [ 32 ] does not support altered SCFA production in FC, which may be explained by very small sample size.”
From Role of gut microbiota in functional constipation (2021) · cites this paper as [32]
Self-check
Percentages, sums and reported differences re-computed from the paper’s own numbers.
The self-check needs the paper’s full text.
Citations
Cites
QIIME allows analysis of high-throughput community sequencing data
Caporaso, J. G., Kuczynski, J., Stombaugh, J., Bittinger, K., Bushman, F. D., Costello, E. K., Fierer, N., Peña, A. G., Goodrich, J. K., Gordon, J. I., et al. (2010) · Nature Methods · doi:10.1038/nmeth.f.303 · Cited by 34,887
The SILVA ribosomal RNA gene database project: improved data processing and web-based tools
Quast, C., Pruesse, E., Yilmaz, P., Gerken, J., Schweer, T., Yarza, P., Peplies, J., & Glöckner, F. O. (2012) · Nucleic Acids Research · doi:10.1093/nar/gks1219 · Cited by 33,055
HTSeq—a Python framework to work with high-throughput sequencing data
Anders, S., Pyl, P. T., & Huber, W. (2015) · Bioinformatics · doi:10.1093/bioinformatics/btu638 · Cited by 21,464
Search and clustering orders of magnitude faster than BLAST
Edgar, R. C. (2010) · Bioinformatics · doi:10.1093/bioinformatics/btq461 · Cited by 21,098
UniFrac: a New Phylogenetic Method for Comparing Microbial Communities
Lozupone, C., & Knight, R. (2005) · Applied and Environmental Microbiology · doi:10.1128/aem.71.12.8228-8235.2005 · Cited by 8,227
The American Journal of Physiology
(1899) · The American Naturalist · doi:10.1086/277182 · Cited by 5,680
The gut microbiota shapes intestinal immune responses during health and disease
Round, J. L., & Mazmanian, S. K. (2009) · Nature Reviews Immunology · doi:10.1038/nri2515 · Cited by 5,029
Caspi, R., Billington, R., Ferrer, L., Foerster, H., Fulcher, C. A., Keseler, I. M., Kothari, A., Krummenacker, M., Latendresse, M., Mueller, L. A., et al. (2016) · Nucleic Acids Research · doi:10.1093/nar/gkv1164 · Cited by 3,395
UniFrac: an effective distance metric for microbial community comparison
Lozupone, C., Lladser, M. E., Knights, D., Stombaugh, J., & Knight, R. (2011) · The ISME Journal · doi:10.1038/ismej.2010.133 · Cited by 2,825
Global Prevalence of and Risk Factors for Irritable Bowel Syndrome: A Meta-analysis
Lovell, R. M., & Ford, A. C. (2012) · Clinical Gastroenterology and Hepatology · doi:10.1016/j.cgh.2012.02.029 · Cited by 2,155
Cited by
Sorted by citations
Milani, C., Duranti, S., Bottacini, F., Casey, E., Turroni, F., Mahony, J., Belzer, C., Delgado Palacio, S., Arboleya Montes, S., Mancabelli, L., et al. (2017) · Microbiology and Molecular Biology Reviews · doi:10.1128/mmbr.00036-17 · Cited by 1,950
Self-citationManagement of functional constipation in children and adults
Vriesman, M. H., Koppen, I. J. N., Camilleri, M., Di Lorenzo, C., & Benninga, M. A. (2020) · Nature Reviews Gastroenterology & Hepatology · doi:10.1038/s41575-019-0222-y · Cited by 457
Gut microbiota, cognitive frailty and dementia in older individuals: A systematic review
Ticinesi, A., Tana, C., Nouvenne, A., Prati, B., Lauretani, F., & Meschi, T. (2018) · Clinical Interventions in Aging · doi:10.2147/cia.s139163 · Cited by 215
Self-citationYe, J., Lv, L., Wu, W., Li, Y., Shi, D., Fang, D., Guo, F., Jiang, H., Ren, Y., Ye, W., et al. (2018) · Frontiers in Microbiology · doi:10.3389/fmicb.2018.01967 · Cited by 211
Wernimont, S. M., Radosevich, J., Jackson, M. I., Ephraim, E., Badri, D. V., MacLeay, J. M., Jewell, D. E., & Suchodolski, J. S. (2020) · Frontiers in Microbiology · doi:10.3389/fmicb.2020.01266 · Cited by 244
Metadata
- Authors
- Mancabelli, L., Milani, C., Lugli, G. A., Turroni, F., Mangifesta, M., Viappiani, A., Ticinesi, A., Nouvenne, A., Meschi, T., van Sinderen, D., & Ventura, M.
- Affiliations
- University of Parma (IT)
- Corresponding author
- Ventura, Marco
- ORCID
- Venue
- Scientific Reports
- Published
- 2017-08-29
- Volume
- 7
- Issue
- 1
- Pages
- 9879-9879
- ISSN
- 2045-2322 (ISSN-L)
- PMC
- PMC5575163
- OpenAlex
- W2748998801
- Cited by
- 182
- References
- 48
- Citations by year
- 2026: 15 · 2025: 26 · 2024: 28 · 2023: 23 · 2022: 29 · 2021: 21 · 2020: 18 · 2019: 16 · 2018: 5 · 2017: 1
- FWCI
- 4.45
- Type
- journal article
- Language
- en
- Open access
- gold
- doi.org
- Locations
- Scientific Reports (publishedVersion, cc-by)
- PubMed Central (publishedVersion, cc-by)
- PubMed (publishedVersion)
- Arrow@dit (Dublin Institute of Technology) (submittedVersion, cc-by)
- HAL (submittedVersion)
- Cork Open Research Archive (University College Cork, Ireland) (submittedVersion, cc-by)
- DOAJ (DOAJ: Directory of Open Access Journals) (submittedVersion)
- Institutional Research Information System University of Ferrara (University of Ferrara) (submittedVersion)
- Funders
- Fondazione Cariparma
- Joint Programming Initiative A healthy diet for a healthy life
- Science Foundation Ireland (SFI/12/RC/, 12/RC/2273, 12/RC/, SFI/12/RC/2273.)
- Ministero dell’Istruzione, dell’Università e della Ricerca
- Università degli Studi di Parma
- APC Microbiome Institute (SFI/12/RC/2273)
- Topics
- Life Sciences › Biochemistry, Genetics and Molecular Biology › Molecular Biology › Gut microbiota and health
- Health Sciences › Medicine › Gastroenterology › Gastrointestinal motility and disorders
- Health Sciences › Medicine › Infectious Diseases › Clostridium difficile and Clostridium perfringens research
- Keywords
- functional constipation, gut microbiota, microbial community composition, microbial metabolic pathways, Bacteroides, Roseburia, carbohydrate metabolism, fatty acid metabolism, lipid metabolism, hydrogen production, methanogenesis, glycerol degradation, 16S rRNA gene profiling, shotgun metagenomics
- MeSH terms
- Gastrointestinal Microbiome, Constipation, Gene Amplification, Humans, RNA, Ribosomal, 16S, Case-Control Studies, Metagenome, Metagenomics
About these checks
Registry, retraction, Cites and statistics results are computed, not judged, with one exception: a printed reference that no index lists is read once by a model before it counts as a citation error. Claims are extracted by a model and kept only when their quote appears verbatim in the text; each cited source is then checked, with a model’s help, for whether it says what the claim relies on. Those verdicts can be wrong — read the claim’s quote and the cited source before relying on one.
Statistics and arithmetic are recomputed, not judged.
Confidence bands are shown only for fields calibrated on our annotated test set. None is calibrated yet, so no band is shown.
What counts as a claim ›How we measure confidence ›How we check this ›
Are you an author, or do you see a problem with this page? Request a review
