

The DOI matches its Crossref record; 11 of the 11 references it cites were found in a registry or an index.
Population resequencing of European mitochondrial genomes highlights sex-bias in Bronze Age demographic expansions
Abstract
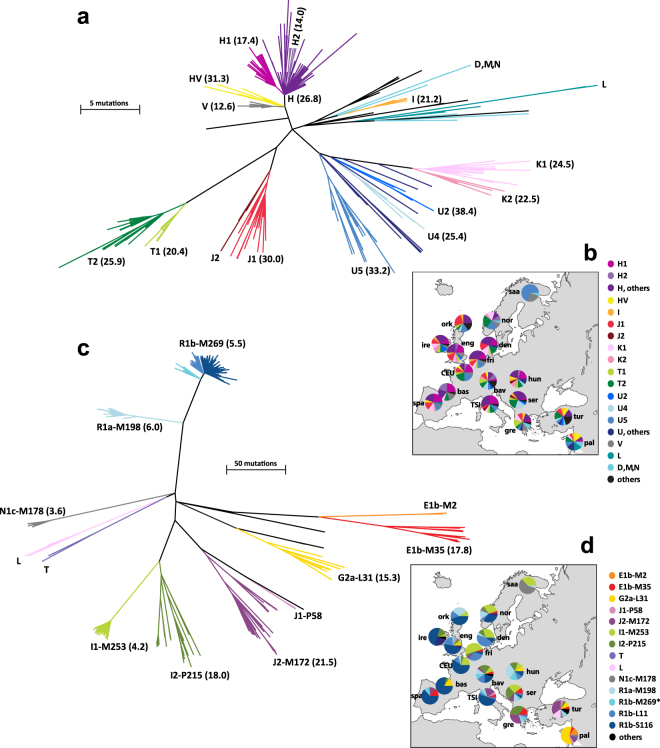
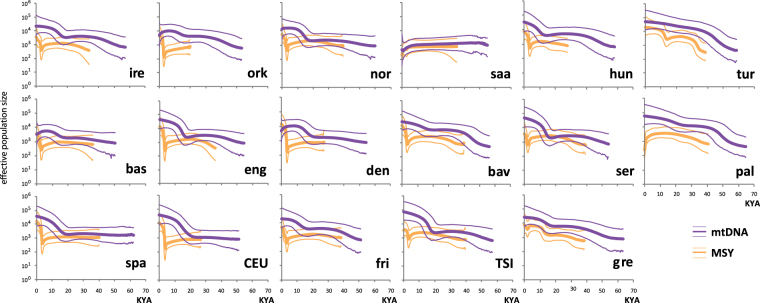
Interpretations of genetic data concerning the prehistory of Europe have long been a subject of great debate, but increasing amounts of ancient and modern DNA data are now providing new and more informative evidence. Y-chromosome resequencing studies in Europe have highlighted the prevalence of recent expansions of male lineages, and focused interest on the Bronze Age as a period of cultural and demographic change. These findings contrast with phylogeographic studies based on mitochondrial DNA (mtDNA), which have been interpreted as supporting expansions from glacial refugia. Here we have undertaken a population-based resequencing of complete mitochondrial genomes in Europe and the Middle East, in 340 samples from 17 populations for which Y-chromosome sequence data are also available. Demographic reconstructions show no signal of Bronze Age expansion, but evidence of Paleolithic expansions in all populations except the Saami, and with an absence of detectable geographical pattern. In agreement with previous inference from modern and ancient DNA data, the unbiased comparison between the mtDNA and Y-chromosome population datasets emphasizes the sex-biased nature of recent demographic transitions in Europe.
Overview
The claims and statistics of this paper haven’t been checked yet.
Run the check — free, no account needed. It reads the open-access text and checks the sources it cites.
Integrity signals
Registry
Cites
Statistics
Figures
Verification
Claims the paper makes
The claims and statistics of this paper haven’t been checked yet.
Run the check — free, no account needed. It reads the open-access text and checks the sources it cites.
Claims other papers make about this one
Each is checked against this paper’s own text: does it say what the citing paper says it does?
In the citing paper
“Similarly, Batini et al. analysed genetic diversity from 17 populations from Europe and the Near East, and showed similar Y chromosome pattern3,4.”
From Patrilineal segmentary systems provide a peaceful explanation for the post-Neolithic Y-chromosome bottleneck (2024) · cites this paper as Batini et al. [4]
In the citing paper
“Notably, the frequencies of the Y chromosome haplogroups underwent substantial shifts during the Steppe migration, resulting in the overrepresentation of haplogroup R1b1 in Europeans4,90,91.”
From Patrilineal segmentary systems provide a peaceful explanation for the post-Neolithic Y-chromosome bottleneck (2024) · cites this paper as [4]
Self-check
Percentages, sums and reported differences re-computed from the paper’s own numbers.
The self-check needs the paper’s full text.
Citations
Cites
Massive migration from the steppe was a source for Indo-European languages in Europe
Haak, W., Lazaridis, I., Patterson, N., Rohland, N., Mallick, S., Llamas, B., Brandt, G., Nordenfelt, S., Harney, E., Stewardson, K., et al. (2015) · Nature · doi:10.1038/nature14317 · Cited by 1,940
Updated comprehensive phylogenetic tree of global human mitochondrial DNA variation
van Oven, M., & Kayser, M. (2009) · Human Mutation · doi:10.1002/humu.20921 · Cited by 1,810
The Simons Genome Diversity Project: 300 genomes from 142 diverse populations
Mallick, S., Li, H., Lipson, M., Mathieson, I., Gymrek, M., Racimo, F., Zhao, M., Chennagiri, N., Nordenfelt, S., Tandon, A., et al. (2016) · Nature · doi:10.1038/nature18964 · Cited by 1,584
Self-citationPopulation genomics of Bronze Age Eurasia
Allentoft, M. E., Sikora, M., Sjögren, K.-G., Rasmussen, S., Rasmussen, M., Stenderup, J., Damgaard, P. B., Schroeder, H., Ahlström, T., Vinner, L., et al. (2015) · Nature · doi:10.1038/nature14507 · Cited by 1,550
Genome-wide patterns of selection in 230 ancient Eurasians
Mathieson, I., Lazaridis, I., Rohland, N., Mallick, S., Patterson, N., Roodenberg, S. A., Harney, E., Stewardson, K., Fernandes, D., Novak, M., et al. (2015) · Nature · doi:10.1038/nature16152 · Cited by 1,515
Ancient human genomes suggest three ancestral populations for present-day Europeans
Lazaridis, I., Patterson, N., Mittnik, A., Renaud, G., Mallick, S., Kirsanow, K., Sudmant, P. H., Schraiber, J. G., Castellano, S., Lipson, M., et al. (2014) · Nature · doi:10.1038/nature13673 · Cited by 1,357
Self-citationThe genetic history of Ice Age Europe
Fu, Q., Posth, C., Hajdinjak, M., Petr, M., Mallick, S., Fernandes, D., Furtwängler, A., Haak, W., Meyer, M., Mittnik, A., et al. (2016) · Nature · doi:10.1038/nature17993 · Cited by 959
Genomic insights into the origin of farming in the ancient Near East
Lazaridis, I., Nadel, D., Rollefson, G., Merrett, D. C., Rohland, N., Mallick, S., Fernandes, D., Novak, M., Gamarra, B., Sirak, K., et al. (2016) · Nature · doi:10.1038/nature19310 · Cited by 955
Fenner, J. N. (2005) · American Journal of Physical Anthropology · doi:10.1002/ajpa.20188 · Cited by 508
A recent bottleneck of Y chromosome diversity coincides with a global change in culture
Karmin, M., Saag, L., Vicente, M., Sayres, M. A. W., Järve, M., Talas, U. G., Rootsi, S., Ilumäe, A.-M., Mägi, R., Mitt, M., et al. (2015) · Genome Research · doi:10.1101/gr.186684.114 · Cited by 485
Punctuated bursts in human male demography inferred from 1,244 worldwide Y-chromosome sequences
The 1000 Genomes Project Consortium, Poznik, G. D., Xue, Y., Mendez, F. L., Willems, T. F., Massaia, A., Wilson Sayres, M. A., Ayub, Q., McCarthy, S. A., Narechania, A., et al. (2016) · Nature Genetics · doi:10.1038/ng.3559 · Cited by 331
Research works printed but not linked: 45
- Veeramah, K. R. & Hammer, M. F. The impact of whole-genome sequencing on the reconstruction of human population history. Nat Rev Genet 15, 149–162 (2014). · DOI
- Skoglund, P. et al. Origins and genetic legacy of Neolithic farmers and hunter-gatherers in Europe. Science 336, 466–469 (2012). · DOI · Paper page
- Sanchez-Quinto, F. et al. Genomic affinities of two 7,000-year-old Iberian hunter-gatherers. Curr Biol 22, 1494–1499 (2012). · DOI · Paper page
- Gimbutas M. Proto-Indo-European culture: the Kurgan culture during the fifth, fourth and third millennia B.C. In: Indo-European and Indo-Europeans (ed^(eds Cardona G, Hoenigswald HM, Senn A). University of Pennsylvania Press (1970). · DOI
- Batini, C. & Jobling, M. A. Detecting past male-mediated expansions using the Y chromosome. Hum Genet 136, 547–557 (2017). · DOI
- Batini, C. et al. Large-scale recent expansion of European patrilineages shown by population resequencing. Nat Commun 6, 7152 (2015). · DOI · Paper page
- Balanovsky, O. et al. Genetic differentiation between upland and lowland populations shapes the Y-chromosomal landscape of West Asia. Hum Genet 36, 437–450 (2017). · DOI · Paper page
- Posth, C. et al. Pleistocene mitochondrial genomes suggest a single major dispersal of Non-Africans and a late glacial population turnover in Europe. Curr Biol 26, 827–833 (2016). · DOI · Paper page
- Richards, M. B., Soares, P. & Torroni, A. Palaeogenomics: mitogenomes and migrations in Europe’s past. Curr Biol 26, R243–246 (2016). · DOI
- Brandt, G. et al. Ancient DNA reveals key stages in the formation of central European mitochondrial genetic diversity. Science 342, 257–261 (2013). · DOI · Paper page
- Jobling, M. A. & Tyler-Smith, C. Human Y-chromosome variation in the genome-sequencing era. Nat Rev Genet 18, 485–497 (2017). · DOI
- Lippold, S. et al. Human paternal and maternal demographic histories: insights from high-resolution Y chromosome and mtDNA sequences. Investig Genet 5, 13 (2014). · DOI · Paper page
- Richards, M. et al. Tracing European founder lineages in the near eastern mtDNA pool. Am J Hum Genet 67, 1251–1276 (2000). · DOI
- Achilli, A. et al. The molecular dissection of mtDNA haplogroup H confirms that the Franco-Cantabrian glacial refuge was a major source for the European gene pool. Am J Hum Genet 75, 910–918 (2004). · DOI
- Behar, D. M. et al. The Basque paradigm: genetic evidence of a maternal continuity in the Franco-Cantabrian region since pre-Neolithic times. Am J Hum Genet 90, 486–493 (2012). · DOI
- Olivieri, A. et al. Mitogenomes from two uncommon haplogroups mark late glacial/postglacial expansions from the near east and neolithic dispersals within Europe. PLoS ONE 8, e70492 (2013). · DOI
- Pala, M. et al. Mitochondrial DNA signals of late glacial recolonization of Europe from near eastern refugia. Am J Hum Genet 90, 915–924 (2012). · DOI
- Pereira, L. et al. High-resolution mtDNA evidence for the late-glacial resettlement of Europe from an Iberian refugium. Genome Res 15, 19–24 (2005). · DOI
- Pereira, J. B. et al. Reconciling evidence from ancient and contemporary genomes: a major source for the European Neolithic within Mediterranean Europe. Proc Biol Sci 284, 20161976 (2017). · DOI
- Rosa, A. & Brehem, A. African human mtDNA phylogeography at-a-glance. J Anthropol Sci 89, 25–58 (2011).
- Stoneking, M. & Delfin, F. The human genetic history of East Asia: weaving a complex tapestry. Curr Biol 20, R188–193 (2010). · DOI
- Richards, M. et al. Paleolithic and neolithic lineages in the European mitochondrial gene pool. Am J Hum Genet 59, 185–203 (1996).
- Pinhasi, R., Thomas, M. G., Hofreiter, M., Currat, M. & Burger, J. The genetic history of Europeans. Trends Genet 28, 496–505 (2012). · DOI
- Richards, M. B., Macaulay, V. A., Bandelt, H. J. & Sykes, B. C. Phylogeography of mitochondrial DNA in western Europe. Ann Hum Genet 62, 241–260 (1998). · DOI
- Silva, M. et al. A genetic chronology for the Indian Subcontinent points to heavily sex-biased dispersals. BMC Evol Biol 17, 88 (2017). · DOI
- Melton, T., Holland, C. & Holland, M. Forensic Mitochondrial DNA Analysis: Current Practice and Future Potential. Forensic Sci Rev 24, 101–122 (2012).
- Torroni, A. et al. A signal, from human mtDNA, of postglacial recolonization in Europe. Am J Hum Genet 69, 844–852 (2001). · DOI
- Hallast, P. et al. The Y-chromosome tree bursts into leaf: 13,000 high-confidence SNPs covering the majority of known clades. Mol Biol Evol 32, 661–673 (2015). · DOI
- Huyghe, J. R. et al. A genome-wide analysis of population structure in the Finnish Saami with implications for genetic association studies. Eur J Hum Genet 19, 347–352 (2011). · DOI
- Menozzi, P., Piazza, A. & Cavalli-Sforza, L. L. Synthetic maps of human gene frequencies in Europeans. Science 201, 786–792 (1978). · DOI
- International HapMap Consortium. Integrating common and rare genetic variation in diverse human populations. Nature 467, 52-58 (2010). · DOI · Paper page
- Winney, B. et al. People of the British Isles: preliminary analysis of genotypes and surnames in a UK-control population. Eur J Hum Genet 20, 203–210 (2012). · DOI
- Leslie, S. et al. The fine-scale genetic structure of the British population. Nature 519, 309–314 (2015). · DOI
- Tamura, K., Stecher, G., Peterson, D., Filipski, A. & Kumar, S. MEGA6: Molecular Evolutionary Genetics Analysis version 6.0. Mol Biol Evol 30, 2725–2729 (2013). · DOI
- Nei M, Kumar S. Molecular Evolution and Phylogenetics. Oxford University Press (2000). · DOI · Paper page
- Weissensteiner, H. et al. HaploGrep 2: mitochondrial haplogroup classification in the era of high-throughput sequencing. Nucleic Acids Res 44, W58–W63 (2016). · DOI
- Bandelt, H.-J., Forster, P. & Röhl, A. Median-joining networks for inferring intraspecific phylogenies. Mol Biol Evol 16, 37–48 (1999). · DOI · Paper page
- Kong, Q. P. et al. Distilling artificial recombinants from large sets of complete mtDNA genomes. PLoS ONE 3, e3016 (2008). · DOI
- Kloss-Brandstatter, A. et al. HaploGrep: a fast and reliable algorithm for automatic classification of mitochondrial DNA haplogroups. Hum Mutat 32, 25–32 (2011). · DOI
- Drummond, A. J., Suchard, M. A., Xie, D. & Rambaut, A. Bayesian phylogenetics with BEAUti and the BEAST 1.7. Mol Biol Evol 29, 1969–1973 (2012). · DOI
- Soares, P. et al. Correcting for purifying selection: an improved human mitochondrial molecular clock. Am J Hum Genet 84, 740–759 (2009). · DOI
- Moorjani, P. et al. A genetic method for dating ancient genomes provides a direct estimate of human generation interval in the last 45,000 years. Proc Natl Acad Sci USA 113, 5652–5657 (2016). · DOI · Paper page
- Tajima, F. Statistical method for testing the neutral mutation hypothesis by DNA polymorphism. Genetics 123, 585–595 (1989). · DOI
- Fu, Y. X. & Li, W. H. Statistical tests of neutrality of mutations. Genetics 133, 693–709 (1993). · DOI
- Excoffier, L. & Lischer, H. E. Arlequin suite ver 3.5: a new series of programs to perform population genetics analyses under Linux and Windows. Mol Ecol Resour 10, 564–567 (2010). · DOI
Cited by
Guyon, L., Guez, J., Toupance, B., Heyer, E., & Chaix, R. (2024) · Nature Communications · doi:10.1038/s41467-024-47618-5 · Cited by 28
Metadata
- Authors
- Batini, C., Hallast, P., Vågene, Å. J., Zadik, D., Eriksen, H. A., Pamjav, H., Sajantila, A., Wetton, J. H., & Jobling, M. A.
- Venue
- Scientific Reports
- Published
- 2017-09-21
- Volume
- 7
- Issue
- 1
- ISSN
- 2045-2322
- PMC
- PMC5608872
- Cited by
- 31
- References
- 11
- Language
- en
About these checks
Registry, retraction, Cites and statistics results are computed, not judged, with one exception: a printed reference that no index lists is read once by a model before it counts as a citation error. Claims are extracted by a model and kept only when their quote appears verbatim in the text; each cited source is then checked, with a model’s help, for whether it says what the claim relies on. Those verdicts can be wrong — read the claim’s quote and the cited source before relying on one.
Statistics and arithmetic are recomputed, not judged.
Confidence bands are shown only for fields calibrated on our annotated test set. None is calibrated yet, so no band is shown.
What counts as a claim ›How we measure confidence ›How we check this ›
Are you an author, or do you see a problem with this page? Request a review
