

Urinary CE-MS peptide marker pattern for detection of solid tumors
Open accessThe DOI matches its Crossref record; 38 of the 38 references it cites were found in a registry or an index.
Abstract
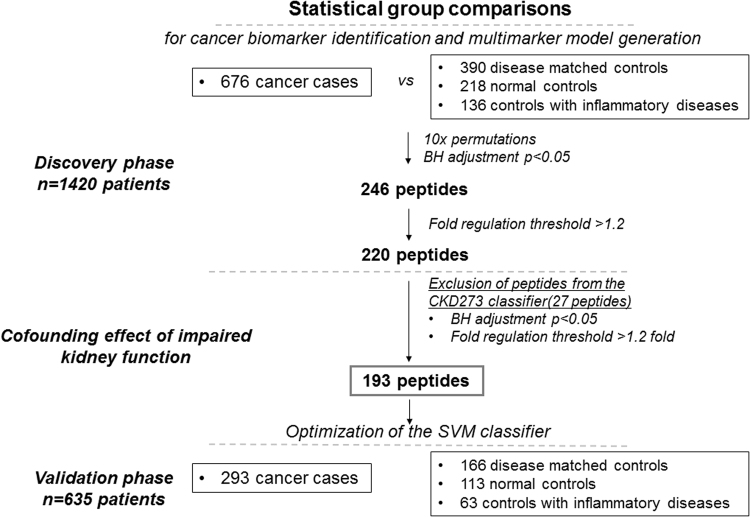
Urinary profiling datasets, previously acquired by capillary electrophoresis coupled to mass-spectrometry were investigated to identify a general urinary marker pattern for detection of solid tumors by targeting common systemic events associated with tumor-related inflammation. A total of 2,055 urinary profiles were analyzed, derived from a) a cancer group of patients (n = 969) with bladder, prostate, and pancreatic cancers, renal cell carcinoma, and cholangiocarcinoma and b) a control group of patients with benign diseases (n = 556), inflammatory diseases (n = 199) and healthy individuals (n = 331). Statistical analysis was conducted in a discovery set of 676 cancer cases and 744 controls. 193 peptides differing at statistically significant levels between cases and controls were selected and combined to a multi-dimensional marker pattern using support vector machine algorithms. Independent validation in a set of 635 patients (293 cancer cases and 342 controls) showed an AUC of 0.82. Inclusion of age as independent variable, significantly increased the AUC value to 0.85. Among the identified peptides were mucins, fibrinogen and collagen fragments. Further studies are planned to assess the pattern value to monitor patients for tumor recurrence. In this proof-of-concept study, a general tumor marker pattern was developed to detect cancer based on shared biomarkers, likely indicative of cancer-related features.
Overview
The claims and statistics of this paper haven’t been checked yet.
Free: it reads the open-access text and checks the first 5 claims that cite a source we can check. Create a free account to check every claim.
Integrity signals
Registry
Cites
Statistics
Figures


Verification
Claims the paper makes
The claims and statistics of this paper haven’t been checked yet.
Free: it reads the open-access text and checks the first 5 claims that cite a source we can check. Create a free account to check every claim.
Claims other papers make about this one
Each is checked against this paper’s own text: does it say what the citing paper says it does?
In the citing paper
“Capillary electrophoresis is a mature separation technology that is effectively coupled with mass spectrometry (CE-MS) and is well suited for this purpose7,8.”
From Recent trends of capillary electrophoresis‐mass spectrometry in proteomics research (2019) · cites this paper as [8]
Self-check
Percentages, sums and reported differences re-computed from the paper’s own numbers.
The self-check needs the paper’s full text.
Citations
Cites
Controlling the False Discovery Rate: A Practical and Powerful Approach to Multiple Testing
Benjamini, Y., & Hochberg, Y. (1995) · Journal of the Royal Statistical Society Series B: Statistical Methodology · doi:10.1111/j.2517-6161.1995.tb02031.x · Cited by 109,482
Cancer incidence and mortality worldwide: Sources, methods and major patterns in GLOBOCAN 2012
Ferlay, J., Soerjomataram, I., Dikshit, R., Eser, S., Mathers, C., Rebelo, M., Parkin, D. M., Forman, D., & Bray, F. (2015) · International Journal of Cancer · doi:10.1002/ijc.29210 · Cited by 28,766
Siegel, R. L., Miller, K. D., & Jemal, A. (2017) · CA: A Cancer Journal for Clinicians · doi:10.3322/caac.21387 · Cited by 14,712
Mantovani, A., Allavena, P., Sica, A., & Balkwill, F. (2008) · Nature · doi:10.1038/nature07205 · Cited by 11,399
Immunity, Inflammation, and Cancer
Grivennikov, S. I., Greten, F. R., & Karin, M. (2010) · Cell · doi:10.1016/j.cell.2010.01.025 · Cited by 10,755
UniProt: the Universal Protein knowledgebase
Apweiler, R. (2004) · Nucleic Acids Research · doi:10.1093/nar/gkh131 · Cited by 7,498
UniProt: the universal protein knowledgebase
The UniProt Consortium (2017) · Nucleic Acids Research · doi:10.1093/nar/gkw1099 · Cited by 4,436
Remodelling the extracellular matrix in development and disease
Bonnans, C., Chou, J., & Werb, Z. (2014) · Nature Reviews Molecular Cell Biology · doi:10.1038/nrm3904 · Cited by 4,367
Metastasis: a question of life or death
Mehlen, P., & Puisieux, A. (2006) · Nature Reviews Cancer · doi:10.1038/nrc1886 · Cited by 1,863
The global burden of cancer: priorities for prevention
Thun, M. J., DeLancey, J. O., Center, M. M., Jemal, A., & Ward, E. M. (2010) · Carcinogenesis · doi:10.1093/carcin/bgp263 · Cited by 1,091
Cited by
Stolz, A., Jooß, K., Höcker, O., Römer, J., Schlecht, J., & Neusüß, C. (2019) · ELECTROPHORESIS · doi:10.1002/elps.201800331 · Cited by 214
Latosińska, A., Siwy, J., Mischak, H., & Frantzi, M. (2019) · Electrophoresis · doi:10.1002/elps.201900091 · Cited by 129
Self-citationRecent trends of capillary electrophoresis‐mass spectrometry in proteomics research
Gomes, F. P., & Yates, J. R. (2019) · Mass Spectrometry Reviews · doi:10.1002/mas.21599 · Cited by 112
Proteomics biomarkers for solid tumors: Current status and future prospects
Belczacka, I., Latosińska, A., Metzger, J., Marx, D., Vlahou, A., Mischak, H., & Frantzi, M. (2018) · Mass Spectrometry Reviews · doi:10.1002/mas.21572 · Cited by 83
Self-citationJordaens, S., Zwaenepoel, K., Tjalma, W. A. A., Deben, C., Beyers, K., Vankerckhoven, V., Pauwels, P., & Vorsters, A. (2023) · International Journal of Cancer · doi:10.1002/ijc.34434 · Cited by 88
Metadata
- Authors
- Belczacka, I., Latosinska, A., Siwy, J., Metzger, J., Merseburger, A. S., Mischak, H., Vlahou, A., Frantzi, M., & Jankowski, V.
- Affiliations
- Universitätsklinikum Aachen (DE)
- Mosaiques Diagnostics and Therapeutics (Germany) (DE)
- University of Lübeck (DE)
- Academy of Athens (GR)
- Corresponding author
- Jankowski, Vera
- ORCID
- Venue
- Scientific Reports
- Published
- 2018-03-27
- Volume
- 8
- Issue
- 1
- Pages
- 5227-5227
- ISSN
- 2045-2322 (ISSN-L)
- PMC
- PMC5869723
- OpenAlex
- W2794475216
- Cited by
- 37
- References
- 38
- Citations by year
- 2026: 3 · 2025: 2 · 2023: 5 · 2022: 4 · 2021: 7 · 2020: 3 · 2019: 5 · 2018: 8
- FWCI
- 2.04
- Type
- journal article
- Language
- en
- Update notices
- correction (2019-09-03)
- Open access
- gold
- doi.org
- Licence
- cc-by
- creativecommons.org/licenses/by/4.0 (tdm)
- creativecommons.org/licenses/by/4.0 (vor)
- Locations
- Scientific Reports (publishedVersion, cc-by)
- PubMed Central (publishedVersion, cc-by)
- PubMed (publishedVersion)
- ENLIGHTEN (Jurnal Bimbingan dan Konseling Islam) (acceptedVersion, cc-by-sa)
- DOAJ (DOAJ: Directory of Open Access Journals) (submittedVersion)
- RWTH Publications (RWTH Aachen)
- Funders
- European Commission (622934)
- Topics
- Life Sciences › Biochemistry, Genetics and Molecular Biology › Molecular Biology › Metabolomics and Mass Spectrometry Studies
- Physical Sciences › Chemistry › Spectroscopy › Advanced Proteomics Techniques and Applications
- Physical Sciences › Engineering › Biomedical Engineering › Advanced Chemical Sensor Technologies
- Keywords
- capillary electrophoresis-mass spectrometry, tumor markers, bladder cancer, prostate cancer, pancreatic cancer, renal cell carcinoma, cholangiocarcinoma, mucin, fibrinogen fragments, collagen fragments, support vector machine classification, tumor recurrence monitoring
- MeSH terms
- Adolescent, Adult, Aged, Aged, 80 and over, Urinary Bladder Neoplasms, Carcinoma, Renal Cell, Humans, Inflammation, Kidney Neoplasms, Male, Middle Aged, Neoplasm Invasiveness, Pancreatic Neoplasms, Peptides, Prostatic Neoplasms, Mass Spectrometry, Biomarkers, Tumor, Cholangiocarcinoma, Electrophoresis, Capillary, Young Adult
About these checks
Registry, retraction, Cites and statistics results are computed, not judged, with one exception: a printed reference that no index lists is read once by a model before it counts as a citation error. Claims are extracted by a model and kept only when their quote appears verbatim in the text; each cited source is then checked, with a model’s help, for whether it says what the claim relies on. Those verdicts can be wrong — read the claim’s quote and the cited source before relying on one.
Statistics and arithmetic are recomputed, not judged.
Confidence bands are shown only for fields calibrated on our annotated test set. None is calibrated yet, so no band is shown.
What counts as a claim ›How we measure confidence ›How we check this ›
Are you an author, or do you see a problem with this page? Request a review
How to cite
Cite CoChat for the checks on this page, and the paper for its own findings.
- This page
- CoChat. (2026). Citation check: Urinary CE-MS peptide marker pattern for detection of solid tumors. https://app.cochat.ai/papers/10.1038/s41598-018-23585-y
- The paper
- Belczacka, I., Latosinska, A., Siwy, J., Metzger, J., Merseburger, A. S., Mischak, H., Vlahou, A., Frantzi, M., & Jankowski, V. (2018). Urinary CE-MS peptide marker pattern for detection of solid tumors. Scientific Reports. https://doi.org/10.1038/s41598-018-23585-y
Data sources
Bibliographic data: Semantic Scholar, OpenAlex, Crossref.
Contains information from the Semantic Scholar Academic Graph Datasets, made available under the ODC Attribution License (ODC-BY 1.0).
Semantic Scholar’s data is described in: Kinney, R., et al. (2023). The Semantic Scholar Open Data Platform. arXiv:2301.10140.
