Student or educator? Sign up with your school email and get 6 months of Pro free.
CoChat

The DOI matches its Crossref record; 42 of the 42 references it cites were found in a registry or an index.

Touchscreen typing-pattern analysis for detecting fine motor skills decline in early-stage Parkinson's disease

Open access

Abstract

Parkinson’s disease (PD) is a degenerative movement disorder causing progressive disability that severely affects patients’ quality of life. While early treatment can produce significant benefits for patients, the mildness of many early signs combined with the lack of accessible high-frequency monitoring tools may delay clinical diagnosis. To meet this need, user interaction data from consumer technologies have recently been exploited towards unsupervised screening for PD symptoms in daily life. Similarly, this work proposes a method for detecting fine motor skills decline in early PD patients via analysis of patterns emerging from finger interaction with touchscreen smartphones during natural typing. Our approach relies on low-/higher-order statistical features of keystrokes timing and pressure variables, computed from short typing sessions. Features are fed into a two-stage multi-model classification pipeline that reaches a decision on the subject’s status (PD patient/control) by gradually fusing prediction probabilities obtained for individual typing sessions and keystroke variables. This method achieved an AUC = 0.92 and 0.82/0.81 sensitivity/specificity (matched groups of 18 early PD patients/15 controls) with discriminant features plausibly correlating with clinical scores of relevant PD motor symptoms. These findings suggest an improvement over similar approaches, thereby constituting a further step towards unobtrusive early PD detection from routine activities.

Overview

The claims and statistics of this paper haven’t been checked yet.

Free: it reads the open-access text and checks the first 5 claims that cite a source we can check. Create a free account to check every claim.

A few free checks a day · papers already verified open instantly · results are public

Integrity signals

Registry

Crossref · 10.1038/s41598-018-25999-0

Cites

42 of 42 references verified0 citation errors · 0 not checkable

Statistics

Figures

Figure 1 Illustration of (a) feature vector extraction from a given keystroke dynamics variable of a typing session and (b) classification pipeline of each subject based on hold time (HT), normalised flight time (NFT) and pressure (NP) information. (a) Given a keystroke dynamics variable sequence an, a ∈ {HT, NFT, NP}: (1) The sequence is split in subsequences anⁱ using 15-seconds non-overlapping time windows; (2) For each subsequence, the first- up to fourth-order statistical moments (mean μi, standard deviation σi, kurtosis Ki, and skewness Si) of the elements are computed; (3) The probability density function (PDF) f i(x) of each subsequence is estimated through kernel density estimation (KDE) and the matrix of sample covariance C(i, j) between the PDFs of all subsequences is calculated. Feature vectors va representing each typing session are formed by the mean •– and standard deviation (std) σ⋅ of the moments extracted in (2), across time windows (subsequences), and the mean, std and sum of absolute values of the upper triangle CU(i, j) of the covariance matrix calculated in (3). (b) The proposed two-stage multi-model pipeline for classifying subjects as PD patients or healthy controls: (1st Stage) Feature vector sets {va} of a given subject, with each vector representing a typing session, serve as input to three trained models Ma, each one dedicated to a keystroke dynamics variable, a ∈ {NFT, HT, NP}. Models Ma yield three prediction probabilities Pa which are then grouped in new feature vectors vP; (2nd Stage) Feature vector set {vP} serves as input to a Logistic Regression classifier CLR that outputs the final classification probabilities {Pf} denoting whether each typing session belongs to a PD patient or a healthy control. Finally, the mean of prediction probabilities Pf is used to categorise the subject as PD patient or healthy control.
Figure 1 Illustration of (a) feature vector extraction from a given keystroke dynamics variable of a typing session and (b) classification pipeline of each subject based on hold time (HT), normalised flight time (NFT) and pressure (NP) information. (a) Given a keystroke dynamics variable sequence an, a ∈ {HT, NFT, NP}: (1) The sequence is split in subsequences anⁱ using 15-seconds non-overlapping time windows; (2) For each subsequence, the first- up to fourth-order statistical moments (mean μi, standard deviation σi, kurtosis Ki, and skewness Si) of the elements are computed; (3) The probability density function (PDF) f i(x) of each subsequence is estimated through kernel density estimation (KDE) and the matrix of sample covariance C(i, j) between the PDFs of all subsequences is calculated. Feature vectors va representing each typing session are formed by the mean •– and standard deviation (std) σ⋅ of the moments extracted in (2), across time windows (subsequences), and the mean, std and sum of absolute values of the upper triangle CU(i, j) of the covariance matrix calculated in (3). (b) The proposed two-stage multi-model pipeline for classifying subjects as PD patients or healthy controls: (1st Stage) Feature vector sets {va} of a given subject, with each vector representing a typing session, serve as input to three trained models Ma, each one dedicated to a keystroke dynamics variable, a ∈ {NFT, HT, NP}. Models Ma yield three prediction probabilities Pa which are then grouped in new feature vectors vP; (2nd Stage) Feature vector set {vP} serves as input to a Logistic Regression classifier CLR that outputs the final classification probabilities {Pf} denoting whether each typing session belongs to a PD patient or a healthy control. Finally, the mean of prediction probabilities Pf is used to categorise the subject as PD patient or healthy control.CC BY · PubMed Central
Figure 2 Indicative examples of keystroke dynamics variable sequences of healthy controls and PD patients. Sequences of normalised flight time (NFT) (blue), hold time (HT) (green), and normalised pressure (NP) (red) derived from 10 typing sessions (S1–S10), typed by two controls (Control 1 and Control 2) and two PD patients (PD Patient 1 and PD Patient 2), are presented along with overlayed probability density functions of each sequence, estimated for each typing session. Between two consecutive sessions, there was an one-minute interval. It is observed that controls exhibit similar behaviour across all variables. On the other hand, there are differentiations in the behaviour of PD patients when compared to each other, as well as healthy subjects. PD Patient 1 exhibits similar values to controls in terms of NFT and NP, but clearly higher HT values. In contrast, PD Patient 2 produced more wide-spread values for all keystroke dynamics variables in comparison to controls.
Figure 2 Indicative examples of keystroke dynamics variable sequences of healthy controls and PD patients. Sequences of normalised flight time (NFT) (blue), hold time (HT) (green), and normalised pressure (NP) (red) derived from 10 typing sessions (S1–S10), typed by two controls (Control 1 and Control 2) and two PD patients (PD Patient 1 and PD Patient 2), are presented along with overlayed probability density functions of each sequence, estimated for each typing session. Between two consecutive sessions, there was an one-minute interval. It is observed that controls exhibit similar behaviour across all variables. On the other hand, there are differentiations in the behaviour of PD patients when compared to each other, as well as healthy subjects. PD Patient 1 exhibits similar values to controls in terms of NFT and NP, but clearly higher HT values. In contrast, PD Patient 2 produced more wide-spread values for all keystroke dynamics variables in comparison to controls.CC BY · PubMed Central
Figure 3 Comparison of Receiver Operating Characteristics (ROC) curves and evolution of area under the ROC curve (AUC) with respect to the number of typing sessions used as input. (a) ROC curves demonstrating the classification performance of the proposed approach and of existing ones reported in literature and applied on our dataset (18 early PD patients/15 controls). The performance of the proposed model (green curve) is compared to the best multivariate method based on flight time (FT) features proposed by Arroyo-Gallego et al.27 (blue curve), as well as their best performing univariate method (red curve). Solid lines represent the mean ROC curve, while shadowed areas delimit the 95% confidence intervals, computed over 1,000 bootstraps. The legend shows the AUC and the 95% confidence intervals. The two-stage multi-model approach described in this paper achieves an AUC of 0.92 [0.82–0.98], outperforming the univariate 0.70 [0.53–0.85] and multivariate 0.82 [0.69–0.94] methods27. (b) Evolution of the AUC for the best performing configuration of the proposed classification pipeline with respect to the number of typing sessions used as input. The blue and green line correspond to the AUC obtained by using the mean and median of final classification probabilities {Pf}, respectively, as the voting scheme to reach a decision on whether the subject has PD or not based on her/his individually classified typing sessions (see also Fig. 1(b)). As intuitively expected, as the number of typing sessions increases, a clear improvement in the classification performance is noticed, while the mean of probabilities produces better results compared to the median value.
Figure 3 Comparison of Receiver Operating Characteristics (ROC) curves and evolution of area under the ROC curve (AUC) with respect to the number of typing sessions used as input. (a) ROC curves demonstrating the classification performance of the proposed approach and of existing ones reported in literature and applied on our dataset (18 early PD patients/15 controls). The performance of the proposed model (green curve) is compared to the best multivariate method based on flight time (FT) features proposed by Arroyo-Gallego et al.27 (blue curve), as well as their best performing univariate method (red curve). Solid lines represent the mean ROC curve, while shadowed areas delimit the 95% confidence intervals, computed over 1,000 bootstraps. The legend shows the AUC and the 95% confidence intervals. The two-stage multi-model approach described in this paper achieves an AUC of 0.92 [0.82–0.98], outperforming the univariate 0.70 [0.53–0.85] and multivariate 0.82 [0.69–0.94] methods27. (b) Evolution of the AUC for the best performing configuration of the proposed classification pipeline with respect to the number of typing sessions used as input. The blue and green line correspond to the AUC obtained by using the mean and median of final classification probabilities {Pf}, respectively, as the voting scheme to reach a decision on whether the subject has PD or not based on her/his individually classified typing sessions (see also Fig. 1(b)). As intuitively expected, as the number of typing sessions increases, a clear improvement in the classification performance is noticed, while the mean of probabilities produces better results compared to the median value.CC BY · PubMed Central
Figure 4 Group-wise comparison of distributions of the most frequently selected features as derived by the proposed approach. Box plots represent the distribution of HT μi¯, HT σi¯, NFT Si¯, NP μi¯ (see also Table 1) of PD patients and healthy controls, computed over 144 and 131 typing sessions, respectively. Each box plot visualises the interquartile range (height of rectangle), spanning the first (bottom) to the third quartile (top), the median value (horizontal line inside the rectangle), the minimum and maximum values (ends of “whiskers” below and above the box, respectively) still within the interquartile range, and outlier values (individual points below and above “whiskers”). The groups exhibit significant differences (two-sided Mann-Whitney U test) across all features of interest. **Statistically significant difference (p < 0.001).
Figure 4 Group-wise comparison of distributions of the most frequently selected features as derived by the proposed approach. Box plots represent the distribution of HT μi¯, HT σi¯, NFT Si¯, NP μi¯ (see also Table 1) of PD patients and healthy controls, computed over 144 and 131 typing sessions, respectively. Each box plot visualises the interquartile range (height of rectangle), spanning the first (bottom) to the third quartile (top), the median value (horizontal line inside the rectangle), the minimum and maximum values (ends of “whiskers” below and above the box, respectively) still within the interquartile range, and outlier values (individual points below and above “whiskers”). The groups exhibit significant differences (two-sided Mann-Whitney U test) across all features of interest. **Statistically significant difference (p < 0.001).CC BY · PubMed Central
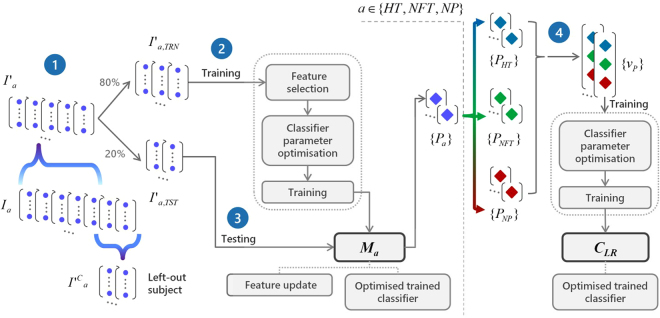
Figure 5 Training procedure of each leave-one-subject-out loop. (1) The computed Ia feature vector sets, a∈{HT,NFT,NP}, with each feature vector representing a typing session, are split in two parts, i.e., I′a and (I′)a^C (the left-out subject feature vector sets). The I′a sets are further split in two subsets, i.e., the I′a,TRN (80%) and the I′a,TST (20%). (2) The I′a,TRN subsets are used for feature selection, hyper parameter optimisation using an inner 4-fold cross-validation, and training of three classifiers, resulting in three independent models Ma, each one dedicated to a specific keystroke dynamics variable (HT, NFT and NP). (3) The I′a,TST subsets are then used to test the three Ma models, resulting in three classification probabilities sets {Pa}, a∈{HT,NFT,NP}. (4) Sets {PHT}, {PNFT}, and {PNP} are fused in single feature vectors, forming a set {vP} that serves to optimise (as in (2)) and train a Logistic Regression classifier CLR. The end product of the training procedure is a configuration of three optimised/trained models (first stage) that independently classify each typing session according to each keystroke dynamics variable, and an optimised/trained Logistic Regression classifier (second stage) that aggregates the latter decisions to reach a final verdict on whether the typing session belongs to a PD patient or not. The latter two-stage configuration is tested using the left-out subject’s (I′)a^C sets (see also Fig. 1(b)).
Figure 5 Training procedure of each leave-one-subject-out loop. (1) The computed Ia feature vector sets, a∈{HT,NFT,NP}, with each feature vector representing a typing session, are split in two parts, i.e., I′a and (I′)a^C (the left-out subject feature vector sets). The I′a sets are further split in two subsets, i.e., the I′a,TRN (80%) and the I′a,TST (20%). (2) The I′a,TRN subsets are used for feature selection, hyper parameter optimisation using an inner 4-fold cross-validation, and training of three classifiers, resulting in three independent models Ma, each one dedicated to a specific keystroke dynamics variable (HT, NFT and NP). (3) The I′a,TST subsets are then used to test the three Ma models, resulting in three classification probabilities sets {Pa}, a∈{HT,NFT,NP}. (4) Sets {PHT}, {PNFT}, and {PNP} are fused in single feature vectors, forming a set {vP} that serves to optimise (as in (2)) and train a Logistic Regression classifier CLR. The end product of the training procedure is a configuration of three optimised/trained models (first stage) that independently classify each typing session according to each keystroke dynamics variable, and an optimised/trained Logistic Regression classifier (second stage) that aggregates the latter decisions to reach a final verdict on whether the typing session belongs to a PD patient or not. The latter two-stage configuration is tested using the left-out subject’s (I′)a^C sets (see also Fig. 1(b)).CC BY · PubMed Central

Verification

Claims the paper makes

The claims and statistics of this paper haven’t been checked yet.

Free: it reads the open-access text and checks the first 5 claims that cite a source we can check. Create a free account to check every claim.

A few free checks a day · papers already verified open instantly · results are public

Claims other papers make about this one

Each is checked against this paper’s own text: does it say what the citing paper says it does?

Self-check

Percentages, sums and reported differences re-computed from the paper’s own numbers.

The self-check needs the paper’s full text.

Citations

Cites

Show all 42 references

Research works printed but not linked: 1

  1. Ng, A. Feature selection, L1 vs. L2 regularization, and rotational invariance. In Proceedings of the twenty-first international conference on Machine learning (ACM 2004).

Cited by

See all 92

Metadata

Authors
Iakovakis, D., Hadjidimitriou, S., Charisis, V., Bostantzopoulou, S., Katsarou, Z., & Hadjileontiadis, L. J.
Affiliations
  • Aristotle University of Thessaloniki (GR)
  • G. Papanikolaou General Hospital (GR)
  • Ippokrateio General Hospital of Thessaloniki (GR)
  • Khalifa University of Science and Technology (AE)
Corresponding author
Hadjileontiadis, Leontios J.
Venue
Scientific Reports
Published
2018-05-16
Volume
8
Issue
1
Pages
7663-7663
ISSN
2045-2322 (ISSN-L)
OpenAlex
W2807561669
Cited by
92
References
42
Citations by year
2026: 13 · 2025: 10 · 2024: 12 · 2023: 9 · 2022: 16 · 2021: 7 · 2020: 16 · 2019: 7 · 2018: 1
FWCI
3.88
Type
journal article
Language
en
Open access
Licence
Locations
  • Scientific Reports (publishedVersion, cc-by)
  • Europe PMC (PubMed Central) (publishedVersion, other-oa)
  • PubMed Central (publishedVersion, cc-by)
  • PubMed (publishedVersion)
  • DOAJ (DOAJ: Directory of Open Access Journals) (submittedVersion)
Funders
European Commission (690494, HORIZON2020)
Topics
  • Physical Sciences › Computer Science › Computer Vision and Pattern Recognition › Context-Aware Activity Recognition Systems
  • Health Sciences › Health Professions › Health Information Management › Artificial Intelligence in Healthcare
  • Physical Sciences › Computer Science › Information Systems › User Authentication and Security Systems
Keywords
Parkinson's disease, early detection, keystroke dynamics, keystroke timing, motor symptoms
MeSH terms
Smartphone, Diagnosis, Computer-Assisted, Female, Fingers, Humans, Male, Middle Aged, Motor Skills, Movement Disorders, Parkinson Disease, Pattern Recognition, Automated, Quality of Life, Case-Control Studies

About these checks

Registry, retraction, Cites and statistics results are computed, not judged, with one exception: a printed reference that no index lists is read once by a model before it counts as a citation error. Claims are extracted by a model and kept only when their quote appears verbatim in the text; each cited source is then checked, with a model’s help, for whether it says what the claim relies on. Those verdicts can be wrong — read the claim’s quote and the cited source before relying on one.

Statistics and arithmetic are recomputed, not judged.

Confidence bands are shown only for fields calibrated on our annotated test set. None is calibrated yet, so no band is shown.

What counts as a claim ›How we measure confidence ›How we check this ›

Are you an author, or do you see a problem with this page? Request a review

How to cite

Cite CoChat for the checks on this page, and the paper for its own findings.

This page
CoChat. (2026). Citation check: Touchscreen typing-pattern analysis for detecting fine motor skills decline in early-stage Parkinson's disease. https://app.cochat.ai/papers/10.1038/s41598-018-25999-0
The paper
Iakovakis, D., Hadjidimitriou, S., Charisis, V., Bostantzopoulou, S., Katsarou, Z., & Hadjileontiadis, L. J. (2018). Touchscreen typing-pattern analysis for detecting fine motor skills decline in early-stage Parkinson's disease. Scientific Reports. https://doi.org/10.1038/s41598-018-25999-0

Data sources

Bibliographic data: Semantic Scholar, OpenAlex, Crossref.

Contains information from the Semantic Scholar Academic Graph Datasets, made available under the ODC Attribution License (ODC-BY 1.0).

Semantic Scholar’s data is described in: Kinney, R., et al. (2023). The Semantic Scholar Open Data Platform. arXiv:2301.10140.