

The DOI matches its Crossref record; 6 of the 6 references it cites were found in a registry or an index.
Close inbreeding and low genetic diversity in Inner Asian human populations despite geographical exogamy
Abstract
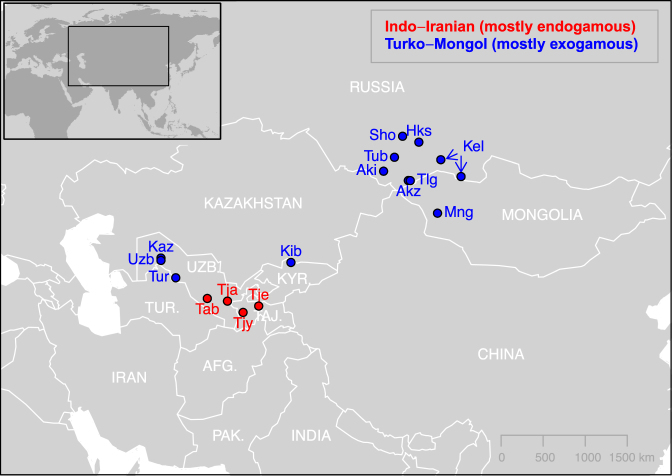
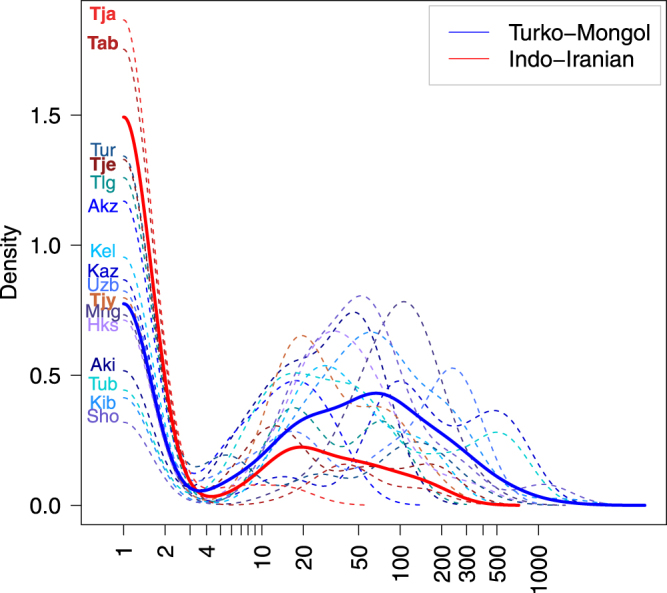
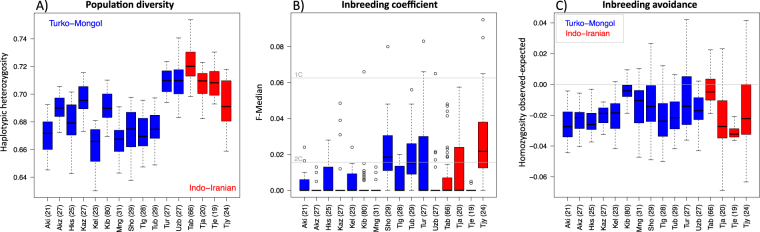
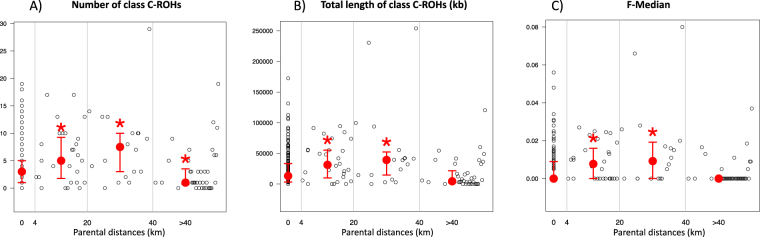
When closely related individuals mate, they produce inbred offspring, which often have lower fitness than outbred ones. Geographical exogamy, by favouring matings between distant individuals, is thought to be an inbreeding avoidance mechanism; however, no data has clearly tested this prediction. Here, we took advantage of the diversity of matrimonial systems in humans to explore the impact of geographical exogamy on genetic diversity and inbreeding. We collected ethno-demographic data for 1,344 individuals in 16 populations from two Inner Asian cultural groups with contrasting dispersal behaviours (Turko-Mongols and Indo-Iranians) and genotyped genome-wide single nucleotide polymorphisms in 503 individuals. We estimated the population exogamy rate and confirmed the expected dispersal differences: Turko-Mongols are geographically more exogamous than Indo-Iranians. Unexpectedly, across populations, exogamy patterns correlated neither with the proportion of inbred individuals nor with their genetic diversity. Even more surprisingly, among Turko-Mongols, descendants from exogamous couples were significantly more inbred than descendants from endogamous couples, except for large distances (>40 km). Overall, 37% of the descendants from exogamous couples were closely inbred. This suggests that in Inner Asia, geographical exogamy is neither efficient in increasing genetic diversity nor in avoiding inbreeding, which might be due to kinship endogamy despite the occurrence of dispersal.
Overview
The claims and statistics of this paper haven’t been checked yet.
Run the check — free, no account needed. It reads the open-access text and checks the sources it cites.
Integrity signals
Registry
Cites
Statistics
Figures
Verification
Claims the paper makes
The claims and statistics of this paper haven’t been checked yet.
Run the check — free, no account needed. It reads the open-access text and checks the sources it cites.
Claims other papers make about this one
Each is checked against this paper’s own text: does it say what the citing paper says it does?
In the citing paper
“Whereas R1b is virtually absent in modern Mongolic and Turkic speakers of Central Eurasia, while its sister branch, R1a (to be specific, R1a1a), is found in many Mongolic and Turkic speakers, albeit at low frequencies, except for some groups, such as Mongolic-speaking Dongxiang63 and Turkic-speaking Altaians (65) and Kirghiz (67).”
From Genomes of the Golden Horde elites and their implications for the rulers of the Mongol Empire (2026) · cites this paper as [63]
Self-check
Percentages, sums and reported differences re-computed from the paper’s own numbers.
The self-check needs the paper’s full text.
Citations
Cites
Runs of homozygosity: windows into population history and trait architecture
Ceballos, F. C., Joshi, P. K., Clark, D. W., Ramsay, M., & Wilson, J. F. (2018) · Nature Reviews Genetics · doi:10.1038/nrg.2017.109 · Cited by 1,006
Betulin Is a Potent Anti-Tumor Agent that Is Enhanced by Cholesterol
Mullauer, F. B., Kessler, J. H., & Medema, J. P. (2009) · PLoS ONE · doi:10.1371/journal.pone.0005361 · Cited by 688
Mountain gorilla genomes reveal the impact of long-term population decline and inbreeding
Xue, Y., Prado-Martinez, J., Sudmant, P. H., Narasimhan, V., Ayub, Q., Szpak, M., Frandsen, P., Chen, Y., Yngvadottir, B., Cooper, D. N., et al. (2015) · Science · doi:10.1126/science.aaa3952 · Cited by 473
An Estimate of the Average Number of Recessive Lethal Mutations Carried by Humans
Gao, Z., Waggoner, D., Stephens, M., Ober, C., & Przeworski, M. (2015) · Genetics · doi:10.1534/genetics.114.173351 · Cited by 109
Moresi, V., Garcia-Alvarez, G., Pristerà, A., Rizzuto, E., Albertini, M. C., Rocchi, M., Marazzi, G., Sassoon, D., Adamo, S., & Coletti, D. (2009) · PLoS ONE · doi:10.1371/journal.pone.0005570 · Cited by 60
Sex‐specific genetic diversity is shaped by cultural factors in Inner Asian human populations
Marchi, N., Hegay, T., Mennecier, P., Georges, M., Laurent, R., Whitten, M., Endicott, P., Aldashev, A., Dorzhu, C., Nasyrova, F., et al. (2017) · American Journal of Physical Anthropology · doi:10.1002/ajpa.23151 · Cited by 38
Self-citation
Research works printed but not linked: 68
- Bittles, A. Consanguinity and its relevance to clinical genetics. Clinical Genetics 60, 89–98 (2008). · DOI
- Pemberton, T. J. et al. Genomic patterns of homozygosity in worldwide human populations. American Journal of Human Genetics 91, 275–292 (2012). · DOI
- Gazal, S., Sahbatou, M., Babron, M.-C., Génin, E. & Leutenegger, A.-L. High level of inbreeding in final phase of 1000 Genomes Project. Scientific Reports 5, 1–7 (2015). · DOI
- Woods, C. G. et al. Quantification of homozygosity in consanguineous individuals with autosomal recessive disease. American journal of human genetics 78, 889–896 (2006). · DOI · Paper page
- Li, L.-H. et al. Long contiguous stretches of homozygosity in the human genome. Human Mutation 27, 1115–1121 (2006). · DOI
- Mitton, J. B. In The Natural History of Inbreeding and Outbreeding: Theoretical and Empirical Perspectives 17–41 (University of Chicago Press, 1993).
- Charlesworth, D. & Willis, J. H. The genetics of inbreeding depression. Nature Reviews Genetics 10, 783–796 (2009). · DOI
- Robert, A., Toupance, B., Tremblay, M. & Heyer, E. Impact of inbreeding on fertility in a pre-industrial population. European Journal of Human Genetics 17, 673–681 (2009). · DOI
- Pusey, A. & Wolf, M. Inbreeding avoidance in animals. Trends in Ecology & Evolution 11, 201–206 (1996). · DOI
- Fareed, M., Ahmad, M. K., Azeem Anwar, M. & Afzal, M. Impact of consanguineous marriages and degrees of inbreeding on fertility, child mortality, secondary sex ratio, selection intensity and genetic load: a cross-sectional study from Northern India. Pediatric Research. https://doi.org/10.1038/pr.2016.177 (2016). · DOI
- Pedersen, J. The influence of consanguineous marriage on infant and child mortality among palestinians in the West Bank and Gaza, Jordan, Lebanon and Syria. Community Genetics 5, 178–181 (2002). · DOI
- Charlesworth, D. Effects of inbreeding on the genetic diversity of populations. Philosophical Transactions of the Royal Society of London B: Biological Sciences 358, 1051–1070 (2003). · DOI
- Spielman, D., Brook, B. W. & Briscoe, D. A. & Frankham, R. Does inbreeding and loss of genetic diversity reduce disease resistance? Conservation Genetics 5, 439–448 (2004). · DOI
- Frankham, R. Genetics and extinction. Biological Conservation 126, 131–140 (2005). · DOI
- Saccheri, I. et al. Inbreeding and extinction in a butterfly metapopulation. Nature 392, 491–494 (1998). · DOI
- Ubbink, G. J., van de Broek, J., Hazewinkel, H. A. & Rothuizen, J. Cluster analysis of the genetic heterogeneity and disease distributions in purebred dog populations. The Veterinary record 142, 209–13 (1998). · DOI
- Keller, L. & Waller, D. M. Inbreeding effects in wild populations. Trends in Ecology & Evolution 17, 230–241 (2002). · DOI
- Moreno, E., Pérez-González, J., Carranza, J. & Moya-Laraño, J. Better Fitness in Captive Cuvier’s Gazelle despite Inbreeding Increase: Evidence of Purging? PLOS ONE 10(1–15), e0145111 (2015). · DOI
- Firman, R. C. & Simmons, L. W. Gametic interactions promote inbreeding avoidance in house mice. Ecology Letters 18, 937–943 (2015). · DOI
- Holmes, W. G. & Sherman, P. W. The Ontogeny of Kin Recognition in Two Species of Ground Squirrels. American Zoologist 22, 491–517 (1982). · DOI
- Hepper, P. G. Kin Recognition: Functions and Mechanisms a Review. Biological Reviews 61, 63–93 (1986). · DOI
- Wolf, A. P. Childhood Association and Sexual Attraction: A Further Test of the Westermarck Hypothesis. American Anthropologist 72, 503–515 (1970). · DOI
- Hauber, M. E. & Sherman, P. W. Self-referent phenotype matching: Theoretical considerations and empirical evidence. Trends in Neurosciences 24, 609–616 (2001). · DOI
- Pfefferle, D., Kazem, A. J. N., Brockhausen, R. R., Ruiz-Lambides, A. V. & Widdig, A. Monkeys Spontaneously Discriminate Their Unfamiliar Paternal Kin under Natural Conditions Using Facial Cues. Current Biology 24, 1806–1810 (2014). · DOI
- Levréro, F. et al. Social shaping of voices does not impair phenotype matching of kinship in mandrills. Nature Communications 6, 1–7 (2015). · DOI
- Crepy, M. A. & Casal, J. J. Kin recognition by self-referent phenotype matching in plants. New Phytologist 209, 15–16 (2016). · DOI
- DeBruine, L. M., Jones, B. C., Little, A. C. & Perrett, D. I. Social perception of facial resemblance in humans. Archives of Sexual Behavior 37, 64–77 (2008). · DOI
- Laurent, R. & Chaix, R. MHC-dependent mate choice in humans: Why genomic patterns from the HapMap European American dataset support the hypothesis. BioEssays 34, 267–271 (2012). · DOI
- Green, J. P. et al. The Genetic Basis of Kin Recognition in a Cooperatively Breeding Mammal. Current Biology 25, 2631–2641 (2015). · DOI
- Hoogland, J. L. Prairie Dogs Avoid Extreme Inbreeding. Science 215, 1639–1641 (1982). · DOI
- Ronce, O. How does it feel to be like a rolling stone? Ten questions about dispersal evolution. Annual Review of Ecology, Evolution, and Systematics 38, 231–253 (2007). · DOI
- Lambin, X. Natal Philopatry, Competition for Resources, and Inbreeding Avoidance in Townsend’s Voles (Microtus Townsendii). Ecology 75, 224–235 (1994). · DOI
- Pusey, A. E. & Packer, C. The Evolution of Sex-Biased Dispersal in Lions. Behaviour 101, 275–310 (1987). · DOI
- Pusey, A. In Pedophilia 201–220, https://doi.org/10.1007/978-1-4613-9682-6_8 (Springer New York, 1990). · DOI
- Bradley, B. J., Doran-Sheehy, D. M. & Vigilant, L. Potential for female kin associations in wild western gorillas despite female dispersal. Proceedings. Biological sciences/The Royal Society 274, 2179–85 (2007). · DOI · Paper page
- Fix, A. G. Migration and colonization in human microevolution. at http://dx.doi.org/10.1002/1520-6300(200102/03)13:2%3C280::AID-AJHB1040%3E3.0.CO;2-6 (Cambridge University Press, 1999). · DOI
- McQuillan, R. et al. Runs of Homozygosity in European Populations. The American Journal of Human Genetics 83, 359–372 (2008). · DOI
- Ims, R. a. & Yoccoz, N. G. In Metapopulation Biology 247–265, https://doi.org/10.1016/B978-012323445-2/50015-8 (Elsevier, 1997). · DOI
- Krader, L. Peoples of Central Asia, 2nd edition. Indiana University Publications, Bloomington 26 (1966).
- Stoneking, M. Single nucleotide polymorphisms: From the evolutionary past. Nature 409, 821–822 (2001). · DOI
- Martínez-Cruz, B. et al. In the heartland of Eurasia: the multilocus genetic landscape of Central Asian populations. European Journal of Human Genetics 19, 216–223 (2011). · DOI
- Conrad, D. F. et al. A worldwide survey of haplotype variation and linkage disequilibrium in the human genome. Nature genetics 38, 1251–1260 (2006). · DOI
- Pemberton, T. J. & Rosenberg, N. A. Population-Genetic Influences on Genomic Estimates of the Inbreeding Coefficient: A Global Perspective. Human Heredity 77, 37–48 (2014). · DOI
- Palstra, F. P., Heyer, E. & Austerlitz, F. Statistical Inference on Genetic Data Reveals the Complex Demographic History of Human Populations in Central Asia. Molecular Biology and Evolution 32, 1411–1424 (2015). · DOI · Paper page
- Leutenegger, A.-L. et al. Estimation of the Inbreeding Coefficient through Use of Genomic Data. The American Journal of Human Genetics 73, 516–523 (2003). · DOI
- Gazal, S., Sahbatou, M., Babron, M.-C., Génin, E. & Leutenegger, A.-L. FSuite: exploiting inbreeding in dense SNP chip and exome data. Bioinformatics 30, 1940–1941 (2014). · DOI
- Leutenegger, A.-L., Sahbatou, M., Gazal, S., Cann, H. & Génin, E. Consanguinity around the world: what do the genomic data of the HGDP-CEPH diversity panel tell us? European Journal of Human Genetics 19, 583–587 (2011). · DOI
- Gibson, J., Morton, N. E. & Collins, A. Extended tracts of homozygosity in outbred human populations. Human Molecular Genetics 15, 789–795 (2006). · DOI
- Joshi, P. K. et al. Directional dominance on stature and cognition in diverse human populations. Nature 523, 459–62 (2015). · DOI
- Kirin, M. et al. Genomic Runs of Homozygosity Record Population History and Consanguinity. PLoS ONE 5(1–7), e13996 (2010). · DOI
- Purcell, S. et al. PLINK: A Tool Set for Whole-Genome Association and Population-Based Linkage Analyses. The American Journal of Human Genetics 81, 559–575 (2007). · DOI · Paper page
- Al-Gazali, L., Hamamy, H. & Al-Arrayad, S. Genetic disorders in the Arab world. BMJ (Clinical research ed.) 333, 831–834 (2006). · DOI
- Shami, S. A., Schmitt, L. H. & Bittles, A. H. Consanguinity related prenatal and postnatal mortality of the populations of seven Pakistani Punjab cities. Journal of Medical Genetics 26, 267–271 (1989). · DOI
- Thompson, E. A. & Roberts, D. F. Kinship structure and heterozygosity on Tristan da Cunha. American journal of human genetics 32, 445–52 (1980).
- Kaplanis, J. et al. Quantitative analysis of population-scale family trees with millions of relatives. 9309, 1–12 (2018). · DOI
- Marks, S. J., Levy, H., Martinez-Cadenas, C., Montinaro, F. & Capelli, C. Migration distance rather than migration rate explains genetic diversity in human patrilocal groups. Molecular Ecology 21, 4958–4969 (2012). · DOI
- Boyce, A. J., Küchemann, C. F. & Harrison, G. A. Neighbourhood knowledge and the distribution of marriage distances. Annals of Human Genetics 30, 335–338 (1967). · DOI
- Wright, S. Isolation by distance under diverse systems of mating. Genetics 31, 39–59 (1946). · DOI
- Murdock, G. P. Ethnographic Atlas: A Summary. Ethnology 6, 109–236 (1967). · DOI
- Roy-Gagnon, M. H. et al. Genomic and genealogical investigation of the French Canadian founder population structure. Human Genetics 129, 521–531 (2011). · DOI
- Colonna, V. et al. Comparing population structure as inferred from genealogical versus genetic information. European Journal of Human Genetics 17, 1635–1641 (2009). · DOI
- Génin, E. & Todorov, A. A. In Encyclopedia of Life Sciences 1–5, https://doi.org/10.1038/npg.els.0005407 (John Wiley & Sons, Ltd, 2006). · DOI
- Redden, D. T. & Allison, D. B. The Effect of Assortative Mating upon Genetic Association Studies: Spurious Associations and Population Substructure in the Absence of Admixture. Behavior Genetics 36, 678–686 (2006). · DOI
- Larmuseau, M. H. D., Van Geystelen, A., van Oven, M. & Decorte, R. Genetic genealogy comes of age: Perspectives on the use of deep-rooted pedigrees in human population genetics. American Journal of Physical Anthropology 150, 505–511 (2013). · DOI · Paper page
- Sebro, R. & Risch, N. J. A brief note on the resemblance between relatives in the presence of population stratification. Heredity 108, 563–568 (2012). · DOI
- Mountain, J. L. & Cavalli-Sforza, L. L. Multilocus genotypes, a tree of individuals, and human evolutionary history. American journal of human genetics 61, 705–18 (1997). · DOI
- Verdu, P. et al. Patterns of Admixture and Population Structure in Native Populations of Northwest North America. PLoS Genetics 10(1–17), e1004530 (2014). · DOI
- Scrucca, L., Fop, M., Murphy, T. B. & Raftery, A. E. mclust 5: Clustering, Classification and Density Estimation Using Gaussian Finite Mixture Models. The R journal 8, 289–317 (2016). · DOI
Cited by
Genomes of the Golden Horde elites and their implications for the rulers of the Mongol Empire
Askapuli, A., Kanzawa-Kiriyama, H., Kakuda, T., Kassenali, A., Yessen, S., Schamiloglu, U., Schrodi, S. J., Hawks, J., & Saitou, N. (2026) · Proceedings of the National Academy of Sciences · doi:10.1073/pnas.2531003123 · Cited by 5
Metadata
- Authors
- Marchi, N., Mennecier, P., Georges, M., Lafosse, S., Hegay, T., Dorzhu, C., Chichlo, B., Ségurel, L., & Heyer, E.
- ORCID
- Marchi, Nina
- Venue
- Scientific Reports
- Published
- 2018-06-20
- Volume
- 8
- Issue
- 1
- ISSN
- 2045-2322
- PMC
- PMC6010435
- Cited by
- 33
- References
- 6
- Language
- en
About these checks
Registry, retraction, Cites and statistics results are computed, not judged, with one exception: a printed reference that no index lists is read once by a model before it counts as a citation error. Claims are extracted by a model and kept only when their quote appears verbatim in the text; each cited source is then checked, with a model’s help, for whether it says what the claim relies on. Those verdicts can be wrong — read the claim’s quote and the cited source before relying on one.
Statistics and arithmetic are recomputed, not judged.
Confidence bands are shown only for fields calibrated on our annotated test set. None is calibrated yet, so no band is shown.
What counts as a claim ›How we measure confidence ›How we check this ›
Are you an author, or do you see a problem with this page? Request a review
How to cite
Cite CoChat for the checks on this page, and the paper for its own findings.
- This page
- CoChat. (2026). Citation check: Close inbreeding and low genetic diversity in Inner Asian human populations despite geographical exogamy. https://app.cochat.ai/papers/10.1038/s41598-018-27047-3
- The paper
- Marchi, N., Mennecier, P., Georges, M., Lafosse, S., Hegay, T., Dorzhu, C., Chichlo, B., Ségurel, L., & Heyer, E. (2018). Close inbreeding and low genetic diversity in Inner Asian human populations despite geographical exogamy. Scientific Reports. https://doi.org/10.1038/s41598-018-27047-3
