

The DOI matches its Crossref record; 35 of the 35 references it cites were found in a registry or an index.
Combined quantification of intracellular (phospho-)proteins and transcriptomics from fixed single cells
Open accessPublished version of a preprint
Abstract
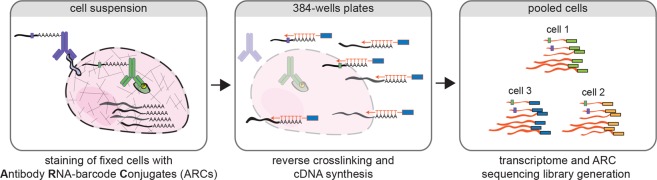
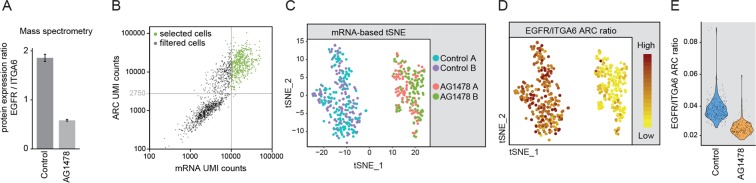
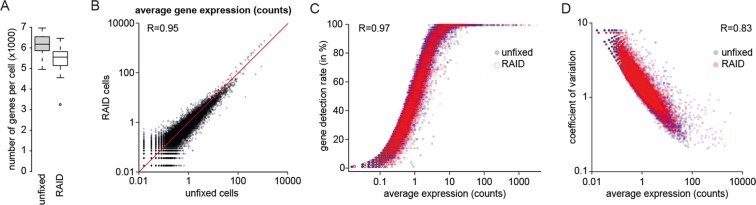
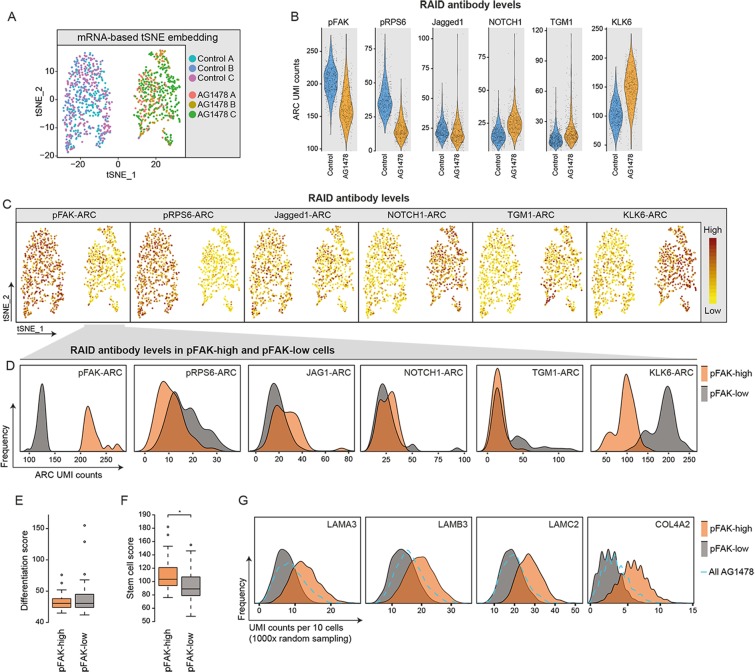
Environmental stimuli often lead to heterogeneous cellular responses and transcriptional output. We developed single-cell RNA and Immunodetection (RAID) to allow combined analysis of the transcriptome and intracellular (phospho-)proteins from fixed single cells. RAID successfully recapitulated differentiation-state changes at the protein and mRNA level in human keratinocytes. Furthermore, we show that differentiated keratinocytes that retain high phosphorylated FAK levels, a feature associated with stem cells, also express a selection of stem cell associated transcripts. Our data demonstrates that RAID allows investigation of heterogeneous cellular responses to environmental signals at the mRNA and phospho-proteome level.
Overview
The claims and statistics of this paper haven’t been checked yet.
Run the check — free, no account needed. It reads the open-access text and checks the sources it cites.
Integrity signals
Registry
Cites
Statistics
Figures
Verification
Claims the paper makes
The claims and statistics of this paper haven’t been checked yet.
Run the check — free, no account needed. It reads the open-access text and checks the sources it cites.
Claims other papers make about this one
Each is checked against this paper’s own text: does it say what the citing paper says it does?
In the citing paper
“RNA and immunodetection (RAID), a method developed for immunodetection of intracellular proteins or phosphorylated proteins together with mRNA profiling, enables correlation analysis of environmental stimuli with heterogeneous cellular responses77.”
From The technological landscape and applications of single-cell multi-omics (2023) · cites this paper as [77]
Self-check
Percentages, sums and reported differences re-computed from the paper’s own numbers.
The self-check needs the paper’s full text.
Citations
Cites
Cox, J., & Mann, M. (2008) · Nature Biotechnology · doi:10.1038/nbt.1511 · Cited by 14,855
Integrating single-cell transcriptomic data across different conditions, technologies, and species
Butler, A., Hoffman, P., Smibert, P., Papalexi, E., & Satija, R. (2018) · Nature Biotechnology · doi:10.1038/nbt.4096 · Cited by 13,174
Trapnell, C., Cacchiarelli, D., Grimsby, J., Pokharel, P., Li, S., Morse, M., Lennon, N. J., Livak, K. J., Mikkelsen, T. S., & Rinn, J. L. (2014) · Nature Biotechnology · doi:10.1038/nbt.2859 · Cited by 7,314
Highly parallel genome-wide expression profiling of individual cells using nanoliter droplets.
Macosko, E. Z., Basu, A., Satija, R., Nemesh, J., Shekhar, K., Goldman, M., Tirosh, I., Bialas, A. R., Kamitaki, N., Martersteck, E. M., et al. (2015) · Cell · doi:10.1016/j.cell.2015.05.002 · Cited by 7,110
Gene ontology analysis for RNA-seq: accounting for selection bias
Young, M. D., Wakefield, M. J., Smyth, G. K., & Oshlack, A. (2010) · Genome Biology · doi:10.1186/gb-2010-11-2-r14 · Cited by 7,107
Rappsilber, J., Mann, M., & Ishihama, Y. (2007) · Nature Protocols · doi:10.1038/nprot.2007.261 · Cited by 4,641
Droplet barcoding for single-cell transcriptomics applied to embryonic stem cells
Klein, A. M., Mazutis, L., Akartuna, I., Tallapragada, N., Veres, A., Li, V., Peshkin, L., Weitz, D. A., & Kirschner, M. W. (2015) · Cell · doi:10.1016/j.cell.2015.04.044 · Cited by 3,356
Simultaneous epitope and transcriptome measurement in single cells
Stoeckius, M., Hafemeister, C., Stephenson, W., Houck-Loomis, B., Chattopadhyay, P. K., Swerdlow, H., Satija, R., & Smibert, P. (2017) · Nature Methods · doi:10.1038/nmeth.4380 · Cited by 3,098
Regev, A., Teichmann, S. A., Lander, E. S., Amit, I., Benoist, C., Birney, E., Bodenmiller, B., Campbell, P., Carninci, P., Clatworthy, M., et al. (2017) · eLife · doi:10.7554/elife.27041 · Cited by 2,232
Massively parallel single-cell RNA-seq for marker-free decomposition of tissues into cell types
Jaitin, D. A., Kenigsberg, E., Keren-Shaul, H., Elefant, N., Paul, F., Zaretsky, I., Mildner, A., Cohen, N., Jung, S., Tanay, A., et al. (2014) · Science · doi:10.1126/science.1247651 · Cited by 1,795
The cornified envelope: a model of cell death in the skin
Candi, E., Schmidt, R., & Melino, G. (2005) · Nature Reviews Molecular Cell Biology · doi:10.1038/nrm1619 · Cited by 1,776
Tetrazine Ligation: Fast Bioconjugation Based on Inverse-Electron-Demand Diels−Alder Reactivity
Blackman, M. L., Royzen, M., & Fox, J. M. (2008) · Journal of the American Chemical Society · doi:10.1021/ja8053805 · Cited by 1,691
Regev, A., Teichmann, S. A., Lander, E. S., Amit, I., Benoist, C. O., Birney, E., Bodenmiller, B., & al, E. (2017) · Zurich Open Repository and Archive (University of Zurich) · doi:10.5167/uzh-162597 · Cited by 1,457
A Single-Cell Transcriptome Atlas of the Human Pancreas
Muraro, M. J., Dharmadhikari, G., Grün, D., Gröen, N., Dielen, T., Jansen, E., van Gurp, L., Engelse, M. A., Carlotti, F., de Koning, E. J. P., et al. (2016) · Cell Systems · doi:10.1016/j.cels.2016.09.002 · Cited by 1,307
Self-citationSingle-cell messenger RNA sequencing reveals rare intestinal cell types
Grün, D., Lyubimova, A., Kester, L., Wiebrands, K., Basak, O., Sasaki, N., Clevers, H., & van Oudenaarden, A. (2015) · Nature · doi:10.1038/nature14966 · Cited by 1,234
CEL-seq2: sensitive highly-multiplexed single-cell RNA-Seq
Hashimshony, T., Senderovich, N., Avital, G., Klochendler, A., de Leeuw, Y., Anavy, L., Gennert, D., Li, S., Livak, K. J., Rozenblatt-Rosen, O., et al. (2016) · Genome Biology · doi:10.1186/s13059-016-0938-8 · Cited by 1,125
Transcriptional Heterogeneity and Lineage Commitment in Myeloid Progenitors
Paul, F., Arkin, Y., Giladi, A., Jaitin, D. A., Kenigsberg, E., Keren-Shaul, H., Winter, D., Lara-Astiaso, D., Gury, M., Weiner, A., et al. (2015) · Cell · doi:10.1016/j.cell.2015.11.013 · Cited by 1,082
Epidermal Stem Cells of the Skin
Blanpain, C., & Fuchs, E. V. (2006) · Annual Review of Cell and Developmental Biology · doi:10.1146/annurev.cellbio.22.010305.104357 · Cited by 882
Multiplexed quantification of proteins and transcripts in single cells
Peterson, V. M., Zhang, K. X., Kumar, N., Wong, J., Li, L., Wilson, D. C., Moore, R., McClanahan, T. K., Sadekova, S., & Klappenbach, J. A. (2017) · Nature Biotechnology · doi:10.1038/nbt.3973 · Cited by 832
Role of integrins in regulating epidermal adhesion, growth and differentiation
Watt, F. M. (2002) · The EMBO Journal · doi:10.1093/emboj/cdf399 · Cited by 647
Emerging interactions between skin stem cells and their niches
Hsu, Y., Li, L., & Fuchs, E. V. (2014) · Nature Medicine · doi:10.1038/nm.3643 · Cited by 590
Multiple connections link FAK to cell motility and invasion
Schlaepfer, D. D., & Mitra, S. K. (2003) · Current Opinion in Genetics & Development · doi:10.1016/j.gde.2003.12.002 · Cited by 416
Highly multiplexed simultaneous detection of RNAs and proteins in single cells
Frei, A. P., Bava, F.-A., Zunder, E. R., Hsieh, E. W. Y., Chen, S.-Y., Nolan, G. P., & Gherardini, P. F. (2016) · Nature Methods · doi:10.1038/nmeth.3742 · Cited by 330
Wiśniewski, J. R., Ostasiewicz, P., & Mann, M. (2011) · Journal of Proteome Research · doi:10.1021/pr200019m · Cited by 290
Abseq: Ultrahigh-throughput single cell protein profiling with droplet microfluidic barcoding
Shahi, P., Kim, S., Haliburton, J. R., Gartner, Z. J., & Abate, A. R. (2017) · Scientific Reports · doi:10.1038/srep44447 · Cited by 266
A LncRNA-MAF:MAFB transcription factor network regulates epidermal differentiation
Lopez-Pajares, V., Qu, K., Zhang, J., Webster, D. E., Barajas, B. C., Siprashvili, Z., Zarnegar, B. J., Boxer, L. D., Rios, E. J., Tao, S., et al. (2015) · Developmental Cell · doi:10.1016/j.devcel.2015.01.028 · Cited by 194
Kolev, V. N., Mandinova, A., Guinea‐Viniegra, J., Hu, B., Lefort, K., Lambertini, C., Neel, V., Dummer, R., Wagner, E. F., & Dotto, G. P. (2008) · Nature Cell Biology · doi:10.1038/ncb1750 · Cited by 187
Digital Quantification of Proteins and mRNA in Single Mammalian Cells
Albayrak, C., Jordi, C. A., Zechner, C., Lin, J., Bichsel, C. A., Khammash, M., & Tay, S. (2016) · Molecular Cell · doi:10.1016/j.molcel.2016.02.030 · Cited by 176
Multiplexed, targeted profiling of single-cell proteomes and transcriptomes in a single reaction
Genshaft, A. S., Li, S., Gallant, C. J., Darmanis, S., Prakadan, S. M., Ziegler, C. G. K., Lundberg, M., Fredriksson, S., Hong, J., Regev, A., et al. (2016) · Genome Biology · doi:10.1186/s13059-016-1045-6 · Cited by 175
Diverse epigenetic strategies interact to control epidermal differentiation
Mulder, K. W., Wang, X., Escriu, C., Ito, Y., Schwarz, R. F., Gillis, J., Sirokmány, G., Donati, G., Uribe‐Lewis, S., Pavlidis, P., et al. (2012) · Nature Cell Biology · doi:10.1038/ncb2520 · Cited by 149
Self-citationMultiple tissue kallikrein mRNA and protein expression in normal skin and skin diseases
Komatsu, N., Saijoh, K., Toyama, T., Ohka, R., Otsuki, N., Hussack, G., Takehara, K., & Diamandis, E. P. (2005) · British Journal of Dermatology · doi:10.1111/j.1365-2133.2005.06754.x · Cited by 136
Ghosh, M. C., Grass, L., Soosaipillai, A. R., Sotiropoulou, G., & Diamandis, E. P. (2004) · Tumor Biology · doi:10.1159/000081102 · Cited by 122
van Buggenum, J. A. G. L., Gerlach, J. P., Eising, S., Schoonen, L., van Eijl, R. A. P. M., Tanis, S. E. J., Hogeweg, M., Hubner, N. C., van Hest, J. C., Bonger, K. M., et al. (2016) · Scientific Reports · doi:10.1038/srep22675 · Cited by 93
Self-citationA practical solution for preserving single cells for RNA sequencing
Attar, M., Sharma, E., Li, S., Bryer, C., Cubitt, L., Broxholme, J., Lockstone, H., Kinchen, J., Simmons, A., Piazza, P., et al. (2018) · Scientific Reports · doi:10.1038/s41598-018-20372-7 · Cited by 80
Immuno-detection by sequencing enables large-scale high-dimensional phenotyping in cells
van Buggenum, J. A. G. L., Gerlach, J. P., Tanis, S. E. J., Hogeweg, M., Jansen, P. W. T. C., Middelwijk, J., van der Steen, R., Vermeulen, M., Stunnenberg, H. G., Albers, C. A., et al. (2018) · Nature Communications · doi:10.1038/s41467-018-04761-0 · Cited by 22
Self-citation
Cited by
Sorted by citations
Methods and applications for single-cell and spatial multi-omics
Vandereyken, K., Sifrim, A., Thienpont, B., & Voet, T. (2023) · Nature Reviews Genetics · doi:10.1038/s41576-023-00580-2 · Cited by 1,244
The technological landscape and applications of single-cell multi-omics
Baysoy, A., Bai, Z., Satija, R., & Fan, R. (2023) · Nature Reviews Molecular Cell Biology · doi:10.1038/s41580-023-00615-w · Cited by 1,037
Mimitou, E. P., Lareau, C. A., Chen, K. Y., Zorzetto-Fernandes, A. L., Hao, Y., Takeshima, Y., Luo, W., Huang, T.-S., Yeung, B. Z., Papalexi, E., et al. (2021) · Nature Biotechnology · doi:10.1038/s41587-021-00927-2 · Cited by 529
Single-cell multiomics: technologies and data analysis methods
Lee, J., Hyeon, D. Y., & Hwang, D. (2020) · Experimental & Molecular Medicine · doi:10.1038/s12276-020-0420-2 · Cited by 524
Katzenelenbogen, Y., Sheban, F., Yalin, A., Yofe, I., Svetlichnyy, D., Jaitin, D. A., Bornstein, C., Moshe, A., Keren-Shaul, H., Cohen, M., et al. (2020) · Cell · doi:10.1016/j.cell.2020.06.032 · Cited by 498
Metadata
- Authors
- Gerlach, J. P., van Buggenum, J. A. G., Tanis, S. E. J., Hogeweg, M., Heuts, B. M. H., Muraro, M. J., Elze, L., Rivello, F., Rakszewska, A., van Oudenaarden, A., Huck, W. T. S., Stunnenberg, H. G., & Mulder, K. W.
- Affiliations
- Radboud University Nijmegen (NL)
- Royal Netherlands Academy of Arts and Sciences (NL)
- Corresponding author
- Mulder, Klaas W.
- ORCID
- Venue
- Scientific Reports
- Published
- 2019-02-06
- Volume
- 9
- Issue
- 1
- Pages
- 1469-1469
- ISSN
- 2045-2322 (ISSN-L)
- PMC
- PMC6365588
- OpenAlex
- W2810689242
- Cited by
- 104
- References
- 35
- Citations by year
- 2026: 10 · 2025: 11 · 2024: 13 · 2023: 21 · 2022: 15 · 2021: 20 · 2020: 8 · 2019: 5
- FWCI
- 3.97
- Type
- journal article
- Language
- en
- Open access
- gold
- doi.org
- Locations
- Scientific Reports (publishedVersion, cc-by)
- bioRxiv (Cold Spring Harbor Laboratory) (acceptedVersion)
- Europe PMC (PubMed Central) (publishedVersion, other-oa)
- PubMed Central (publishedVersion, cc-by)
- PubMed (publishedVersion)
- KNAW research portal (Royal Academy of Art and Sciences (KNAW)) (publishedVersion, other-oa)
- Data Archiving and Networked Services (DANS) (submittedVersion, other-oa)
- DOAJ (DOAJ: Directory of Open Access Journals) (submittedVersion)
- Radboud Repository (Radboud University) (submittedVersion)
- Radboud Repository (Radboud University) (submittedVersion, other-oa)
- Funders
- EC | European Research Council (339431)
- Nederlandse Organisatie voor Wetenschappelijk Onderzoek (864.12.010)
- Topics
- Life Sciences › Biochemistry, Genetics and Molecular Biology › Molecular Biology › Single-cell and spatial transcriptomics
- Physical Sciences › Chemistry › Spectroscopy › Advanced Proteomics Techniques and Applications
- Life Sciences › Biochemistry, Genetics and Molecular Biology › Molecular Biology › Molecular Biology Techniques and Applications
- Keywords
- single-cell proteomics, phosphoproteomics, transcriptome, protein expression, keratinocytes, keratinocyte differentiation, focal adhesion kinase phosphorylation, stem cell markers, cellular heterogeneity, environmental stimuli
- MeSH terms
- Cell Differentiation, Cells, Cultured, Gene Expression Regulation, Humans, Phosphorylation, Quinazolines, Keratinocytes, Tissue Fixation, Tyrphostins, Gene Expression Profiling, Proteomics, Focal Adhesion Kinase 1, Single-Cell Analysis
About these checks
Registry, retraction, Cites and statistics results are computed, not judged, with one exception: a printed reference that no index lists is read once by a model before it counts as a citation error. Claims are extracted by a model and kept only when their quote appears verbatim in the text; each cited source is then checked, with a model’s help, for whether it says what the claim relies on. Those verdicts can be wrong — read the claim’s quote and the cited source before relying on one.
Statistics and arithmetic are recomputed, not judged.
Confidence bands are shown only for fields calibrated on our annotated test set. None is calibrated yet, so no band is shown.
What counts as a claim ›How we measure confidence ›How we check this ›
Are you an author, or do you see a problem with this page? Request a review
