

Using Machine Learning to Measure Relatedness Between Genes: A Multi-Features Model
Open accessThe DOI matches its Crossref record; 109 of the 109 references it cites were found in a registry or an index.
Abstract
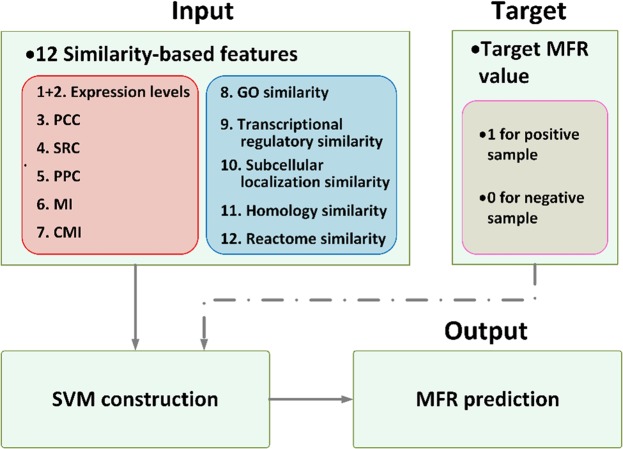
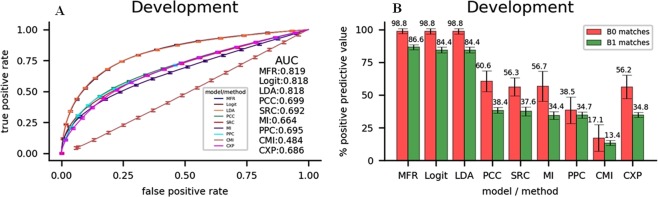
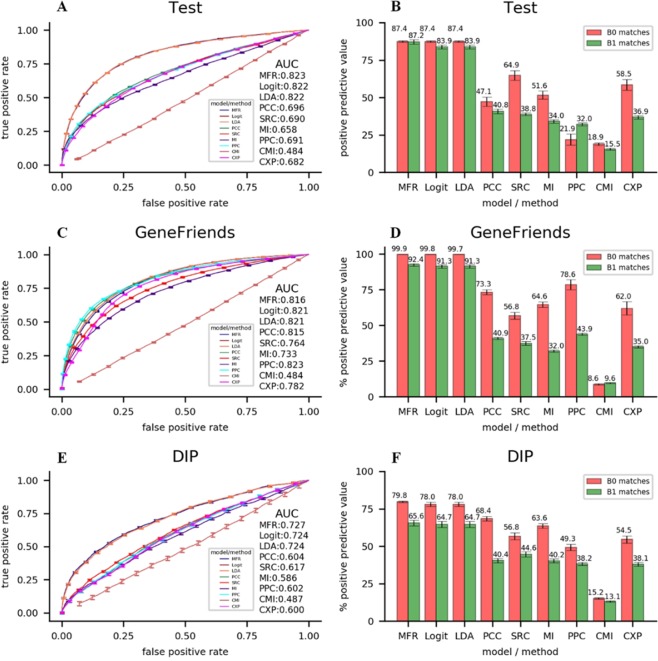
Measuring conditional relatedness between a pair of genes is a fundamental technique and still a significant challenge in computational biology. Such relatedness can be assessed by gene expression similarities while suffering high false discovery rates. Meanwhile, other types of features, e.g., prior-knowledge based similarities, is only viable for measuring global relatedness. In this paper, we propose a novel machine learning model, named Multi-Features Relatedness (MFR), for accurately measuring conditional relatedness between a pair of genes by incorporating expression similarities with prior-knowledge based similarities in an assessment criterion. MFR is used to predict gene-gene interactions extracted from the COXPRESdb, KEGG, HPRD, and TRRUST databases by the 10-fold cross validation and test verification, and to identify gene-gene interactions collected from the GeneFriends and DIP databases for further verification. The results show that MFR achieves the highest area under curve (AUC) values for identifying gene-gene interactions in the development, test, and DIP datasets. Specifically, it obtains an improvement of 1.1% on average of precision for detecting gene pairs with both high expression similarities and high prior-knowledge based similarities in all datasets, comparing to other linear models and coexpression analysis methods. Regarding cancer gene networks construction and gene function prediction, MFR also obtains the results with more biological significances and higher average prediction accuracy, than other compared models and methods. A website of the MFR model and relevant datasets can be accessed from http://bmbl.sdstate.edu/MFR .
Overview
The claims and statistics of this paper haven’t been checked yet.
Free: it reads the open-access text and checks the first 5 claims that cite a source we can check. Create a free account to check every claim.
Integrity signals
Registry
Cites
Statistics
Figures

Verification
Claims the paper makes
The claims and statistics of this paper haven’t been checked yet.
Free: it reads the open-access text and checks the first 5 claims that cite a source we can check. Create a free account to check every claim.
Claims other papers make about this one
Each is checked against this paper’s own text: does it say what the citing paper says it does?
The check wasn’t confident either way, so it gives no verdict — never disputed.
In the citing paper
“Although current methods for ortholog identification work well, there is still scope for improvement [24,25].”
From Functional unknomics: Systematic screening of conserved genes of unknown function (2023) · cites this paper as [24]
Experimental — accuracy not yet measuredThe check wasn’t confident either way, so it gives no verdict — never disputed.
In the citing paper
“However, OrthoMCL was not being updated, and so the current Unknome database is based on the PANTHER database (version 17.0) which covers over 143 organisms, is currently in continuous development, and has a good level of sensitivity and accuracy [24–26].”
From Functional unknomics: Systematic screening of conserved genes of unknown function (2023) · cites this paper as [24]
Experimental — accuracy not yet measured
Self-check
Percentages, sums and reported differences re-computed from the paper’s own numbers.
The self-check needs the paper’s full text.
Citations
Cites
Cortes, C., & Vapnik, V. (1995) · Machine Learning · doi:10.1007/bf00994018 · Cited by 59,421
Gradient-based learning applied to document recognition
Lecun, Y., Bottou, L., Bengio, Y., & Haffner, P. (1998) · Proceedings of the IEEE · doi:10.1109/5.726791 · Cited by 58,805
Going deeper with convolutions
Szegedy, C., Liu, W., Jia, Y., Sermanet, P., Reed, S., Anguelov, D., Erhan, D., Vanhoucke, V., & Rabinovich, A. (2015) · 2015 IEEE Conference on Computer Vision and Pattern Recognition (CVPR) · doi:10.1109/cvpr.2015.7298594 · Cited by 48,562
LIBSVM: A library for support vector machines
Chang, C.-C., & Lin, C.-J. (2011) · ACM Transactions on Intelligent Systems and Technology · doi:10.1145/1961189.1961199 · Cited by 40,918
limma powers differential expression analyses for RNA-sequencing and microarray studies
Ritchie, M. E., Phipson, B., Wu, D., Hu, Y., Law, C. W., Shi, W., & Smyth, G. K. (2015) · Nucleic Acids Research · doi:10.1093/nar/gkv007 · Cited by 40,458
Learning Phrase Representations using RNN Encoder–Decoder for Statistical Machine Translation
Cho, K., van Merrienboer, B., Gulcehre, C., Bahdanau, D., Bougares, F., Schwenk, H., & Bengio, Y. (2014) · Proceedings of the 2014 Conference on Empirical Methods in Natural Language Processing (EMNLP) · doi:10.3115/v1/d14-1179 · Cited by 25,545
Modern Applied Statistics with S
Venables, W. N., & Ripley, B. D. (2002) · Statistics and Computing · doi:10.1007/978-0-387-21706-2 · Cited by 24,305
The meaning and use of the area under a receiver operating characteristic (ROC) curve.
Hanley, J. A., & McNeil, B. J. (1982) · Radiology · doi:10.1148/radiology.143.1.7063747 · Cited by 21,856 · cited 4×
“The ROC results by the 10-fold cross-validation of different models and methods are showcased in Fig.”
MethodInfluentialCluster analysis and display of genome-wide expression patterns
Eisen, M. B., Spellman, P. T., Brown, P. O., & Botstein, D. (1998) · Proceedings of the National Academy of Sciences · doi:10.1073/pnas.95.25.14863 · Cited by 16,184
Finding and evaluating community structure in networks
Newman, M. E. J., & Girvan, M. (2004) · Physical Review E · doi:10.1103/physreve.69.026113 · Cited by 13,931 · cited 1×
“In the study 68 , a method was proposed to find modules in networks by greedy optimization of modularity 69 .”
Method
Research works printed but not linked: 2
- Gelʹfand, I. M. & Yaglom, A. M. Calculation of the Amount of Information About a Random Function Contained in Another Such Function. Uspekhi Mat Nauk 12, 199–236 (2016).
- He, K., Zhang, X., Ren, S. & Sun, J. In IEEE Conference on Computer Vision and Pattern Recognition. 770–778.
Cited by
Functional unknomics: Systematic screening of conserved genes of unknown function
Rocha, J. J., Jayaram, S. A., Stevens, T. J., Muschalik, N., Shah, R. D., Emran, S., Robles, C., Freeman, M., & Munro, S. (2023) · PLOS Biology · doi:10.1371/journal.pbio.3002222 · Cited by 70
Metadata
- Authors
- Wang, Y., Yang, S., Zhao, J., Du, W., Liang, Y., Wang, C., Zhou, F., Tian, Y., & Ma, Q.
- Affiliations
- Jilin University (CN)
- University of South Dakota (US)
- South Dakota State University (US)
- Corresponding author
- Tian, Yuan
- Ma, Qin
- Venue
- Scientific Reports
- Published
- 2019-03-12
- Volume
- 9
- Issue
- 1
- Pages
- 4192-4192
- ISSN
- 2045-2322 (ISSN-L)
- PMC
- PMC6414665
- OpenAlex
- W2922312159
- Cited by
- 26
- References
- 109
- Citations by year
- 2026: 1 · 2025: 1 · 2024: 2 · 2023: 1 · 2022: 2 · 2021: 4 · 2020: 13 · 2019: 2
- FWCI
- 1.74
- Type
- journal article
- Language
- en
- Open access
- gold
- doi.org
- Licence
- cc-by
- creativecommons.org/licenses/by/4.0 (tdm)
- creativecommons.org/licenses/by/4.0 (vor)
- Locations
- Scientific Reports (publishedVersion, cc-by)
- Europe PMC (PubMed Central) (publishedVersion, other-oa)
- PubMed Central (publishedVersion, cc-by)
- PubMed (publishedVersion)
- DOAJ (DOAJ: Directory of Open Access Journals) (submittedVersion)
- Funders
- National Science Foundation (ACI-1 548 562, 1548562)
- National Natural Science Foundation of China (20170520063JH, 61872418, ACI-1548562, 20180622002JC, 61572227)
- People's Government of Jilin Province (20180414012GH)
- National Institutes of Health (1548562, ACI-1548562)
- National Institute of General Medical Sciences (ACI1548562, 1548562, R01GM131399)
- Topics
- Life Sciences › Biochemistry, Genetics and Molecular Biology › Molecular Biology › Bioinformatics and Genomic Networks
- Life Sciences › Biochemistry, Genetics and Molecular Biology › Molecular Biology › Gene Regulatory Network Analysis
- Life Sciences › Biochemistry, Genetics and Molecular Biology › Molecular Biology › Gene expression and cancer classification
- Keywords
- gene expression similarity, gene co-expression network, gene function prediction, DIP
- MeSH terms
- Machine Learning, Humans, Models, Genetic, Computational Biology, Databases, Nucleic Acid, Gene Regulatory Networks
About these checks
Registry, retraction, Cites and statistics results are computed, not judged, with one exception: a printed reference that no index lists is read once by a model before it counts as a citation error. Claims are extracted by a model and kept only when their quote appears verbatim in the text; each cited source is then checked, with a model’s help, for whether it says what the claim relies on. Those verdicts can be wrong — read the claim’s quote and the cited source before relying on one.
Statistics and arithmetic are recomputed, not judged.
Confidence bands are shown only for fields calibrated on our annotated test set. None is calibrated yet, so no band is shown.
What counts as a claim ›How we measure confidence ›How we check this ›
Are you an author, or do you see a problem with this page? Request a review
How to cite
Cite CoChat for the checks on this page, and the paper for its own findings.
- This page
- CoChat. (2026). Citation check: Using Machine Learning to Measure Relatedness Between Genes: A Multi-Features Model. https://app.cochat.ai/papers/10.1038/s41598-019-40780-7
- The paper
- Wang, Y., Yang, S., Zhao, J., Du, W., Liang, Y., Wang, C., Zhou, F., Tian, Y., & Ma, Q. (2019). Using Machine Learning to Measure Relatedness Between Genes: A Multi-Features Model. Scientific Reports. https://doi.org/10.1038/s41598-019-40780-7
Data sources
Bibliographic data: Semantic Scholar, OpenAlex, Crossref.
Contains information from the Semantic Scholar Academic Graph Datasets, made available under the ODC Attribution License (ODC-BY 1.0).
Semantic Scholar’s data is described in: Kinney, R., et al. (2023). The Semantic Scholar Open Data Platform. arXiv:2301.10140.
