

The DOI matches its Crossref record; 34 of the 34 references it cites were found in a registry or an index.
Human decision-making biases in the moral dilemmas of autonomous vehicles
Open accessAbstract
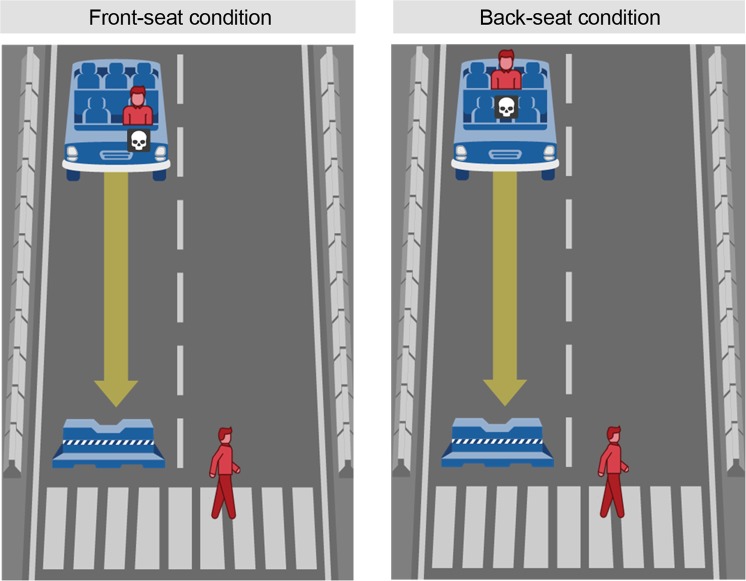
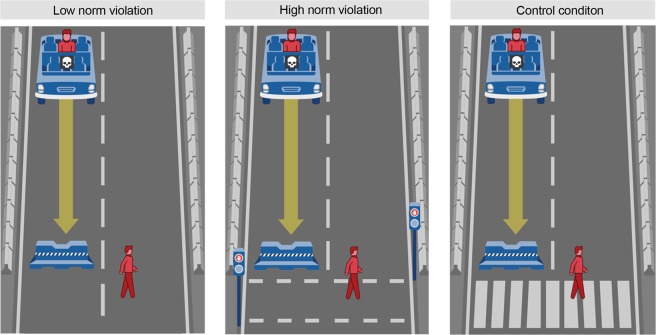
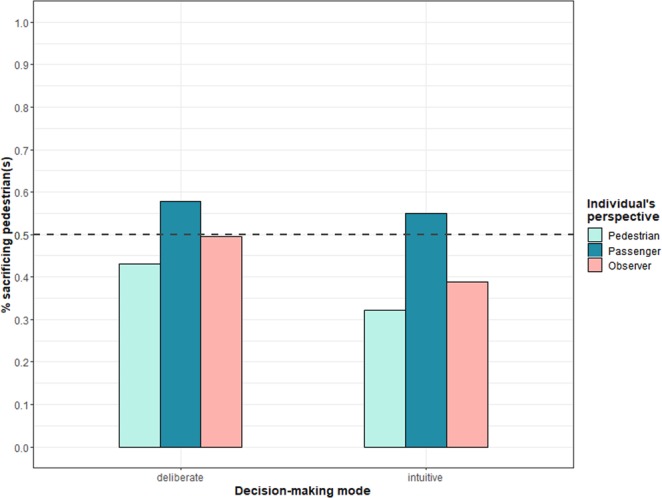
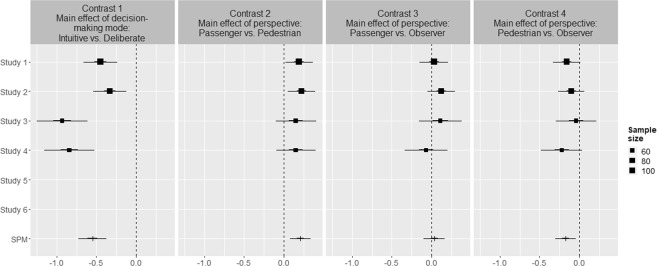
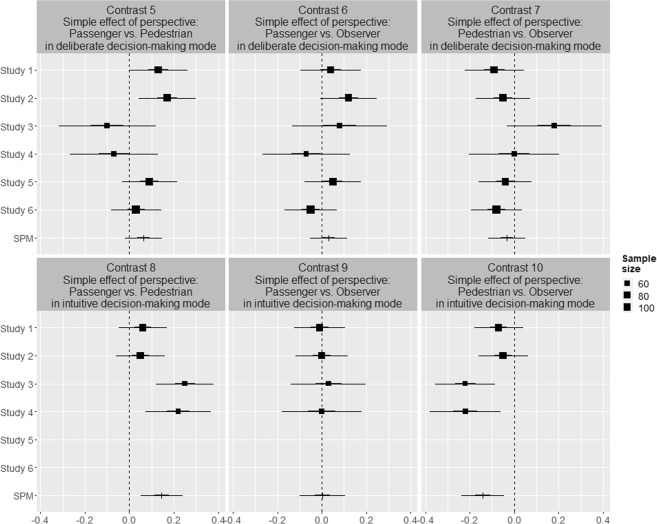
The development of artificial intelligence has led researchers to study the ethical principles that should guide machine behavior. The challenge in building machine morality based on people’s moral decisions, however, is accounting for the biases in human moral decision-making. In seven studies, this paper investigates how people’s personal perspectives and decision-making modes affect their decisions in the moral dilemmas faced by autonomous vehicles. Moreover, it determines the variations in people’s moral decisions that can be attributed to the situational factors of the dilemmas. The reported studies demonstrate that people’s moral decisions, regardless of the presented dilemma, are biased by their decision-making mode and personal perspective. Under intuitive moral decisions, participants shift more towards a deontological doctrine by sacrificing the passenger instead of the pedestrian. In addition, once the personal perspective is made salient participants preserve the lives of that perspective, i.e. the passenger shifts towards sacrificing the pedestrian, and vice versa. These biases in people’s moral decisions underline the social challenge in the design of a universal moral code for autonomous vehicles. We discuss the implications of our findings and provide directions for future research.
Overview
The claims and statistics of this paper haven’t been checked yet.
Run the check — free, no account needed. It reads the open-access text and checks the sources it cites.
Integrity signals
Registry
Cites
Statistics
Figures
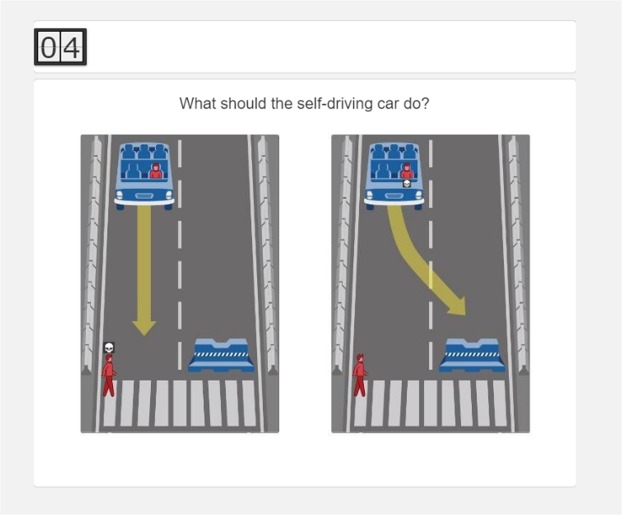
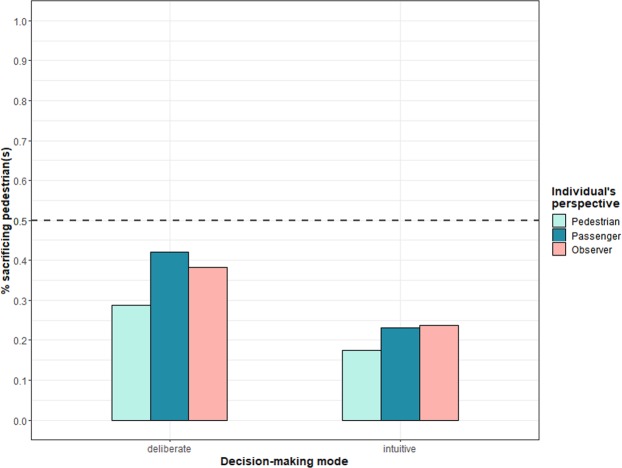
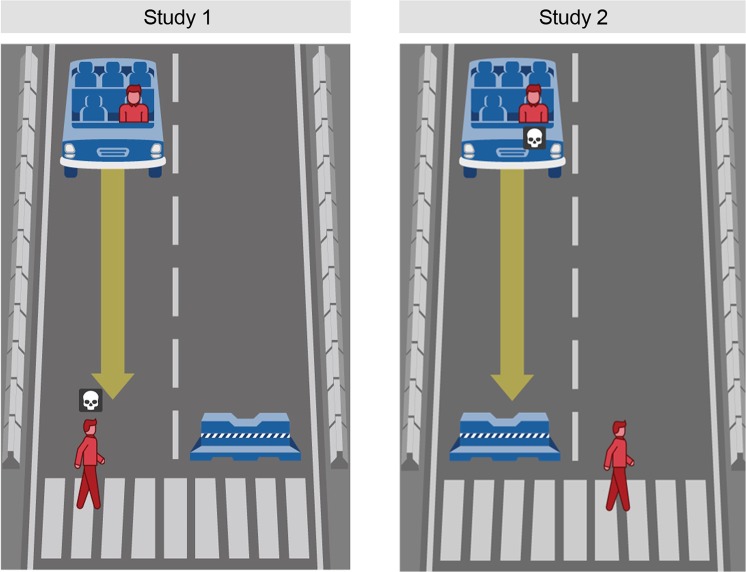
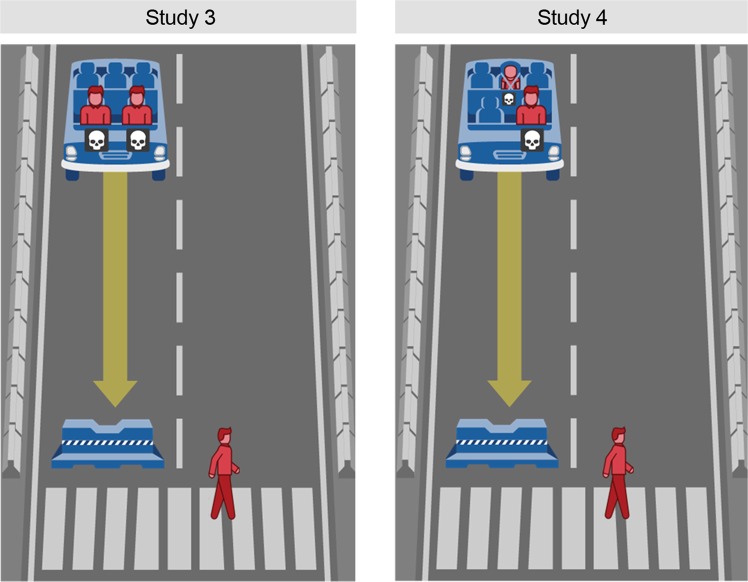
Verification
Claims the paper makes
The claims and statistics of this paper haven’t been checked yet.
Run the check — free, no account needed. It reads the open-access text and checks the sources it cites.
Claims other papers make about this one
Each is checked against this paper’s own text: does it say what the citing paper says it does?
The cited source says what the claim attributes to it.
In the citing paper
“Several investigations have delved into the specific perspectives of passengers, pedestrians, and observers in trolley dilemma, indicating people’s inclination to avoid moral algorithm involving self-sacrifice (Frank et al., 2019; Mayer et al., 2021).”
From Exploring moral algorithm preferences in autonomous vehicle dilemmas: an empirical study (2023) · cites this paper as Frank et al., 2019
Self-check
Percentages, sums and reported differences re-computed from the paper’s own numbers.
The self-check needs the paper’s full text.
Citations
Cites
(2011) · Cited by 14,317
Maps of Bounded Rationality: Psychology for Behavioral Economics
Kahneman, D. (2003) · American Economic Review · doi:10.1257/000282803322655392 · Cited by 5,377
Anomalies: The Endowment Effect, Loss Aversion, and Status Quo Bias
Kahneman, D., Knetsch, J. L., & Thaler, R. H. (1991) · Journal of Economic Perspectives · doi:10.1257/jep.5.1.193 · Cited by 5,019
An fMRI Investigation of Emotional Engagement in Moral Judgment
Greene, J. D., Sommerville, R. B., Nystrom, L. E., Darley, J. M., & Cohen, J. D. (2001) · Science · doi:10.1126/science.1062872 · Cited by 4,561
Individual differences in reasoning: Implications for the rationality debate?
Stanovich, K. E., & West, R. F. (2000) · Behavioral and Brain Sciences · doi:10.1017/s0140525x00003435 · Cited by 4,481
Toward a Psychology of Human Agency
Bandura, A. (2006) · Perspectives on Psychological Science · doi:10.1111/j.1745-6916.2006.00011.x · Cited by 3,459
The Development of Social Knowledge. Morality and Convention
Eggleston, S. J., & Turiel, E. (1985) · British Journal of Educational Studies · doi:10.2307/3121515 · Cited by 2,645
(1998) · Cited by 2,641
The Neural Bases of Cognitive Conflict and Control in Moral Judgment
Greene, J. D., Nystrom, L. E., Engell, A. D., Darley, J. M., & Cohen, J. D. (2004) · Neuron · doi:10.1016/j.neuron.2004.09.027 · Cited by 2,620
Awad, E., Dsouza, S., Kim, R., Schulz, J., Henrich, J., Shariff, A., Bonnefon, J.-F., & Rahwan, I. (2018) · Nature · doi:10.1038/s41586-018-0637-6 · Cited by 1,859
Towards a Cognitive Theory of Emotions
Oatley, K., & Johnson-laird, P. N. (1987) · Cognition & Emotion · doi:10.1080/02699938708408362 · Cited by 1,751
BOUNDED RATIONALITY, AMBIGUITY, AND THE ENGINEERING OF CHOICE
March, J. G. (1988) · Cambridge University Press eBooks · doi:10.1017/cbo9780511598951.004 · Cited by 1,687
Bounded rationality, ambiguity and the engineering of choice
March, J. G. (1978) · The Bell Journal of Economics · doi:10.2307/3003600 · Cited by 1,539
The social dilemma of autonomous vehicles
Bonnefon, J.-F., Shariff, A., & Rahwan, I. (2016) · Science · doi:10.1126/science.aaf2654 · Cited by 1,527
Thomson, J. J. (1985) · The Yale Law Journal · doi:10.2307/796133 · Cited by 1,315
Cognitive load selectively interferes with utilitarian moral judgment
Greene, J. D., Morelli, S. A., Lowenberg, K., Nystrom, L. E., & Cohen, J. D. (2008) · Cognition · doi:10.1016/j.cognition.2007.11.004 · Cited by 1,231
de Groot, J. I. M., & Steg, L. (2009) · The Journal of Social Psychology · doi:10.3200/socp.149.4.425-449 · Cited by 1,166
The decision and the organization
MacDougall, C. D., & Wilson, H. (1965) · Marzani & Munsell eBooks · Cited by 1,149
Single-Paper Meta-Analysis: Benefits for Study Summary, Theory Testing, and Replicability
McShane, B. B., & Böckenholt, U. (2017) · Journal of Consumer Research · doi:10.1093/jcr/ucw085 · Cited by 474
Rand, D. G. (2016) · Psychological Science · doi:10.1177/0956797616654455 · Cited by 461
Rapid responding increases belief bias: Evidence for the dual-process theory of reasoning
Evans, J. S. B. T., & Curtis-Holmes, J. (2005) · Thinking & Reasoning · doi:10.1080/13546780542000005 · Cited by 418
Psychological roadblocks to the adoption of self-driving vehicles
Shariff, A., Bonnefon, J.-F., & Rahwan, I. (2017) · Nature Human Behaviour · doi:10.1038/s41562-017-0202-6 · Cited by 336
Greene, J. D. (2009) · Journal of Experimental Social Psychology · doi:10.1016/j.jesp.2009.01.003 · Cited by 277
Epstein, S. J., & Pacini, R. (1999) · Cited by 243
Action bias among elite soccer goalkeepers: The case of penalty kicks
Bar‐Eli, M., Azar, O. H., Ritov, I., Keidar-Levin, Y., & Schein, G. (2007) · Journal of Economic Psychology · doi:10.1016/j.joep.2006.12.001 · Cited by 233
Action Bias and Environmental Decisions
Patt, A., & Zeckhauser, R. (2000) · Journal of Risk and Uncertainty · doi:10.1023/a:1026517309871 · Cited by 191
A Voting-Based System for Ethical Decision Making
Noothigattu, R., Gaikwad, S. S., Awad, E., Dsouza, S., Rahwan, I., Ravikumar, P., & Procaccia, A. D. (2018) · Proceedings of the AAAI Conference on Artificial Intelligence · doi:10.1609/aaai.v32i1.11512 · Cited by 146
Sneijder, P., & Molder, H. T. (2005) · Discourse & Society · doi:10.1177/0957926505054941 · Cited by 129
Causal chains: Attribution of responsibility as a function of immediate and prior causes.
Brickman, P., Ryan, K., & Wortman, C. B. (1975) · Journal of Personality and Social Psychology · doi:10.1037/0022-3514.32.6.1060 · Cited by 108
Youth and traffic safety: The effects of driving age, experience, and education
Levy, D. T. (1990) · Accident Analysis & Prevention · doi:10.1016/0001-4575(90)90048-p · Cited by 99
Sütfeld, L. R., Gast, R., Peter König, B., & Pipa, G. (2017) · Frontiers in Behavioral Neuroscience · doi:10.3389/fnbeh.2017.00122 · Cited by 92
Kockelman, K. M., Avery, P. A., Bansal, P., Boyles, S. D., Bujanović, P., Choudhary, T., Clements, L. M., Domnenko, G., Fagnant, D., Helsel, J., et al. (2016) · Cited by 61
Meder, B., Fleischhut, N., Krumnau, N., & Waldmann, M. R. (2018) · Risk Analysis · doi:10.1111/risa.13178 · Cited by 44
Proximity biases in the attribution of civil liability.
Johnson, J. T., & Drobny, J. (1985) · Journal of Personality and Social Psychology · doi:10.1037//0022-3514.48.2.283 · Cited by 23
Research works printed but not linked: 1
- Simon, H. A. Theories of bounded rationality. Decision and Organization 1, 161–176 (1972).
Cited by
Sorted by citations
Failures of Fairness in Automation Require a Deeper Understanding of Human–ML Augmentation
Teodorescu, M. H., Morse, L., Awwad, Y., & Kane, G. C. (2021) · MIS Quarterly · doi:10.25300/misq/2021/16535 · Cited by 219
Taylor, J. E. T., & Taylor, G. W. (2020) · Psychonomic Bulletin & Review · doi:10.3758/s13423-020-01825-5 · Cited by 154
Zhen, Z., Pi, Y., Jiang, L., Xiang, Y., Wei, J., Yang, P., Zhang, W., Zhong, X., Zhou, K., Li, Y., et al. (2020) · Scientific Reports · doi:10.1038/s41598-020-74135-4 · Cited by 96
Qian, L., Yin, J., Huang, Y., & Liang, Y. (2022) · Technological Forecasting and Social Change · doi:10.1016/j.techfore.2022.122267 · Cited by 84
Understanding Human-AI Augmentation in the Workplace: A Review and a Future Research Agenda
Trinh, N. T. T., & Elbanna, A. R. (2025) · Information Systems Frontiers · doi:10.1007/s10796-025-10591-5 · Cited by 109
Metadata
- Authors
- Frank, D.-A., Chrysochou, P., Mitkidis, P., & Ariely, D.
- Affiliations
- Aarhus University (DK)
- University of South Australia (AU)
- Duke University (US)
- Corresponding author
- Frank, Darius-Aurel
- Venue
- Scientific Reports
- Published
- 2019-09-11
- Volume
- 9
- Issue
- 1
- Pages
- 13080-13080
- ISSN
- 2045-2322 (ISSN-L)
- PMC
- PMC6739396
- OpenAlex
- W2972894832
- Cited by
- 101
- References
- 34
- Citations by year
- 2026: 13 · 2025: 20 · 2024: 21 · 2023: 16 · 2022: 12 · 2021: 12 · 2020: 7
- FWCI
- 4.51
- Type
- journal article
- Language
- en
- Open access
- gold
- doi.org
- Locations
- Scientific Reports (publishedVersion, cc-by)
- Europe PMC (PubMed Central) (publishedVersion, cc-by)
- PubMed Central (publishedVersion, cc-by)
- PubMed (publishedVersion)
- DOAJ (DOAJ: Directory of Open Access Journals) (submittedVersion)
- Funders
- Aarhus Universitet
- Topics
- Life Sciences › Neuroscience › Cognitive Neuroscience › Psychology of Moral and Emotional Judgment
- Social Sciences › Business, Management and Accounting › Organizational Behavior and Human Resource Management › Ethics in Business and Education
- Social Sciences › Arts and Humanities › Philosophy › Philosophical Ethics and Theory
- Keywords
- autonomous vehicles, ethical dilemmas, ethical decision-making, decision bias, personal perspective, deontology, consequentialism
- MeSH terms
- Adult, Artificial Intelligence, Automobiles, Decision Making, Female, Humans, Male, Morals
About these checks
Registry, retraction, Cites and statistics results are computed, not judged, with one exception: a printed reference that no index lists is read once by a model before it counts as a citation error. Claims are extracted by a model and kept only when their quote appears verbatim in the text; each cited source is then checked, with a model’s help, for whether it says what the claim relies on. Those verdicts can be wrong — read the claim’s quote and the cited source before relying on one.
Statistics and arithmetic are recomputed, not judged.
Confidence bands are shown only for fields calibrated on our annotated test set. None is calibrated yet, so no band is shown.
What counts as a claim ›How we measure confidence ›How we check this ›
Are you an author, or do you see a problem with this page? Request a review
