

The DOI matches its Crossref record; 68 of the 70 references it cites were found in a registry or an index.
Production of adeno-associated virus vectors for in vitro and in vivo applications
Open accessAbstract
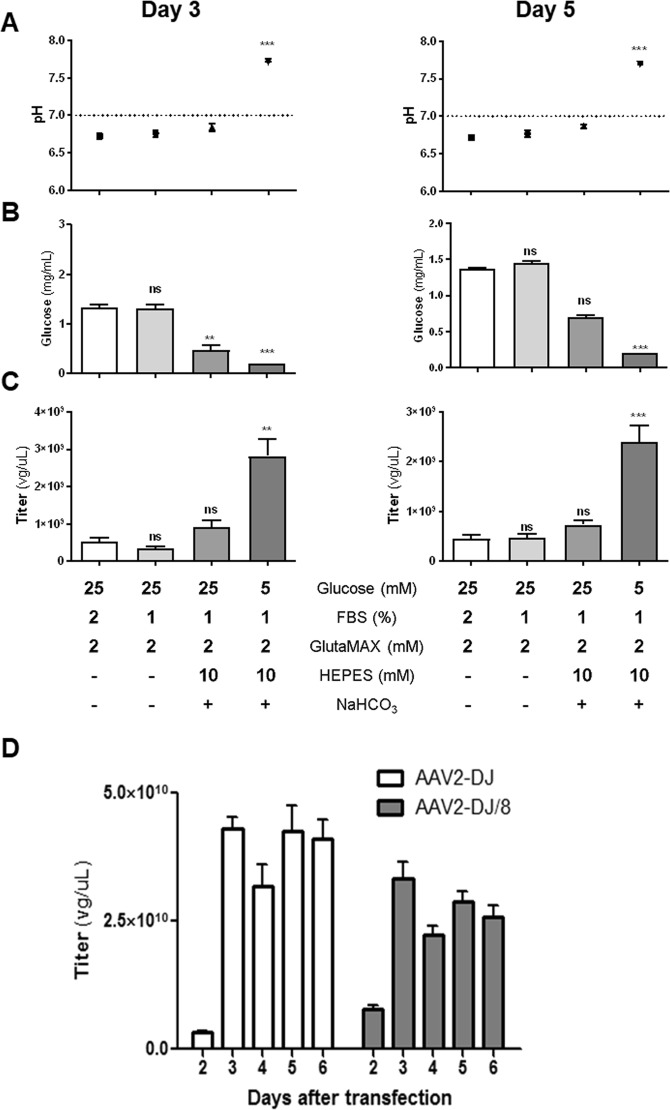
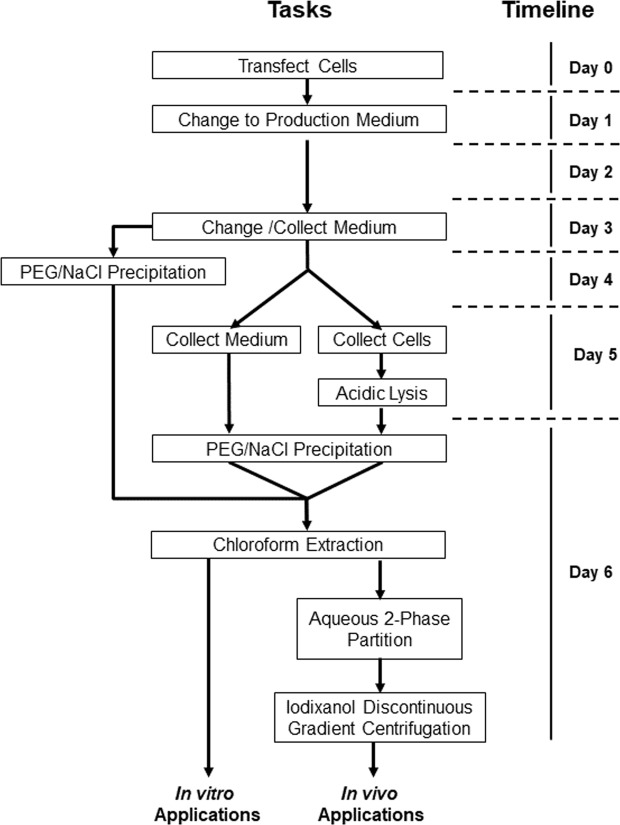
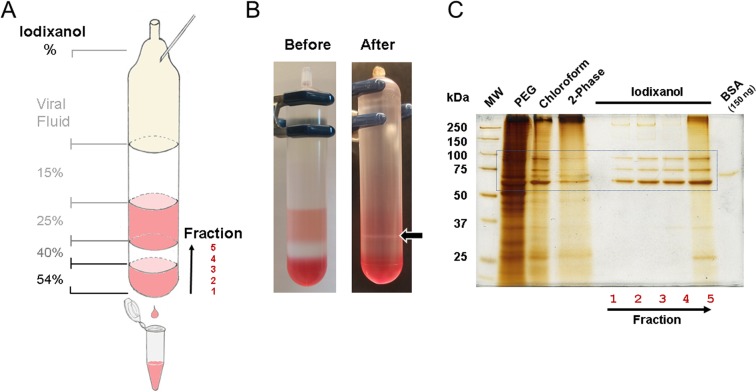
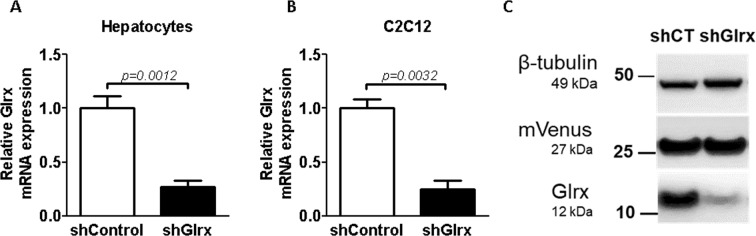
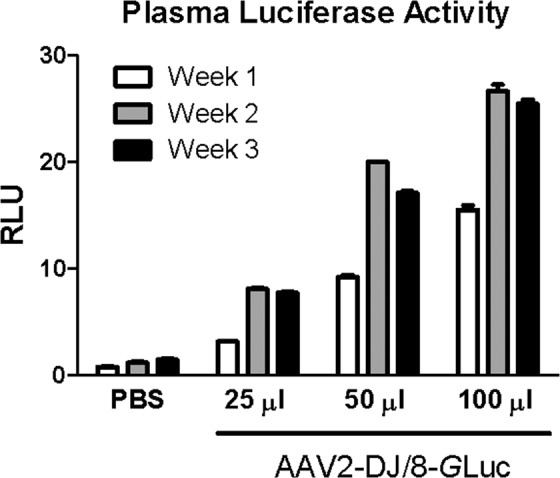
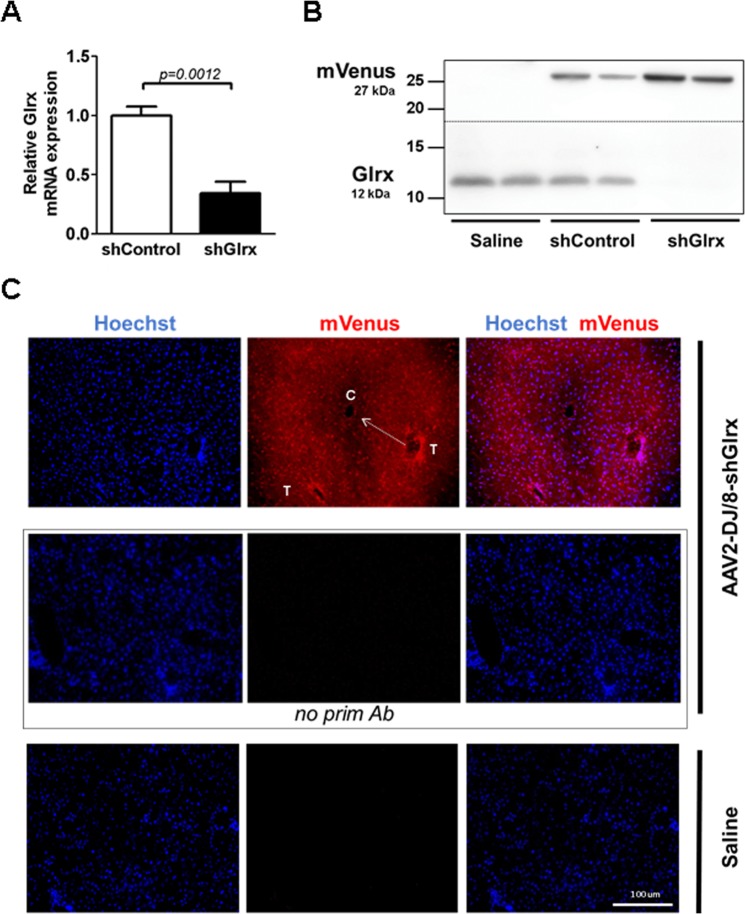
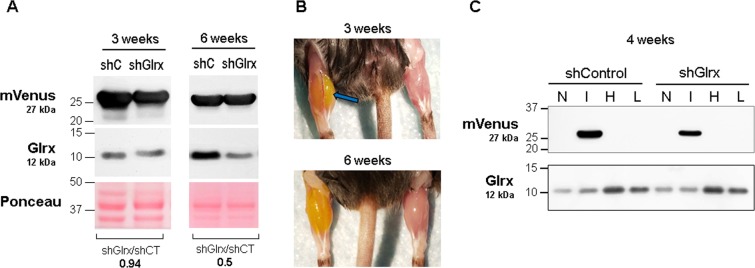
Delivering and expressing a gene of interest in cells or living animals has become a pivotal technique in biomedical research and gene therapy. Among viral delivery systems, adeno-associated viruses (AAVs) are relatively safe and demonstrate high gene transfer efficiency, low immunogenicity, stable long-term expression, and selective tissue tropism. Combined with modern gene technologies, such as cell-specific promoters, the Cre/lox system, and genome editing, AAVs represent a practical, rapid, and economical alternative to conditional knockout and transgenic mouse models. However, major obstacles remain for widespread AAV utilization, such as impractical purification strategies and low viral quantities. Here, we report an improved protocol to produce serotype-independent purified AAVs economically. Using a helper-free AAV system, we purified AAVs from HEK293T cell lysates and medium by polyethylene glycol precipitation with subsequent aqueous two-phase partitioning. Furthermore, we then implemented an iodixanol gradient purification, which resulted in preparations with purities adequate for in vivo use. Of note, we achieved titers of 10 10 –10 11 viral genome copies per µl with a typical production volume of up to 1 ml while requiring five times less than the usual number of HEK293T cells used in standard protocols. For proof of concept, we verified in vivo transduction via Western blot, qPCR, luminescence, and immunohistochemistry. AAVs coding for glutaredoxin-1 (Glrx) shRNA successfully inhibited Glrx expression by ~66% in the liver and skeletal muscle. Our study provides an improved protocol for a more economical and efficient purified AAV preparation.
Overview
The claims and statistics of this paper haven’t been checked yet.
Run the check — free, no account needed. It reads the open-access text and checks the sources it cites.
Integrity signals
Registry
Cites
Statistics
Figures
Verification
Claims the paper makes
The claims and statistics of this paper haven’t been checked yet.
Run the check — free, no account needed. It reads the open-access text and checks the sources it cites.
Claims other papers make about this one
Each is checked against this paper’s own text: does it say what the citing paper says it does?
The check wasn’t confident either way, so it gives no verdict — never disputed.
In the citing paper
“The ratio of full capsids to all capsids, termed content ratio, can vary from <1% to 30% in the production culture at the time of harvest and is inconsistent between production runs (Figure 1).6,28, 29, 30”
From Analytical methods for process and product characterization of recombinant adeno-associated virus-based gene therapies (2021) · cites this paper as [6]
Experimental — accuracy not yet measuredIn the citing paper
“At the same time, virus concentration in samples covers many orders of magnitude, from 1010 to 1011 vg/mL at raw culture harvest to 1013 to 1014 vg/mL in the purified product,6,7,18, 19, 20,24, 25, 26, 27”
From Analytical methods for process and product characterization of recombinant adeno-associated virus-based gene therapies (2021) · cites this paper as [6]
In the citing paper
“Commonly, laboratory-scale production yields only few milliliters (mL) of purified rAAV—equivalent to 1012–1014 vector genomes (vgs)—such that the required sample volumes for analysis can cause significant loss of product.6,7,20,23,24”
From Analytical methods for process and product characterization of recombinant adeno-associated virus-based gene therapies (2021) · cites this paper as [6]
Self-check
Percentages, sums and reported differences re-computed from the paper’s own numbers.
The self-check needs the paper’s full text.
Citations
Cites
Effect of gene therapy on visual function in Leber’s congenital amaurosis
Bainbridge, J. W. B., Smith, A. J., Barker, S. S., Robbie, S., Henderson, R., Balaggan, K., Viswanathan, A., Holder, G. E., Stockman, A., Tyler, N., et al. (2008) · New England Journal of Medicine · doi:10.1056/nejmoa0802268 · Cited by 1,924
Zolotukhin, S., Byrne, B. J., Mason, E. G., Zolotukhin, I., Potter, M., Chesnut, K. A., Summerford, C., Samulski, R. J., & Muzyczka, N. (1999) · Gene Therapy · doi:10.1038/sj.gt.3300938 · Cited by 1,321
Evidence that glutamine, not sugar, is the major energy source for cultured HeLa cells.
Reitzer, L. J., Wice, B. M., & Kennell, D. (1979) · Journal of Biological Chemistry · doi:10.1016/s0021-9258(17)30124-2 · Cited by 1,240
Kaplitt, M. G., Feigin, A., Tang, C., Fitzsimons, H. L., Mattis, P., Lawlor, P. A., Bland, R. J., Young, D., Strybing, K., Eidelberg, D., et al. (2007) · The Lancet · doi:10.1016/s0140-6736(07)60982-9 · Cited by 1,067
SIRT1 Regulates Hepatocyte Lipid Metabolism through Activating AMP-activated Protein Kinase
Hou, X., Xu, S., Maitland-Toolan, K. A., Sato, K., Jiang, B., Ido, Y., Lan, F., Walsh, K., Wierzbicki, M., Verbeuren, T. J., et al. (2008) · Journal of Biological Chemistry · doi:10.1074/jbc.m802187200 · Cited by 778
Self-citationEngineering adeno-associated viruses for clinical gene therapy
Kotterman, M. A., & Schaffer, D. V. (2014) · Nature Reviews Genetics · doi:10.1038/nrg3742 · Cited by 761
Grimm, D., Lee, J. S., Wang, L., Desai, T., Akache, B., Storm, T. A., & Kay, M. A. (2008) · Journal of Virology · doi:10.1128/jvi.00254-08 · Cited by 696
AAV5–Factor VIII Gene Transfer in Severe Hemophilia A
Rangarajan, S., Walsh, L., Lester, W., Perry, D., Madan, B., Laffan, M., Yu, H., Vettermann, C., Pierce, G. F., Wong, W. Y., et al. (2017) · New England Journal of Medicine · doi:10.1056/nejmoa1708483 · Cited by 694
Hosios, A. M., Hecht, V. C., Danai, L. V., Johnson, M. O., Rathmell, J. C., Steinhauser, M. L., Manalis, S. R., & Vander Heiden, M. G. (2016) · Developmental Cell · doi:10.1016/j.devcel.2016.02.012 · Cited by 641
Production and characterization of adeno-associated viral vectors
Grieger, J. C., Choi, V. W., & Samulski, R. J. (2006) · Nature Protocols · doi:10.1038/nprot.2006.207 · Cited by 580
Cited by
Sorted by citations
Yang, D., Zhang, W., Zhang, H., Zhang, F., Chen, L., Ma, L., Larcher, L. M., Chen, S., Liu, N., Zhao, Q., et al. (2020) · Theranostics · doi:10.7150/thno.41580 · Cited by 1,079
The use of viral vectors in vaccine development
Travieso, T., Li, J., Mahesh, S., Mello, J. D. F. R. E., & Blasi, M. (2022) · npj Vaccines · doi:10.1038/s41541-022-00503-y · Cited by 316
Adeno-associated virus capsid assembly is divergent and stochastic
Wörner, T. P., Bennett, A. D., Habka, S., Snijder, J., Friese, O. V., Powers, T. W., Agbandje‐McKenna, M., & Heck, A. J. R. (2021) · Nature Communications · doi:10.1038/s41467-021-21935-5 · Cited by 228
Maintaining hypoxia environment of subchondral bone alleviates osteoarthritis progression
Zhang, H., Wang, L., Cui, J., Wang, S., Han, Y., Shao, H., Wang, C., Hu, Y., Li, X., Zhou, Q., et al. (2023) · Science Advances · doi:10.1126/sciadv.abo7868 · Cited by 223
Viral Vector-Based Gene Therapy
Li, X., Le, Y., Zhang, Z., Nian, X., Лю, Б., & Yang, X. (2023) · International Journal of Molecular Sciences · doi:10.3390/ijms24097736 · Cited by 231
Gimpel, A. L., Katsikis, G., Sha, S., Maloney, A. J., Hong, M. S., Nguyen, T. N. T., Wolfrum, J., Springs, S. L., Sinskey, A. J., Manalis, S. R., et al. (2021) · Molecular Therapy - Methods & Clinical Development · doi:10.1016/j.omtm.2021.02.010 · Cited by 185
AAV-mediated in vivo CAR gene therapy for targeting human T-cell leukemia
Nawaz, W., Huang, B., Xu, S., Li, Y., Zhu, L., Hu, Y., Wu, Z., & Wu, X. (2021) · Blood Cancer Journal · doi:10.1038/s41408-021-00508-1 · Cited by 173
Foetal bovine serum influence on in vitro extracellular vesicle analyses
Lehrich, B. M., Liang, Y., & Fiandaca, M. S. (2021) · Journal of Extracellular Vesicles · doi:10.1002/jev2.12061 · Cited by 142
Zou, Z., Han, L., Xu, G., Hu, Y., Zhang, W., & Tian, K. (2023) · International Journal of Nanomedicine · doi:10.2147/ijn.s417422 · Cited by 115
Production, Processing, and Characterization of Synthetic AAV Gene Therapy Vectors
Andari, J. E., & Grimm, D. (2020) · Biotechnology Journal · doi:10.1002/biot.202000025 · Cited by 105
Díaz‐García, C. M., Meyer, D. J., Nathwani, N., Rahman, M., Martínez‐François, J. R., & Yellen, G. (2021) · eLife · doi:10.7554/elife.64821 · Cited by 98
Extracellular Vesicles in Liquid Biopsies: Potential for Disease Diagnosis
Liu, J., Chen, Y., Pei, F., Zeng, C., Yao, Y., Liao, W., & Zhao, Z. (2021) · BioMed Research International · doi:10.1155/2021/6611244 · Cited by 83
Adams, B., Bak, H., & Tustian, A. D. (2020) · Biotechnology and Bioengineering · doi:10.1002/bit.27472 · Cited by 72
Roles of Non-Coding RNA in Alzheimer’s Disease Pathophysiology
Olufunmilayo, E. O., & Holsinger, R. M. D. (2023) · International Journal of Molecular Sciences · doi:10.3390/ijms241512498 · Cited by 68
Cellular pathways of recombinant adeno-associated virus production for gene therapy
Sha, S., Maloney, A. J., Katsikis, G., Nguyen, T. N. T., Neufeld, C., Wolfrum, J., Barone, P. W., Springs, S. L., Manalis, S. R., Sinskey, A. J., et al. (2021) · Biotechnology Advances · doi:10.1016/j.biotechadv.2021.107764 · Cited by 67
Janoušková, O., Herma, R., Semerádtová, A., Poustka, D., Liegertová, M., Malinská, H. A., & Malý, J. (2022) · Frontiers in Molecular Biosciences · doi:10.3389/fmolb.2022.846650 · Cited by 64
Non-Coding RNAs as Novel Regulators of Neuroinflammation in Alzheimer’s Disease
Liu, Y., Cheng, X. M., Li, H., Hui, S., Zhang, Z., Yang, X. J., & Peng, W. (2022) · Frontiers in Immunology · doi:10.3389/fimmu.2022.908076 · Cited by 63
hnRNP A1 dysfunction alters RNA splicing and drives neurodegeneration in multiple sclerosis (MS)
Salapa, H. E., Thibault, P., Libner, C. D., Ding, Y.-L., Clarke, J. P., Denomy, C., Hutchinson, C., Abidullah, H. M., Hammond, S. A., Pastushok, L., et al. (2024) · Nature Communications · doi:10.1038/s41467-023-44658-1 · Cited by 47
Gene Delivery to the Skin – How Far Have We Come?
Ain, Q. U., Campos, E. V. R., Huynh, A., Witzigmann, D., & Hedtrich, S. (2020) · Trends in biotechnology · doi:10.1016/j.tibtech.2020.07.012 · Cited by 51
Muscle-derived myostatin is a major endocrine driver of follicle-stimulating hormone synthesis
Ongaro, L., Zhou, X., Wáng, Y., Schultz, H., Zhou, Z., Buddle, E. R. S., Brûlé, E., Lin, Y., Schang, G., Hagg, A., et al. (2025) · Science · doi:10.1126/science.adi4736 · Cited by 51
Pre-mRNA Processing Factors and Retinitis Pigmentosa: RNA Splicing and Beyond
Yang, C., Γεωργίου, Μ., Atkinson, R., Collin, J., Al-Aama, J. Y., Nagaraja‐Grellscheid, S., Johnson, C. A., Ali, R. R., Armstrong, L., Mozaffari‐Jovin, S., et al. (2021) · Frontiers in Cell and Developmental Biology · doi:10.3389/fcell.2021.700276 · Cited by 49
RNA-based translation activators for targeted gene upregulation
Cao, Y., Liu, H., Lu, S. S., Jones, K. A., Govind, A. P., Jeyifous, O., Simmons, C. Q., Tabatabaei, N., Green, W. N., Holder, J. L., et al. (2023) · Nature Communications · doi:10.1038/s41467-023-42252-z · Cited by 43
Wang, H., Wang, T., Rui, W., Xie, J., Xie, Y., Zhang, X., Guan, L., Li, G., Lei, Z., Schiffelers, R. M., et al. (2022) · Journal of Extracellular Vesicles · doi:10.1002/jev2.12222 · Cited by 44
Troponin Variants in Congenital Myopathies: How They Affect Skeletal Muscle Mechanics
van de Locht, M., Borsboom, T. C., de Winter, J. M., & Ottenheijm, C. A. C. (2021) · International Journal of Molecular Sciences · doi:10.3390/ijms22179187 · Cited by 43
DDHD2 provides a flux of saturated fatty acids for neuronal energy and function
Saber, S. H., Yak, N., Yong, X. L. H., Bong, Y. T., Leeson, H., Dai, C.-Y., Binder, T., Lu, S., Purushothaman, R., Lenaerts, A.-S., et al. (2025) · Nature Metabolism · doi:10.1038/s42255-025-01367-x · Cited by 44
Role of Glutaredoxin-1 and Glutathionylation in Cardiovascular Diseases
Burns, M., Rizvi, S. H. M., Tsukahara, Y., Pimentel, D. R., Luptak, I., Hamburg, N. M., Matsui, R., & Bachschmid, M. M. (2020) · International Journal of Molecular Sciences · doi:10.3390/ijms21186803 · Cited by 36
Self-citationAdeno-associated virus characterization for cargo discrimination through nanopore responsiveness
Karawdeniya, B. I., Bandara, Y. M. N. D. Y., Khan, A. I., Chen, W. T., Vu, H.-A., Morshed, A., Suh, J., Dutta, P., & Kim, M. J. (2020) · Nanoscale · doi:10.1039/d0nr05605g · Cited by 41
The Na(+)/K(+) pump dominates control of glycolysis in hippocampal dentate granule cells
Meyer, D. J., Díaz-García, C. M., Nathwani, N., Rahman, M., & Yellen, G. (2022) · eLife · doi:10.7554/elife.81645 · Cited by 40
The downstream bioprocess toolbox for therapeutic viral vectors
Kilgore, R., Minzoni, A., Shastry, S., Smith, W. K., Barbieri, E., Wu, Y., LeBarre, J. P., Chu, W., O'Brien, J., & Menegatti, S. (2023) · Journal of Chromatography A · doi:10.1016/j.chroma.2023.464337 · Cited by 40
Hepatocytes coordinate immune evasion in cancer via release of serum amyloid A proteins
Stone, M. L., Lee, J., Lee, J. W., Coho, H., Tariveranmoshabad, M., Wattenberg, M. M., Choi, H., Herrera, V. M., Xue, Y., Choi-Bose, S., et al. (2024) · Nature Immunology · doi:10.1038/s41590-024-01820-1 · Cited by 37
Proteomic Landscape of Adeno-Associated Virus (AAV)-Producing HEK293 Cells
Strasser, L., Boi, S., Guapo, F., Donohue, N., Barron, N., Rainbow-Fletcher, A., & Bones, J. (2021) · International Journal of Molecular Sciences · doi:10.3390/ijms222111499 · Cited by 33
Hepatic PRMT1 ameliorates diet-induced hepatic steatosis via induction of PGC1α
Xu, L., Huang, Z. P., Lo, T.-H., Lee, J. T. H., Yang, R., Yan, X., Ye, D., Xu, A., & Wong, C. (2022) · Theranostics · doi:10.7150/thno.63824 · Cited by 33
Disulfide stress and its role in cardiovascular diseases
Qian, S., Chen, G., Li, R., Ma, Y., Pan, L., Wang, X., & Wang, X. (2024) · Redox Biology · doi:10.1016/j.redox.2024.103297 · Cited by 33
Advances in Alpha-1 Antitrypsin Gene Therapy
Lőrincz, R., & Curiel, D. T. (2020) · American Journal of Respiratory Cell and Molecular Biology · doi:10.1165/rcmb.2020-0159ps · Cited by 31
Bucher, K., Rodríguez‐Bocanegra, E., Wissinger, B., Straßer, T., Clark, S. J., Birkenfeld, A. L., Siegel-Axel, D. I., & Fischer, M. D. (2023) · Scientific Reports · doi:10.1038/s41598-023-28830-7 · Cited by 26
Destro, F., Wu, W., Srinivasan, P., Joseph, J., Bal, V., Neufeld, C. I., Wolfrum, J. M., Manalis, S. R., Sinskey, A. J., Springs, S. L., et al. (2024) · Biotechnology Advances · doi:10.1016/j.biotechadv.2024.108433 · Cited by 26
Pathogenic variants in TNNC2 cause congenital myopathy due to an impaired force response to calcium
van de Locht, M., Donkervoort, S. C., de Winter, J. M., Conijn, S., Begthel, L. P. L., Küsters, B., Mohassel, P., Hu, Y., Medne, L., Quinn, C. C., et al. (2021) · Journal of Clinical Investigation · doi:10.1172/jci145700 · Cited by 26
Viral Membrane Fusion Proteins and RNA Sorting Mechanisms for the Molecular Delivery by Exosomes
Zubarev, I. V., Vladimirtsev, D., Vorontsova, M. V., Blatov, I., Shevchenko, K. G., Zvereva, S. D., Lunev, E. A., Файзулоев, Е. Б., & Barlev, N. (2021) · Cells · doi:10.3390/cells10113043 · Cited by 24
Downstream processing of AAV based gene therapy vectors
Jungbauer, A., & Wheelwright, S. M. (2025) · Separation and Purification Technology · doi:10.1016/j.seppur.2025.133051 · Cited by 24
Improving Isolation of Extracellular Vesicles by Utilizing Nanomaterials
Zhang, H., Zhang, Q., Deng, Y., Chen, M., & Yang, C. (2021) · Membranes · doi:10.3390/membranes12010055 · Cited by 23
Classification of peripheral blood neutrophils using deep learning
Tseng, T., & Huang, H. (2022) · Cytometry Part A · doi:10.1002/cyto.a.24698 · Cited by 23
CoCas9 is a compact nuclease from the human microbiome for efficient and precise genome editing
Pedrazzoli, E., Demozzi, M., Visentin, E., Ciciani, M., Bonuzzi, I., Pezzè, L., Lucchetta, L., Maule, G., Amistadi, S., Esposito, F., et al. (2024) · Nature Communications · doi:10.1038/s41467-024-47800-9 · Cited by 26
The Potential of CRISPR-Guided Therapies in the Dermatology Clinic
Bhat, P., & Garibyan, L. (2022) · JID Innovations · doi:10.1016/j.xjidi.2022.100103 · Cited by 22
Liang, L. C., Sulaiman, N. S., & Yazid, M. D. (2022) · Frontiers in Bioengineering and Biotechnology · doi:10.3389/fbioe.2022.833833 · Cited by 23
Khan, H., Naseem, T., Kaushik, P., Narang, J., Khan, R., Panwar, S., & Parvez, S. (2024) · Ageing Research Reviews · doi:10.1016/j.arr.2024.102535 · Cited by 21
In Vitro, In Vivo, and In Silico Methods for Assessment of Muscle Size and Muscle Growth Regulation
Rupert, J. E., Jengelley, D. H. A., & Zimmers, T. A. (2020) · Shock · doi:10.1097/shk.0000000000001498 · Cited by 20
Goodwin, M. S., Croft, C. L., Futch, H. S., Ryu, D. H., Ceballos‐Diaz, C., Liu, X., Paterno, G., Mejia, C., Deng, D. Z., Menezes, K., et al. (2020) · Molecular Neurodegeneration · doi:10.1186/s13024-020-00361-z · Cited by 19
Katsikis, G., Hwang, I. E., Wang, W., Bhat, V. S., McIntosh, N. L., Karim, O. A., Blus, B. J., Sha, S., Agache, V., Wolfrum, J. M., et al. (2022) · Nano Letters · doi:10.1021/acs.nanolett.1c04092 · Cited by 20
Singh, S. K., Gaur, A., Sharma, R. K., Kumari, R., Prakash, S., Kumari, S., Chaudhary, A. D., Prasun, P., Pant, P., Hunkler, H. J., et al. (2023) · Basic Research in Cardiology · doi:10.1007/s00395-023-01016-y · Cited by 18
Pérez‐Rubio, P., Lavado‐García, J., Bosch-Molist, L., Lorenzo, E., Cervera, L., & Gòdia, F. (2024) · Molecular Therapy — Methods & Clinical Development · doi:10.1016/j.omtm.2024.101190 · Cited by 18
Recent advances in upstream process development for production of recombinant adeno‐associated virus
Ou, J., Tang, Y., Xu, J., Tucci, J., Borys, M., & Khetan, A. (2023) · Biotechnology and Bioengineering · doi:10.1002/bit.28545 · Cited by 17
Rghei, A. D., Stevens, B. A. Y., Thomas, S. P., Yates, J. G. E., McLeod, B. M., Karimi, K., Susta, L., Bridle, B. W., & Wootton, S. K. (2021) · Journal of Visualized Experiments · doi:10.3791/62727 · Cited by 16
Review on extraction technology and function of plant-derived exosome-like nanoparticles
Cheng, J., & Zhu, Y. (2025) · Frontiers in Medical Technology · doi:10.3389/fmedt.2025.1668738 · Cited by 18
Enkhjargal, B., Leon, S. S. P. D., Tsukahara, Y., Liu, H., Huangfu, Y., Wang, Y., Seabra, P. M., Xiao-qiu, Y., Goodman, J. B., Wan, X., et al. (2023) · Arteriosclerosis Thrombosis and Vascular Biology · doi:10.1161/atvbaha.123.319145 · Cited by 16
Self-citationRational immunosilencing of a promiscuous T-cell epitope in the capsid of an adeno-associated virus
Bing, S. J., Seirup, M., Hoang, T. T., Najera, S. S., Britten, C. N., Warrington, S., Chu, S.-L., & Mazor, R. (2023) · Nature Biomedical Engineering · doi:10.1038/s41551-023-01129-8 · Cited by 17
Polyethylene glycol precipitation: fundamentals and recent advances
Royo, M. D. C. P., & Jungbauer, A. (2025) · Preparative Biochemistry & Biotechnology · doi:10.1080/10826068.2025.2470220 · Cited by 16
Cui, L., Song, Y., Hou, Z., Yang, L., Guo, S., & Wang, C. (2025) · Journal of Nanobiotechnology · doi:10.1186/s12951-025-03461-4 · Cited by 18
Qian, S., Pan, L., Chen, G., Qiu, F., Ma, Y., Li, R., Mehta, J. L., & Wang, X. (2026) · Pharmacological Reviews · doi:10.1016/j.pharmr.2026.100127 · Cited by 16
Xue, W., Fulco, C., Sha, S., Alden, N. A., Panteli, J., Hossler, P., & Warren, J. (2024) · Molecular Therapy — Methods & Clinical Development · doi:10.1016/j.omtm.2024.101266 · Cited by 15
Therapeutic Application and Structural Features of Adeno-Associated Virus Vector
Matsuzaka, Y., & Yashiro, R. (2024) · Current Issues in Molecular Biology · doi:10.3390/cimb46080499 · Cited by 15
Targeting Human Osteoarthritic Chondrocytes with Ligand Directed Bacteriophage-Based Particles
Chongchai, A., Waramit, S., Wongwichai, T., Kampangtip, J., Phitak, T., Kongtawelert, P., Hajitou, A., Suwan, K., & Pothacharoen, P. (2021) · Viruses · doi:10.3390/v13122343 · Cited by 14
Tsukahara, Y., Ferrán, B., Minetti, E. T., Chong, B. S. H., Gower, A. C., Bachschmid, M. M., & Matsui, R. (2022) · Antioxidants · doi:10.3390/antiox11050867 · Cited by 14
Self-citationLevin, N., Hendler‐Neumark, A., Kamber, D., & Bisker, G. (2024) · Journal of Colloid and Interface Science · doi:10.1016/j.jcis.2024.03.039 · Cited by 14
Optical constraints on two-photon voltage imaging
Brooks, F. P., Davis, H. C., Wong-Campos, J. D., & Cohen, A. E. (2024) · Neurophotonics · doi:10.1117/1.nph.11.3.035007 · Cited by 14
Sikhosana, S. T., Gumede, T. P., Malebo, N. J., Ogundeji, A. O., & Motloung, B. (2023) · Polymer Engineering & Science · doi:10.1002/pen.26293 · Cited by 13
Qiao, Y., Sun, Z., Tan, C., Lai, J., Sun, X., & Chen, J. (2022) · Investigative Ophthalmology & Visual Science · doi:10.1167/iovs.63.13.15 · Cited by 13
Turco, F., Wegelius, A., Lind, O., Norrman, N., Magnusson, A.-C., Sund-Lundström, C., Norén, B., Hedberg, J. J., & Palmgren, R. (2023) · Molecular Therapy — Methods & Clinical Development · doi:10.1016/j.omtm.2023.07.010 · Cited by 13
Tissue- and isoform-specific protein complex analysis with natively processed bait proteins
Beyer, T., Klose, F., Kuret, A., Hoffmann, F., Łukowski, R., Ueffing, M., & Boldt, K. (2020) · Journal of Proteomics · doi:10.1016/j.jprot.2020.103947 · Cited by 13
Exploration of Gene Therapy for Alport Syndrome
Zhao, Y., Zheng, Q., & Xie, J. (2024) · Biomedicines · doi:10.3390/biomedicines12061159 · Cited by 12
Thakur, G., Mink, S. R., Garcia, A. J., Bak, H., & Tustian, A. D. (2025) · Molecular Therapy — Methods & Clinical Development · doi:10.1016/j.omtm.2025.101441 · Cited by 14
Advances in Optogenetics Applications for Central Nervous System Injuries
Geng, Y., Li, Z., Zhu, J., Du, C., Yuan, F., Cai, X., Ali, A., Yang, J., Tang, C., Cong, Z., et al. (2022) · Journal of Neurotrauma · doi:10.1089/neu.2022.0290 · Cited by 12
Liu, H., Hastings, M. H., Kitchen, R. R., Xiao, C., Guerra, J. R. B., Kuznetsov, A., & Rosenzweig, A. (2022) · Arteriosclerosis Thrombosis and Vascular Biology · doi:10.1161/atvbaha.122.318138 · Cited by 12
Improving AAV Production Yield and Quality for Different Serotypes Using Distinct Processing Methods
Khaparde, A., Patra, R., Roy, S., R, S. B. G., & Ghosh, A. (2025) · ACS Omega · doi:10.1021/acsomega.4c10900 · Cited by 9
Glazkova, D. V., Bogoslovskaya, E. V., Urusov, F. A., Павловна, К. Н., Андреевна, Г. Е., Gracheva, A. V., Файзулоев, Е. Б., Trunova, G. V., Андреевна, Х. В., Si, B., et al. (2022) · Molecular Biology · doi:10.1134/s0026893322050065 · Cited by 11
De, B. P., Cram, S., Lee, H., Rosenberg, J. B., Sondhi, D., Crystal, R. G., & Kaminsky, S. M. (2023) · Human Gene Therapy · doi:10.1089/hum.2023.032 · Cited by 9
Silencing FAF2 mitigates alcohol-induced hepatic steatosis by modulating lipolysis and PCSK9 pathway
Huda, N., Kusumanchi, P., Jiang, Y., Gao, H., Thoudam, T., Zeng, G., Skill, N. J., Sun, Z., Liangpunsakul, S., Ma, J., et al. (2025) · Hepatology Communications · doi:10.1097/hc9.0000000000000641 · Cited by 11
Gephyrin filaments represent the molecular basis of inhibitory postsynaptic densities
Macha, A., Liebsch, F., Bruckisch, E. H. W., Burdina, N., von Stuelpnagel, I., Benting, K., Gunkel, M., Behrmann, E., & Schwarz, G. (2025) · Nature Communications · doi:10.1038/s41467-025-63748-w · Cited by 10
Exploring the design space of AAV transient-transfection in suspension cell lines
Meade, O., Clark, J. R., McCutchen, M., & Kerwin, J. (2021) · Methods in enzymology on CD-ROM/Methods in enzymology · doi:10.1016/bs.mie.2021.08.003 · Cited by 9
Optimization of Large‐Scale Adeno‐Associated Virus (AAV) Production
Bilal, A. S., Parker, S., Murray, V. B., MacDonnell, L. F., Thuerauf, D. J., Glembotski, C. C., & Blackwood, E. A. (2023) · Current Protocols · doi:10.1002/cpz1.757 · Cited by 9
Engineering Genetic Systems for Treating Mitochondrial Diseases
Jang, Y., Ahn, S. R., Shim, J.-Y., & Lim, K. (2021) · Pharmaceutics · doi:10.3390/pharmaceutics13060810 · Cited by 9
The Delivery Challenge of Genome Editing in Human Epithelia
Calderón, M., & Hedtrich, S. (2021) · Advanced Healthcare Materials · doi:10.1002/adhm.202100847 · Cited by 10
Luthers, C. R., Ha, S.-M., Mittelhauser, A., Morselli, M., Long, J. D., Kuo, C. Y., Romero, Z. G., & Kohn, D. B. (2024) · Molecular Therapy — Methods & Clinical Development · doi:10.1016/j.omtm.2024.101334 · Cited by 8
Live STED imaging of functional neuroanatomy
Arizono, M., Idziak, A., & Nägerl, U. V. (2025) · Nature Protocols · doi:10.1038/s41596-024-01132-6 · Cited by 8
Pérez‐Rubio, P., Vendrell-Flotats, M., Lorenzo, E., Enemark‐Rasmussen, K., Cervera, L., Gòdia, F., & Lavado‐García, J. (2024) · Biomedicine & Pharmacotherapy · doi:10.1016/j.biopha.2024.116893 · Cited by 9
Automated Image Analysis Reveals Different Localization of Synaptic Gephyrin C4 Splice Variants
Liebsch, F., Eggersmann, F. R., Merkler, Y., Kloppenburg, P., & Schwarz, G. (2022) · eNeuro · doi:10.1523/eneuro.0102-22.2022 · Cited by 10
Muscle cell‐derived Ccl8 is a negative regulator of skeletal muscle regeneration
Boss‐Kennedy, A., Kim, D., Barai, P., Maldonado, V. C., Reyes‐Ordoñez, A., & Chen, J. (2024) · The FASEB Journal · doi:10.1096/fj.202400184r · Cited by 7
Approaches to purification and concentration of rAAV vectors for gene therapy
Belova, L., Kochergin-Nikitsky, K. S., Erofeeva, A., Лавров, А. В., & Smirnikhina, S. (2022) · BioEssays · doi:10.1002/bies.202200019 · Cited by 8
In Vivo Investigation of Gene Function in Muscle Stem Cells by CRISPR/Cas9-Mediated Genome Editing
He, L., He, Z., Li, Y., Sun, H., & Wang, H. (2023) · Methods in molecular biology · doi:10.1007/978-1-0716-3036-5_21 · Cited by 7
Neto, S., Mendes, J. P., Santos, S. B. D., Solbrand, A., Carrondo, M. J. T., Peixoto, C., & Silva, R. J. S. (2023) · Frontiers in Bioengineering and Biotechnology · doi:10.3389/fbioe.2023.1183974 · Cited by 7
Ulgekar, G., Kaur, D., Ganesan, V., Sharma, S. S., Ganguli, N., & Majumdar, S. S. (2022) · Biotechnology and Bioengineering · doi:10.1002/bit.28196 · Cited by 6
Szarzynski, A., Oliver Spadiut, A., Reisbeck, M., Jobst, G., Paterson, R. L., Kamenskaya, A., Gateau, E., Lesch, H. P., Henry, L., & Kozma, B. (2025) · Frontiers in Bioengineering and Biotechnology · doi:10.3389/fbioe.2025.1563878 · Cited by 6
Klotho senses mechanical stimuli and modulates tension-induced osteogenesis
Men, X., Chiou, W.-C., Li, X., Li, Q., Chen, X., Zhang, K., Jiang, X., & Chen, S. (2025) · Bone · doi:10.1016/j.bone.2025.117464 · Cited by 6
Polo-like kinase inhibitors increase AAV production by halting cell cycle progression
Fisher, K., Grafton, F., Ispaso, F., Tworig, J. M., Derler, R., Sonntag, F., Hörer, M., Schulze, A., Reid, C. A., & Mandegar, M. A. (2025) · Molecular Therapy — Methods & Clinical Development · doi:10.1016/j.omtm.2025.101412 · Cited by 6
Park, J.-Y., Sivasankar, C., Hewawaduge, C., & Lee, J. H. (2023) · Microbial Pathogenesis · doi:10.1016/j.micpath.2023.106079 · Cited by 6
Delivery of AAV for Expression of Fluorescent Biosensors in Juvenile Mouse Hippocampus
Díaz-García, C., Nathwani, N., Martínez‐François, J. R., & Yellen, G. (2021) · BIO-PROTOCOL · doi:10.21769/bioprotoc.4259 · Cited by 6
Oncolytic viruses: a promising therapy for malignant pleural effusion and solid tumors
Wang, X., Zhou, Q., Zhang, X. L., Hu, H., Liu, B., & Wang, Y. (2025) · Frontiers in Immunology · doi:10.3389/fimmu.2025.1570698 · Cited by 5
The adhesion GPCR ADGRL2 engages Gα13 to enable epidermal differentiation
Yang, X., He, F., Lopez-Pajares, V., Porter, D. F., Garbett, K. A., Siprashvili, Z., Ducoli, L., Meyers, R. M., Reynolds, D. L., Bui, D. L. H., et al. (2025) · Proceedings of the National Academy of Sciences · doi:10.1073/pnas.2508436122 · Cited by 5
Zhang, Z., Chen, G., Zheng, K., Lin, M., Zheng, D., Lu, Y., Huang, L., Chen, X., & Gan, R. (2026) · International Journal of Nanomedicine · doi:10.2147/ijn.s592968 · Cited by 5
Fisher, C. R., Ebeling, M. C., & Ferrington, D. A. (2022) · Experimental Eye Research · doi:10.1016/j.exer.2022.108981 · Cited by 5
Zhang, Y., Wang, L., Wang, L., Yang, J. C., Wu, X., Xiao, X., & Wang, J. (2023) · Human Gene Therapy · doi:10.1089/hum.2023.041 · Cited by 6
Metadata
- Authors
- Kimura, T., Ferran, B., Tsukahara, Y., Shang, Q., Desai, S., Fedoce, A., Pimentel, D. R., Luptak, I., Adachi, T., Ido, Y., Matsui, R., & Bachschmid, M. M.
- Affiliations
- Boston University (US)
- National Defense Medical College Hospital (JP)
- Corresponding author
- Matsui, Reiko
- Bachschmid, Markus Michael
- ORCID
- Venue
- Scientific Reports
- Published
- 2019-09-19
- Volume
- 9
- Issue
- 1
- Pages
- 13601-13601
- ISSN
- 2045-2322 (ISSN-L)
- PMC
- PMC6753157
- OpenAlex
- W2973390883
- Cited by
- 155
- References
- 70
- Citations by year
- 2026: 18 · 2025: 30 · 2024: 27 · 2023: 27 · 2022: 23 · 2021: 20 · 2020: 10
- FWCI
- 7.98
- Type
- journal article
- Language
- en
- Open access
- gold
- doi.org
- Locations
- Scientific Reports (publishedVersion, cc-by)
- PubMed Central (publishedVersion, cc-by)
- PubMed (publishedVersion)
- DOAJ (DOAJ: Directory of Open Access Journals) (submittedVersion)
- Funders
- American Heart Association (15FTF25890062, 16GRNT27660006)
- School of Medicine, Boston University (1UL1TR001430)
- National Defense Medical College
- Ministry of Education, Culture, Sports, Science and Technology
- Ministry of Defense
- National Institutes of Health (NIH T32, 15FTF25890062, UL1TR001430)
- Japan Society for the Promotion of Science (18H02815)
- National Institute on Aging (R03AG051857)
- National Heart, Lung, and Blood Institute (T32HL007224, R01HL133013)
- National Institute of Diabetes and Digestive and Kidney Diseases (R01DK103750)
- National Center for Advancing Translational Sciences
- Topics
- Life Sciences › Biochemistry, Genetics and Molecular Biology › Genetics › Virus-based gene therapy research
- Life Sciences › Biochemistry, Genetics and Molecular Biology › Molecular Biology › RNA Interference and Gene Delivery
- Life Sciences › Biochemistry, Genetics and Molecular Biology › Molecular Biology › Viral Infectious Diseases and Gene Expression in Insects
- Keywords
- adeno-associated virus vectors, AAV production, HEK293T cells, polyethylene glycol precipitation, aqueous two-phase extraction, viral titer, in vivo transduction, glutaredoxin 1, shRNA, liver, skeletal muscle, gene therapy
- MeSH terms
- Proof of Concept Study, Dependovirus, Animals, Cell Line, Genetic Vectors, Humans, Liver, Male, Polyethylenes, Chemical Precipitation, Transduction, Genetic, Down-Regulation, Muscle, Skeletal, Viral Load, RNA, Small Interfering, Glutaredoxins, HEK293 Cells
About these checks
Registry, retraction, Cites and statistics results are computed, not judged, with one exception: a printed reference that no index lists is read once by a model before it counts as a citation error. Claims are extracted by a model and kept only when their quote appears verbatim in the text; each cited source is then checked, with a model’s help, for whether it says what the claim relies on. Those verdicts can be wrong — read the claim’s quote and the cited source before relying on one.
Statistics and arithmetic are recomputed, not judged.
Confidence bands are shown only for fields calibrated on our annotated test set. None is calibrated yet, so no band is shown.
What counts as a claim ›How we measure confidence ›How we check this ›
Are you an author, or do you see a problem with this page? Request a review
