

The DOI matches its Crossref record; 67 of the 67 references it cites were found in a registry or an index.
Neural correlates of the DMT experience assessed with multivariate EEG
Open accessPublished version of a preprint
Abstract
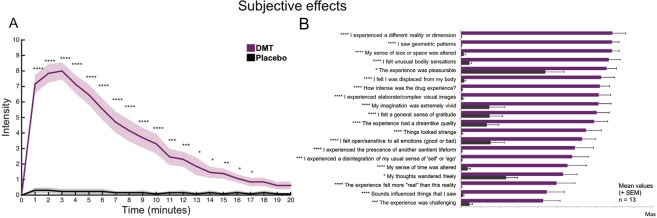
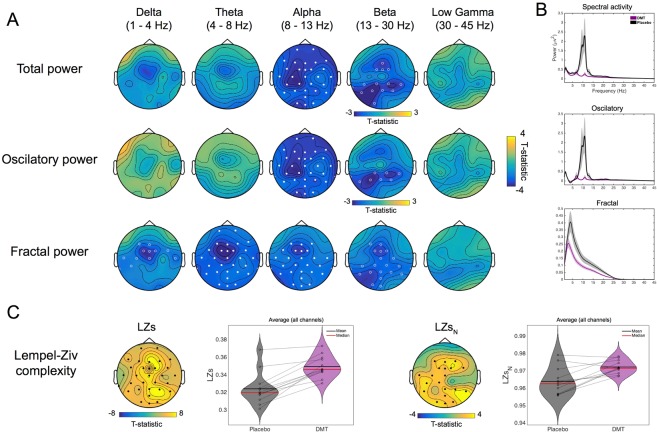
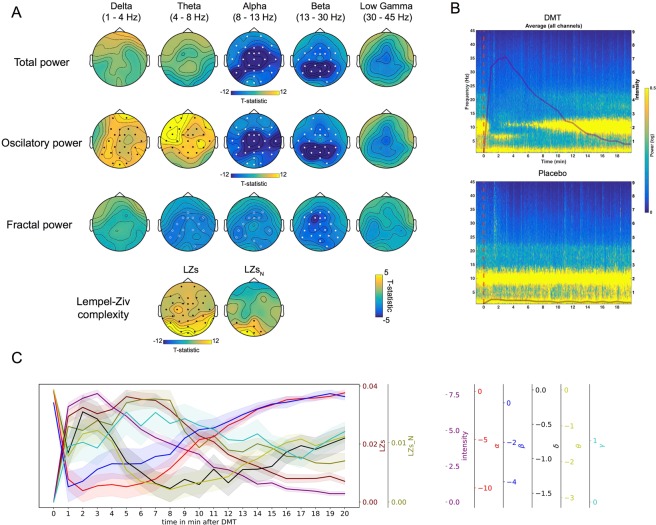
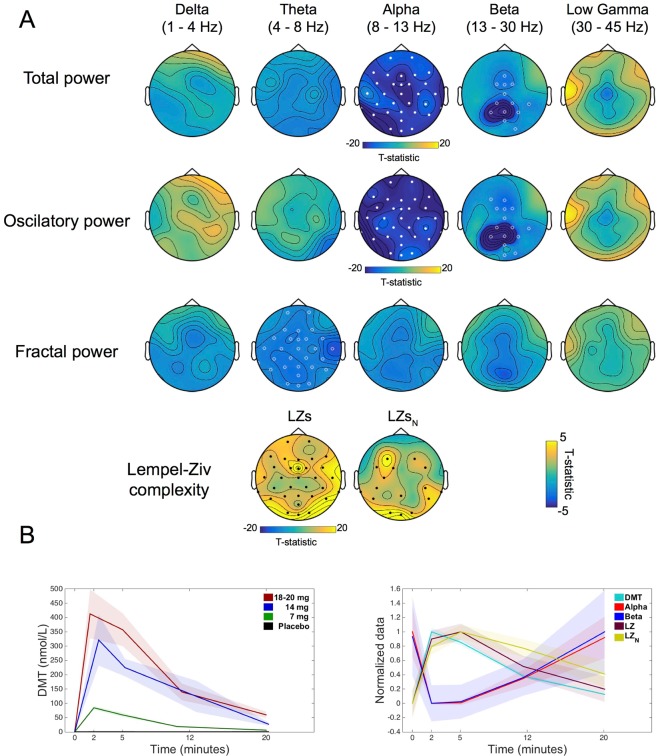
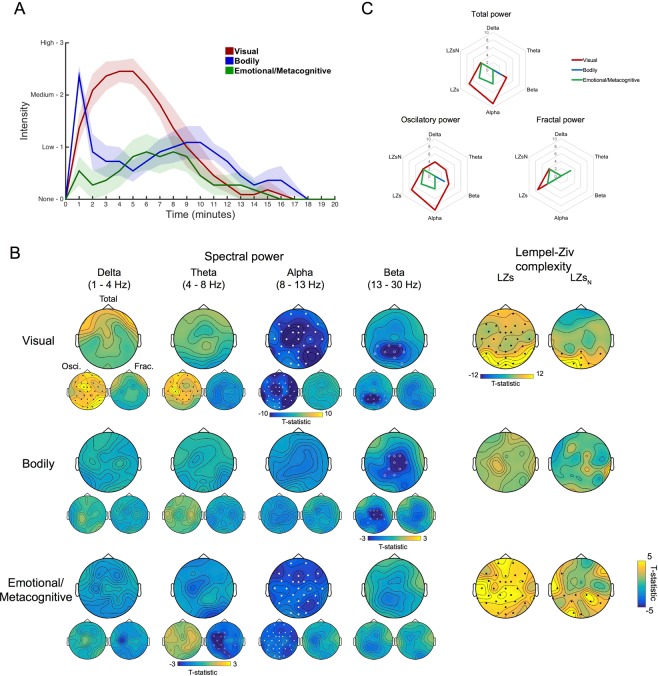
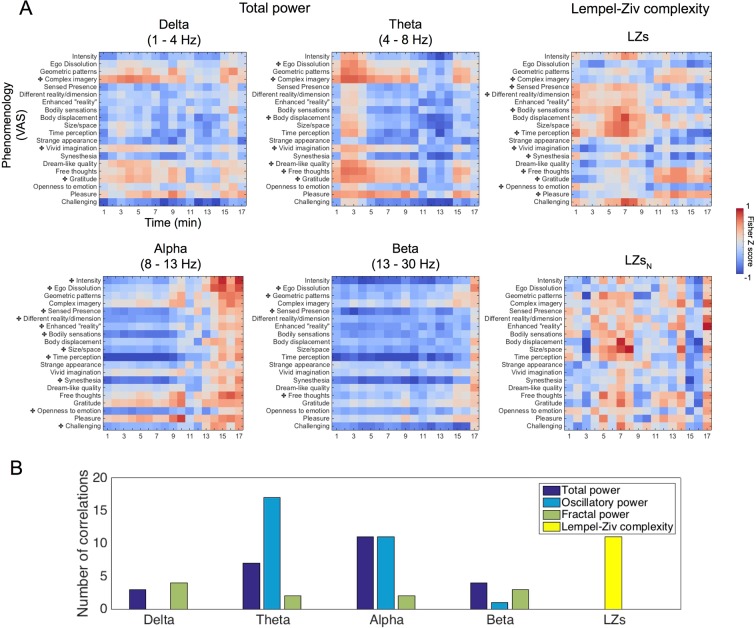
Studying transitions in and out of the altered state of consciousness caused by intravenous (IV) N,N-Dimethyltryptamine (DMT - a fast-acting tryptamine psychedelic) offers a safe and powerful means of advancing knowledge on the neurobiology of conscious states. Here we sought to investigate the effects of IV DMT on the power spectrum and signal diversity of human brain activity (6 female, 7 male) recorded via multivariate EEG, and plot relationships between subjective experience, brain activity and drug plasma concentrations across time. Compared with placebo, DMT markedly reduced oscillatory power in the alpha and beta bands and robustly increased spontaneous signal diversity. Time-referenced and neurophenomenological analyses revealed close relationships between changes in various aspects of subjective experience and changes in brain activity. Importantly, the emergence of oscillatory activity within the delta and theta frequency bands was found to correlate with the peak of the experience - particularly its eyes-closed visual component. These findings highlight marked changes in oscillatory activity and signal diversity with DMT that parallel broad and specific components of the subjective experience, thus advancing our understanding of the neurobiological underpinnings of immersive states of consciousness.
Overview
The claims and statistics of this paper haven’t been checked yet.
Run the check — free, no account needed. It reads the open-access text and checks the sources it cites.
Integrity signals
Registry
Cites
Statistics
Figures
Verification
Claims the paper makes
The claims and statistics of this paper haven’t been checked yet.
Run the check — free, no account needed. It reads the open-access text and checks the sources it cites.
Claims other papers make about this one
Each is checked against this paper’s own text: does it say what the citing paper says it does?
The cited source says what the claim attributes to it.
In the citing paper
“While other studies investigating psychedelics often include participants with previous psychedelic experience (17, 18), we excluded participants more than 15 lifetime psychedelic experiences resulting in a sample with no or only little previous psychedelic experience.”
From Potential therapeutic effects of an ayahuasca-inspired N,N-DMT and harmine formulation: a controlled trial in healthy subjects (2024) · cites this paper as [17]
Self-check
Percentages, sums and reported differences re-computed from the paper’s own numbers.
The self-check needs the paper’s full text.
Citations
Cites
Oostenveld, R., Fries, P., Maris, E., & Schoffelen, J.-M. (2011) · Computational Intelligence and Neuroscience · doi:10.1155/2011/156869 · Cited by 10,323
Buzsáki, G. (2006) · doi:10.1093/acprof:oso/9780195301069.001.0001 · Cited by 4,873
The origin of extracellular fields and currents — EEG, ECoG, LFP and spikes
Buzsáki, G., Anastassiou, C. A., & Koch, C. (2012) · Nature Reviews Neuroscience · doi:10.1038/nrn3241 · Cited by 4,225
What we can do and what we cannot do with fMRI
Logothetis, N. K. (2008) · Nature · doi:10.1038/nature06976 · Cited by 3,612
Alpha-band oscillations, attention, and controlled access to stored information
Klimesch, W. (2012) · Trends in Cognitive Sciences · doi:10.1016/j.tics.2012.10.007 · Cited by 3,310
Limb proportions show developmental plasticity in response to embryo movement
Pollard, A. S., Charlton, B., Hutchinson, J. R., Gustafsson, T. P., McGonnell, I. M., Timmons, J. A., & Pitsillides, A. A. (2017) · Scientific Reports · doi:10.1038/srep41926 · Cited by 2,377
Nichols, D. E. (2016) · Pharmacological Reviews · doi:10.1124/pr.115.011478 · Cited by 1,762
Fleming, S. M., & Lau, H. C. (2014) · Frontiers in Human Neuroscience · doi:10.3389/fnhum.2014.00443 · Cited by 1,408
(1996) · Journal of Consciousness Studies · Cited by 1,338
Carhart-Harris, R. L., Leech, R., Hellyer, P. J., Shanahan, M., Feilding, A., Tagliazucchi, E., Chialvo, D. R., & Nutt, D. (2014) · Frontiers in Human Neuroscience · doi:10.3389/fnhum.2014.00020 · Cited by 1,252
Self-citation
Research works printed but not linked: 1
- Strassman, R. DMT: The spirit molecule. (Park Street Press, 2001).
Cited by
Sorted by citations
Items 101–200 of 309
Multi-metric evaluations of acute psychedelic effects on fMRI brain entropy
McCulloch, D. E.-W., Olsen, A. S., Ozenne, B., Larsen, K. O., Stenbæk, D. S., Armand, S., Madsen, M. K., Knudsen, G. M., & Fisher, P. M. (2026) · Nature Communications · doi:10.1038/s41467-026-74215-5 · Cited by 29
Frohlich, J., Bird, L. M., Dell’Italia, J., Johnson, M. A., Hipp, J. F., & Monti, M. M. (2020) · Neuroscience of Consciousness · doi:10.1093/nc/niaa005 · Cited by 25
González, J., Cavelli, M., Castro‐Zaballa, S., Mondino, A., Tort, A. B. L., Rubido, N., Carrera, I., & Torterolo, P. (2021) · ACS Pharmacology & Translational Science · doi:10.1021/acsptsci.0c00164 · Cited by 25
EEG Signal Diversity Varies With Sleep Stage and Aspects of Dream Experience
Aamodt, A., Nilsen, A. S., Thürer, B., Moghadam, F. H., Kauppi, N., Juel, B. E., & Storm, J. F. (2021) · Frontiers in Psychology · doi:10.3389/fpsyg.2021.655884 · Cited by 23
Chowdhury, A., Bianciardi, M., Chapdelaine, E., Riaz, O. S., Timmermann, C., van Lutterveld, R., Sparby, T., & Sacchet, M. D. (2024) · NeuroImage · doi:10.1016/j.neuroimage.2024.120973 · Cited by 27
Self-citationBrain Complexities and Anesthesia: Their Meaning and Measurement
Li, D., Fabus, M. S., & SLEIGH, J. W. (2022) · Anesthesiology · doi:10.1097/aln.0000000000004293 · Cited by 23
Casarotto, S., Hassan, G., Rosanova, M., Sarasso, S., Derchi, C., Trimarchi, P. D., Viganò, A., Russo, S., Fecchio, M., Devalle, G., et al. (2024) · European Journal of Neuroscience · doi:10.1111/ejn.16299 · Cited by 23
Psychedelics and the ‘inner healer’: Myth or mechanism?
Peill, J. M., Marguilho, M., Erritzøe, D., Barba, T., Greenway, K. T., Rosas, F. E., Timmermann, C., & Carhart-Harris, R. L. (2024) · Journal of Psychopharmacology · doi:10.1177/02698811241239206 · Cited by 24
Self-citationHalgren, M., Kang, R., Voytek, B., Ulbert, I., Fabó, D., Erőss, L., Wittner, L., Madsen, J. R., Doyle, W., Devinsky, O., et al. (2021) · bioRxiv (Cold Spring Harbor Laboratory) · doi:10.1101/2021.07.28.454235 · Cited by 22
Inter-individual variability in neural response to low doses of LSD
Hutten, N. R. P. W., Quaedflieg, C. W. E. M., Mason, N. L., Theunissen, E. L., Liechti, M. E., Duthaler, U., Kuypers, K. P. C., Bonnelle, V., Feilding, A., & Ramaekers, J. G. (2024) · Translational Psychiatry · doi:10.1038/s41398-024-03013-8 · Cited by 22
Report from a Tibetan Monastery: EEG neural correlates of concentrative and analytical meditation
Neri, B., Callara, A. L., Vanello, N., Menicucci, D., Zaccaro, A., Piarulli, A., Laurino, M., Norbu, N., Kechok, J., Sherab, N., et al. (2024) · Frontiers in Psychology · doi:10.3389/fpsyg.2024.1348317 · Cited by 20
Brito, M. A., Li, D., Fields, C. W., Rybicki-Kler, C., Dean, J. G., Liu, T., Mashour, G. A., & Pal, D. (2021) · Anesthesia & Analgesia · doi:10.1213/ane.0000000000005835 · Cited by 20
James, E., Erritzøe, D., Benway, T. A., Joel, Z., Timmermann, C., Good, M., Agnorelli, C., Weiss, B., Barba, T., Campbell, G., et al. (2024) · Frontiers in Psychiatry · doi:10.3389/fpsyt.2023.1305796 · Cited by 20
Self-citationMantas, I., Flais, I., Masarapu, Y., Ionescu, T. M., Frapard, S., Jung, F., Merre, P. L., Saarinen, M., Tiklová, K., Salmani, B. Y., et al. (2024) · Nature Communications · doi:10.1038/s41467-024-52429-9 · Cited by 21
Bonnelle, V., Feilding, A., Rosas, F. E., Nutt, D. J., Carhart-Harris, R. L., & Timmermann, C. (2024) · Journal of Psychopharmacology · doi:10.1177/02698811241276788 · Cited by 24
Self-citationMichael, P., Luke, D. P., & Robinson, O. C. (2023) · Frontiers in Psychology · doi:10.3389/fpsyg.2023.1083356 · Cited by 22
Neural complexity and the spectral slope characterise auditory processing in wakefulness and sleep
Alnes, S. L., Bächlin, L. Z. M., Schindler, K. A., & Tzovara, A. (2023) · European Journal of Neuroscience · doi:10.1111/ejn.16203 · Cited by 19
Oña, G., Sampedro, F., Romero, S., Valle, M., Camacho, V., Migliorelli, C., Mañanas, M. Á., Antonijoan, R. M., Puntes, M., Coimbra, J., et al. (2021) · The International Journal of Neuropsychopharmacology · doi:10.1093/ijnp/pyab063 · Cited by 19
Eckernäs, E., Bendrioua, A., Cancellerini, C., Timmermann, C., Carhart-Harris, R. L., Hoffmann, K., & Ashton, M. (2022) · Journal of Pharmaceutical and Biomedical Analysis · doi:10.1016/j.jpba.2022.114642 · Cited by 19
Self-citationMartial, C., Cassol, H., Slater, M., Bourdin, P., Mensen, A., Oliva, R., Laureys, S., & Nùñez, P. (2023) · Journal of Cognitive Neuroscience · doi:10.1162/jocn_a_02011 · Cited by 17
Neural network models for DMT-induced visual hallucinations
Schartner, M. M., & Timmermann, C. (2020) · Neuroscience of Consciousness · doi:10.1093/nc/niaa024 · Cited by 18
Self-citationKetamine and sleep modulate neural complexity dynamics in cats
Pascovich, C., Castro‐Zaballa, S., Mediano, P. A. M., Bor, D., Canales‐Johnson, A., Torterolo, P., & Bekinschtein, T. A. (2022) · European Journal of Neuroscience · doi:10.1111/ejn.15646 · Cited by 19
Panda, R., Vanhaudenhuyse, A., Piarulli, A., Annen, J., Athena Demertzi, A., Alnagger, N., Chennu, S., Laureys, S., Faymonville, M.-É., & Gosseries, O. (2023) · Journal of Cognitive Neuroscience · doi:10.1162/jocn_a_02019 · Cited by 18
LSD flattens the hierarchy of directed information flow in fast whole-brain dynamics
Shinozuka, K., Tewarie, P. K. B., Luppi, A. I., Lynn, C. W., Roseman, L., Muthukumaraswamy, S. D., Nutt, D. J., Carhart-Harris, R. L., Deco, G., & Kringelbach, M. L. (2024) · Imaging Neuroscience · doi:10.1162/imag_a_00420 · Cited by 16
Self-citationFortier, M., & Millière, R. (2020) · Neuroscience of Consciousness · doi:10.1093/nc/niaa004 · Cited by 16
Eckernäs, E., Timmermann, C., Carhart-Harris, R. L., Röshammar, D., & Ashton, M. (2023) · CPT Pharmacometrics & Systems Pharmacology · doi:10.1002/psp4.12933 · Cited by 15
Self-citationFrohlich, J., Mediano, P. A. M., Bavato, F., & Gharabaghi, A. (2023) · Communications Biology · doi:10.1038/s42003-023-04988-8 · Cited by 15
Vohryzek, J., Cabral, J., Timmermann, C., Atasoy, S., Roseman, L., Nutt, D. J., Carhart-Harris, R. L., Deco, G., & Kringelbach, M. L. (2024) · National Science Review · doi:10.1093/nsr/nwae124 · Cited by 15
Self-citationDemšar, E., & Windt, J. (2024) · Synthese Library/Synthese library · doi:10.1007/978-3-031-68204-9_5 · Cited by 16
Glynos, N. G., Huels, E. R., Groenhout, T., Raghu, A., Nelson, A. G., Kim, Y., Zeid, A. M., Liu, T., Mashour, G. A., Kennedy, R. T., et al. (2025) · Journal of Neuroscience · doi:10.1523/jneurosci.0742-24.2025 · Cited by 18
Segregated brain state during hypnosis
Tuominen, J., Kallio, S., Kaasinen, V., & Railo, H. (2021) · Neuroscience of Consciousness · doi:10.1093/nc/niab002 · Cited by 16
Synthetic surprise as the foundation of the psychedelic experience
Filippo, R. D., & Schmitz, D. (2024) · Neuroscience & Biobehavioral Reviews · doi:10.1016/j.neubiorev.2024.105538 · Cited by 17
Berkovitch, L., Fauvel, B., Preller, K. H., & Gaillard, R. (2025) · Neuroscience & Biobehavioral Reviews · doi:10.1016/j.neubiorev.2025.106239 · Cited by 16
Cozzi, N. V., & Daley, P. F. (2020) · Drug Testing and Analysis · doi:10.1002/dta.2889 · Cited by 15
Study protocol for “Psilocybin in patients with fibromyalgia: brain biomarkers of action”
Bornemann, J., Close, J. B., Ahmad, K., Barba, T., Godfrey, K., Macdonald, L., Erritzøe, D., Nutt, D., & Carhart-Harris, R. L. (2024) · Frontiers in Psychiatry · doi:10.3389/fpsyt.2024.1320780 · Cited by 15
Self-citationNicholas, C. R. N., Banks, M. I., Lennertz, R. C., Wenthur, C. J., Krause, B. M., Riedner, B. A., Smith, R., Hutson, P. R., Sauder, C. J., Dunne, J. D., et al. (2024) · Translational Psychiatry · doi:10.1038/s41398-024-03059-8 · Cited by 13
Self-citationContreras, A., Khumnark, M., Hines, R. M., & Hines, D. J. (2021) · Scientific Reports · doi:10.1038/s41598-021-81552-6 · Cited by 13
Spectrally and temporally resolved estimation of neural signal diversityPreprint
Mediano, P. A. M., Rosas, F. E., Luppi, A. I., Noreika, V., Seth, A. K., Carhart-Harris, R. L., Barnett, L., & Bor, D. (2023) · bioRxiv (Cold Spring Harbor Laboratory) · doi:10.1101/2023.03.30.534922 · Cited by 13
Self-citationDavid, J., Bouso, J. C., Kohek, M., Oña, G., Tadmor, N., Arnon, T., Dor‐Ziderman, Y., & Berkovich‐Ohana, A. (2023) · Frontiers in Psychiatry · doi:10.3389/fpsyt.2023.1287961 · Cited by 12
EEG signature of near-death-like experiences during syncope-induced periods of unresponsiveness
Martial, C., Piarulli, A., Gosseries, O., Cassol, H., Ledoux, D., Charland‐Verville, V., & Laureys, S. (2024) · NeuroImage · doi:10.1016/j.neuroimage.2024.120759 · Cited by 13
Vohryzek, J., Luppi, A. I., Atasoy, S., Deco, G., Carhart-Harris, R. L., Timmermann, C., & Kringelbach, M. L. (2025) · Neuropsychopharmacology · doi:10.1038/s41386-025-02190-4 · Cited by 12
Self-citationWhole-Brain Models to Explore Altered States of Consciousness from the Bottom Up
Cofré, R., Herzog, R. A., Mediano, P. A. M., Piccinini, J., Rosas, F. E., Perl, Y. S., & Tagliazucchi, E. (2020) · Brain Sciences · doi:10.3390/brainsci10090626 · Cited by 14
Brito, M. A., Li, D., Mashour, G. A., & Pal, D. (2020) · Frontiers in Systems Neuroscience · doi:10.3389/fnsys.2020.00050 · Cited by 12
Piarulli, A., Annen, J., Kupers, R. C., Laureys, S., & Martial, C. (2021) · Cells · doi:10.3390/cells10081991 · Cited by 12
Spectrally and temporally resolved estimation of neural signal diversityPreprint
Mediano, P. A. M., Rosas, F. E., Luppi, A. I., Noreika, V., Seth, A. K., Carhart-Harris, R. L., Barnett, L., & Bor, D. (2023) · doi:10.7554/elife.88683.1 · Cited by 12
Self-citationPascarella, A., Thölke, P., David Meunier, A., O’Byrne, J., Lajnef, T., Raffone, A., Guidotti, R., Pizzella, V., Marzetti, L., & Jerbi, K. (2025) · Neuroscience of Consciousness · doi:10.1093/nc/niaf047 · Cited by 13
Costines, C., & Schmidt, T. T. (2024) · Current topics in behavioral neurosciences · doi:10.1007/7854_2024_562 · Cited by 12
Clinical Pharmacokinetics of N,N-Dimethyltryptamine (DMT): A Systematic Review and Post-hoc Analysis
van der Heijden, K. V., Otto, M. E., Schoones, J. W., van Esdonk, M. J., Borghans, L. G. J. M., van Hasselt, J. G. C., van Gerven, J., & Jacobs, G. (2025) · Clinical Pharmacokinetics · doi:10.1007/s40262-024-01450-8 · Cited by 13
Psilocybin for disorders of consciousness: A case-report study
Cardone, P., Nùñez, P., Alnagger, N., Martial, C., van der Lande, G., Sandell, R., Carhart-Harris, R. L., & Gosseries, O. (2025) · Clinical Neurophysiology · doi:10.1016/j.clinph.2025.02.264 · Cited by 11
Self-citationEfthimiou, A. A., Cardinale, A. M., & Kepa, A. (2024) · Psychedelic Medicine · doi:10.1089/psymed.2023.0058 · Cited by 11
Mueller, M. J., Aicher, H., Dornbierer, D., Marten, L., Suay, D., Meling, D., Elsner, C., Wicki, I. A., Müller, J., Poetzsch, S. N., et al. (2024) · The International Journal of Neuropsychopharmacology · doi:10.1093/ijnp/pyaf001 · Cited by 10
Herrmann, C. (2025) · Psychology Crime and Law · doi:10.1080/1068316x.2025.2466073 · Cited by 10
Purple, R. J., Gupta, R., Thomas, C. W., Golden, C. T., Palomero‐Gallagher, N., Carhart-Harris, R. L., Froudist‐Walsh, S., & Jones, M. W. (2025) · Molecular Psychiatry · doi:10.1038/s41380-025-03182-y · Cited by 10
Self-citationPsychedelics and the Entropic Brain Beyond the Self
Eyghen, H. V. (2023) · International Journal for the Psychology of Religion · doi:10.1080/10508619.2023.2192078 · Cited by 11
Tylš, F., Vejmola, Č., Koudelka, V., Piorecká, V., Kadeřábek, L., Bochin, M., Novák, T., Kuchař, M., Bendová, Z., Brunovský, M., et al. (2023) · Frontiers in Neuroscience · doi:10.3389/fnins.2023.1152578 · Cited by 11
Nikolič, M., Mediano, P. A. M., Froese, T., Reydellet, D., & Páleníček, T. (2024) · medRxiv · doi:10.1101/2024.09.09.24313316 · Cited by 10
Orlowski, P., & Bola, M. (2023) · Scientific Reports · doi:10.1038/s41598-023-30639-3 · Cited by 11
Wießner, I., Falchi-Carvalho, M., Laborde, S., Barros, H., Bolcont, R., Silva, S. R. B., Pantrigo, É. J., Medina, M., Arichelle, F., de Almeida, R. N., et al. (2025) · European Neuropsychopharmacology · doi:10.1016/j.euroneuro.2025.06.002 · Cited by 9
Millière, R., & Newen, A. (2022) · Erkenntnis · doi:10.1007/s10670-022-00562-6 · Cited by 9
Discovery and In Vitro Characterization of SPL028: Deuterated N , N -Dimethyltryptamine
Layzell, M., Rands, P., Good, M., Joel, Z., Cousins, R. P. C., Benway, T. A., James, E., & Routledge, C. A. (2023) · ACS Medicinal Chemistry Letters · doi:10.1021/acsmedchemlett.3c00143 · Cited by 9
Structured Dynamics in the Algorithmic Agent
Ruffini, G., Castaldo, F., & Vohryzek, J. (2025) · Entropy · doi:10.3390/e27010090 · Cited by 11
Yu, Z.-P., Li, Q., Wu, Z.-X., Tang, Z.-H., Zhang, X., Wang, Z., Xu, P., & Shen, H. (2023) · Neuropharmacology · doi:10.1016/j.neuropharm.2023.109452 · Cited by 9
Froese, T., & Sykes, J. J. (2023) · Journal of Consciousness Studies · doi:10.53765/20512201.30.11.190 · Cited by 9
Spectrally and temporally resolved estimation of neural signal diversityPreprint
Mediano, P. A. M., Rosas, F. E., Luppi, A. I., Noreika, V., Seth, A. K., Carhart-Harris, R. L., Barnett, L., & Bor, D. (2023) · doi:10.7554/elife.88683 · Cited by 9
Self-citationGodfrey, K. E. M., Weiss, B., Zhang, X., Spriggs, M. J., Peill, J. M., Lyons, T., Carhart-Harris, R. L., & Erritzøe, D. (2024) · Neuroscience Applied · doi:10.1016/j.nsa.2024.104092 · Cited by 10
Self-citationTransient destabilization of whole brain dynamics induced by N,N-Dimethyltryptamine (DMT)
Piccinini, J., Perl, Y. S., Pallavicini, C., Deco, G., Kringelbach, M. L., Nutt, D., Carhart-Harris, R. L., Timmermann, C., & Tagliazucchi, E. (2025) · Communications Biology · doi:10.1038/s42003-025-07576-0 · Cited by 8
Self-citationThe Effects of Ayahuasca on Psychological Disorders: A Systematic Literature Review
Sheth, R., Parikh, E., Olayeye, K., Pfeifer, K., & Khanna, D. (2024) · Cureus · doi:10.7759/cureus.55574 · Cited by 8
Ruffini, G., Lopez-Sola, E., Palma, R., Sanchez-Todo, R., Vohryzek, J., Castaldo, F., & Friston, K. J. (2026) · Neural Computation · doi:10.1162/neco.a.1537 · Cited by 8
Primary states of consciousness: A review of historical and contemporary developments
Schoeller, F. (2023) · Consciousness and Cognition · doi:10.1016/j.concog.2023.103536 · Cited by 8
Roseby, W., Kettner, H., Roseman, L., Spriggs, M. J., Lyons, T., Peill, J., Giribaldi, B., Erritzøe, D., Nutt, D. J., & Carhart-Harris, R. L. (2025) · Frontiers in Psychology · doi:10.3389/fpsyg.2025.1580663 · Cited by 8
Self-citationMapping the phenomenology of intranasal 5-MeO-DMT in psychedelic-naïve healthy adults
Ermakova, A. O., Dunbar, F., Seynaeve, M., & Millière, R. (2025) · Scientific Reports · doi:10.1038/s41598-025-22620-z · Cited by 7
DMT-Induced Shifts in Criticality Correlate with Self-Dissolution
Irrmischer, M., Aqil, M., Luan, L., Wang, T., Engelbregt, H., Carhart-Harris, R. L., Linkenkaer‐Hansen, K., & Timmermann, C. (2025) · Journal of Neuroscience · doi:10.1523/jneurosci.0344-25.2025 · Cited by 7
Self-citationNasretdinov, A., Barrientos, S. A., Brys, I., Halje, P., & Petersson, P. (2023) · Frontiers in Neuroscience · doi:10.3389/fnins.2023.1175575 · Cited by 7
Lissemore, J. I., Chaiken, A., Cherian, K. N., Buchanan, D. M., Espil, F. M., Keynan, J. N., Sridhar, M., Rolle, C. E., Saggar, M., Keller, C. J., et al. (2025) · Nature Mental Health · doi:10.1038/s44220-025-00463-x · Cited by 8
Vigilance state dissociation induced by 5-MeO-DMT in mice
Bréant, B. J. B., Prius-Mengual, J., Andrews, A., Hoerder‐Suabedissen, A., Patel, J., Bannerman, D. M., Sharp, T., & Vyazovskiy, V. V. (2026) · Communications Biology · doi:10.1038/s42003-025-09412-x · Cited by 7
Erhan, E., Külahlı, İ., Kandemir, O., Cemiloglu, R., Yigitbasi, O. G., & Cüreoğlu, S. (1996) · PubMed · Cited by 7
Dearnley, B., Dervinis, M., Shaw, M., & Okun, M. (2021) · bioRxiv (Cold Spring Harbor Laboratory) · doi:10.1101/2021.08.22.457198 · Cited by 8
Carhart-Harris, R. L. (2026) · Brain · doi:10.1093/brain/awag206 · Cited by 7
Self-citationTranslational perspectives on brain-heart interplay: From methodologies to clinical applications
Saibene, M., Gu, Y., Ballegaard, M., Andersen, T., Bardram, J. E., & Puthusserypady, S. K. (2026) · Computers in Biology and Medicine · doi:10.1016/j.compbiomed.2026.111522 · Cited by 6
Psychedelic-assisted Psychotherapy in 3-D: Acceptance, Connectedness, and Defensiveness
Fischman, L. G. (2023) · Neuropsychoanalysis · doi:10.1080/15294145.2023.2255991 · Cited by 6
Using EEG to advance mindfulness science: A survey of emerging methods and approaches
Lin, Y., Atad, D. A., & Zanesco, A. P. (2024) · Biological Psychiatry Cognitive Neuroscience and Neuroimaging · doi:10.1016/j.bpsc.2024.09.012 · Cited by 6
Jiwani, Z., Goldberg, S. B., Stroud, J., Young, J., Curtin, J., Dunne, J. D., Simonsson, O., Webb, C. A., Carhart-Harris, R., & Schlosser, M. (2025) · PLOS ONE · doi:10.1371/journal.pone.0310160 · Cited by 6
Self-citationEffects of Psychedelic Microdosing on Cognitive Functions: A Systematic Review and Meta-Analysis.
Pinhas, N., Eidlman, N., Barnea, A., & Peled-Avron, L. (2025) · Neuroscience and Biobehavioral Reviews · doi:10.1016/j.neubiorev.2025.106493 · Cited by 5
Pasquini, L., Simon, A. J., Gallen, C. L., Kettner, H., Roseman, L., Gazzaley, A. H., Carhart-Harris, R. L., & Timmermann, C. (2025) · Imaging Neuroscience · doi:10.1162/imag_a_00541 · Cited by 5
Self-citationAyahuasca-inspired DMT/HAR formulation reduces brain differentiation between self and other faces
Suay, D., Aicher, H., Kometer, M., Mueller, M. J., Caflisch, L., Hempe, A., Steinhart, C. P., Elsner, C., Wicki, I. A., Müller, J., et al. (2025) · NeuroImage · doi:10.1016/j.neuroimage.2025.121247 · Cited by 5
McGovern, H. T., Aqil, M., Atasoy, S., & Carhart-Harris, R. L. (2025) · Neuroscience of Consciousness · doi:10.1093/nc/niaf039 · Cited by 6
Self-citationHow to set up a psychedelic study: Unique considerations for research involving human participants
Glennon, M. J., Bird, C., Yadav, P., Kleine, P., Suseelan, S., Boman-Markaki, C., Kotoula, V., Butler, M., Leech, R., Roseman, L., et al. (2026) · Neuroscience & Biobehavioral Reviews · doi:10.1016/j.neubiorev.2026.106657 · Cited by 5
Self-citationThe content of complex psychedelic experiences resulting from inhalation of N,N-dimethyltryptamine
Kagan, S. (2022) · Journal of Psychedelic Studies · doi:10.1556/2054.2022.00209 · Cited by 5
Alves, C. L., Ciba, M., Toutain, T. G. L. D. O., Porto, J. A. M., de Sena, E. P., Thielemann, C., & Rodrigues, F. A. (2024) · Journal of Physics Complexity · doi:10.1088/2632-072x/ad1c68 · Cited by 4
The gamma-band activity model of the near-death experience: a critique and a reinterpretation.
Shaw, N. A. (2024) · F1000Research · doi:10.12688/f1000research.151422.1 · Cited by 6
Divergent Perception: Framing Creative Cognition Through the Lens of Sensory Flexibility
Bellemare‐Pepin, A., & Jerbi, K. (2024) · The Journal of Creative Behavior · doi:10.1002/jocb.1525 · Cited by 7
Effects of psychedelics on human oscillatory brain activity
Godfrey, K. E. M., Luan, L., & Timmermann, C. (2025) · International review of neurobiology · doi:10.1016/bs.irn.2025.04.012 · Cited by 4
Self-citationLesur, M. R., Vidal, L. T., Longo, M. R., Slatman, J., Väljamäe, A., & Tajadura‐Jiménez, A. (2026) · Psychophysiology · doi:10.1111/psyp.70234 · Cited by 5
Goldy, S. P., Sepeda, N. D., Hilbert, S. N., Bari, B. A., Garcia‐Romeu, A., Gukasyan, N., Barrett, F. S., Yaden, D. B., & Nayak, S. M. (2026) · Psychiatry Research · doi:10.1016/j.psychres.2026.117010 · Cited by 4
Lawrence, D. W., Battista, A. P. D., & Timmermann, C. (2023) · Journal of Psychoactive Drugs · doi:10.1080/02791072.2023.2230568 · Cited by 4
Self-citationPharmacological Properties of Psychedelics with a Special Focus on Potential Harms
Holze, F., Liechti, M. E., & Müller, F. (2024) · Current topics in behavioral neurosciences · doi:10.1007/7854_2024_510 · Cited by 5
González-Trujano, M. E., Páez-Martínez, N., Krengel, F., Martínez-Vargas, D., Santiago, M. L., Cruz-López, B., Puentes-Guerrero, J. M., Díaz-Cantón, J. K., Reyes‐Chilpa, R., & Guzmán‐Gutiérrez, S. L. (2023) · Fitoterapia · doi:10.1016/j.fitote.2023.105602 · Cited by 4
Unraveling the complexity of rapid eye movement microstates: insights from nonlinear EEG analysis
Lu, Y., Yang, W., Zhang, X., Wu, L., Li, Y., Wang, X., & Huai, Y. (2024) · SLEEP · doi:10.1093/sleep/zsae105 · Cited by 6
Altered states phenomena induced by visual flicker light stimulationPreprint
Bartossek, M. T., Kemmerer, J., & Schmidt, T. T. (2020) · PsyArXiv (OSF Preprints) · doi:10.31234/osf.io/825nc · Cited by 4
Koning, E., McMillan, R. M., Keshen, A. R., Hay, P., Fernandez, A. V., Reynolds, J., & Touyz, S. W. (2025) · Journal of Eating Disorders · doi:10.1186/s40337-025-01394-9 · Cited by 4
Metadata
- Authors
- Timmermann, C., Roseman, L., Schartner, M., Milliere, R., Williams, L. T. J., Erritzoe, D., Muthukumaraswamy, S., Ashton, M., Bendrioua, A., Kaur, O., Turton, S., Nour, M. M., Day, C. M., Leech, R., Nutt, D. J., & Carhart-Harris, R. L.
- Affiliations
- Imperial College London (GB)
- University of Geneva (CH)
- University of Auckland (NZ)
- University of Gothenburg (SE)
- King's College London (GB)
- University of Oxford (GB)
- Corresponding author
- Timmermann, Christopher
- ORCID
- Venue
- Scientific Reports
- Published
- 2019-11-19
- Volume
- 9
- Issue
- 1
- Pages
- 16324-16324
- ISSN
- 2045-2322 (ISSN-L)
- PMC
- PMC6864083
- OpenAlex
- W2991342487
- Cited by
- 315
- References
- 66
- Citations by year
- 2026: 41 · 2025: 51 · 2024: 71 · 2023: 55 · 2022: 35 · 2021: 37 · 2020: 23 · 2019: 1
- FWCI
- 28.03
- Type
- journal article
- Language
- en
- Open access
- gold
- doi.org
- Locations
- Scientific Reports (publishedVersion, cc-by)
- bioRxiv (Cold Spring Harbor Laboratory) (acceptedVersion, cc-by-nc-nd)
- PubMed Central (publishedVersion, cc-by)
- PubMed (publishedVersion)
- Research Portal (King's College London) (publishedVersion, other-oa)
- DOAJ (DOAJ: Directory of Open Access Journals) (submittedVersion)
- UCL Discovery (University College London) (submittedVersion)
- eScholarship (California Digital Library) (submittedVersion, cc-by)
- Spiral (Imperial College London) (submittedVersion, cc-by)
- Funders
- Consejo Nacional de Ciencia y Tecnología
- Imperial College President's PhD Scholarship Scheme and Albert Hobohm
- RCUK | STFC | Central Laser Facility, Science and Technology Facilities Council
- SM is supported by a Rutherford Discovery Fellowship
- DJN is supported by the Safra Foundation
- RCH is supported by the Alex Mosley Charitable Trust and Ad Astra Chandaria Foundation
- Topics
- Social Sciences › Psychology › Clinical Psychology › Psychedelics and Drug Studies
- Social Sciences › Psychology › Social Psychology › Paranormal Experiences and Beliefs
- Life Sciences › Neuroscience › Cognitive Neuroscience › Neural dynamics and brain function
- Keywords
- N,N-dimethyltryptamine, DMT, altered states of consciousness, neural oscillations, signal diversity, subjective experience, neurophenomenology, delta oscillations, theta oscillations, plasma drug concentration
- MeSH terms
- Adult, Brain, Consciousness, N,N-Dimethyltryptamine, Electroencephalography, Female, Hallucinogens, Humans, Male, Multivariate Analysis, Case-Control Studies, Administration, Intravenous
About these checks
Registry, retraction, Cites and statistics results are computed, not judged, with one exception: a printed reference that no index lists is read once by a model before it counts as a citation error. Claims are extracted by a model and kept only when their quote appears verbatim in the text; each cited source is then checked, with a model’s help, for whether it says what the claim relies on. Those verdicts can be wrong — read the claim’s quote and the cited source before relying on one.
Statistics and arithmetic are recomputed, not judged.
Confidence bands are shown only for fields calibrated on our annotated test set. None is calibrated yet, so no band is shown.
What counts as a claim ›How we measure confidence ›How we check this ›
Are you an author, or do you see a problem with this page? Request a review
