

The DOI matches its Crossref record; 60 of the 61 references it cites were found in a registry or an index.
Mechanical vibration does not systematically reduce the tremor in essential tremor patients
Open accessPublished version of a preprint
Abstract
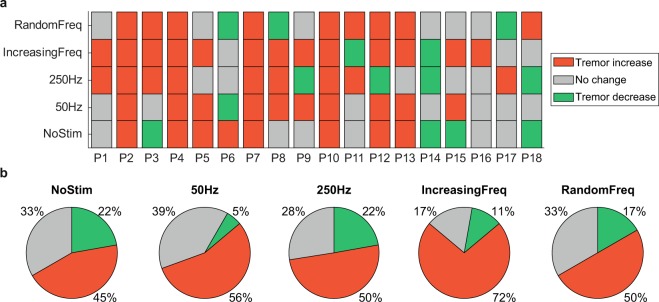
Essential tremor (ET) is a major cause of disability and is not effectively managed in half of the patients. We investigated whether mechanical vibration could reduce tremor in ET by selectively recruiting afferent pathways. We used piezoelectric actuators to deliver vibratory stimuli to the hand and forearm during long trials (4 min), while we monitored the tremor using inertial sensors. We analyzed the effect of four stimulation strategies, including different constant and variable vibration frequencies, in 18 ET patients. Although there was not a clear homogeneous response to vibration across patients and strategies, in most cases (50–72%) mechanical vibration was associated with an increase in the amplitude of their tremor. In contrast, the tremor was reduced in 5–22% of the patients, depending on the strategy. However, these results are hard to interpret given the intrinsic variability of the tremor: during equally long trials without vibration, the tremor changed significantly in 67% of the patients (increased in 45%; decreased in 22%). We conclude that mechanical vibration of the limb does not have a systematic effect on tremor in ET. Moreover, the observed intrinsic variability of the tremor should be taken into account when designing future experiments to assess tremor in ET and how it responds to any intervention.
Overview
The claims and statistics of this paper haven’t been checked yet.
Free: it reads the open-access text and checks the first 5 claims that cite a source we can check. Create a free account to check every claim.
Integrity signals
Registry
Cites
Statistics
Figures



Verification
Claims the paper makes
The claims and statistics of this paper haven’t been checked yet.
Free: it reads the open-access text and checks the first 5 claims that cite a source we can check. Create a free account to check every claim.
Claims other papers make about this one
Each is checked against this paper’s own text: does it say what the citing paper says it does?
The cited source says what the claim attributes to it.
In the citing paper
“Although the dominant trend in tremor response was to increase, the high variability observed in tremor severity, even without stimulation, made it difficult to interpret the results and, therefore, to reach conclusions.”
From A Review on Wearable Technologies for Tremor Suppression (2021) · cites this paper as [87]
Self-check
Percentages, sums and reported differences re-computed from the paper’s own numbers.
The self-check needs the paper’s full text.
Citations
Cites
Consensus Statement of the Movement Disorder Society on Tremor
Deuschl, G., Bain, P., & Brin, M. (2008) · Movement Disorders · doi:10.1002/mds.870131303 · Cited by 1,981
(2013) · Practical Psychology · doi:10.4324/9781315009810-7 · Cited by 1,066
Talbot, W. H., Darian-Smith, I., Kornhuber, H. H., & Mountcastle, V. B. (1968) · Journal of Neurophysiology · doi:10.1152/jn.1968.31.2.301 · Cited by 990
The responses of human muscle spindle endings to vibration of non‐contracting muscles.
Burke, D., Hagbarth, K. E., Löfstedt, L., & Wallin, B. G. (1976) · The Journal of Physiology · doi:10.1113/jphysiol.1976.sp011580 · Cited by 817
Proprioceptive Illusions Induced by Muscle Vibration: Contribution by Muscle Spindles to Perception?
Goodwin, G. M., McCloskey, D. I., & Matthews, P. B. C. (1972) · Science · doi:10.1126/science.175.4028.1382 · Cited by 674
Neuropathological changes in essential tremor: 33 cases compared with 21 controls
Louis, E. D., Faust, P. L., Vonsattel, J.-P. G., Honig, L. S., Rajput, A., Robinson, C. A., Rajput, A., Pahwa, R., Lyons, K. E., Ross, G. W., et al. (2007) · Brain · doi:10.1093/brain/awm266 · Cited by 562
Persistent inward currents in motoneuron dendrites: Implications for motor output
Heckman, C. J., Gorassini, M. A., & Bennett, D. J. (2005) · Muscle & Nerve · doi:10.1002/mus.20261 · Cited by 487
Treatment of patients with essential tremor
Deuschl, G., Raethjen, J., Hellriegel, H., & Elble, R. (2011) · The Lancet Neurology · doi:10.1016/s1474-4422(10)70322-7 · Cited by 428
Mountcastle, V. B., LaMotte, R. H., & Carli, G. (1972) · Journal of Neurophysiology · doi:10.1152/jn.1972.35.1.122 · Cited by 404
Design and Validation of a Rehabilitation Robotic Exoskeleton for Tremor Assessment and Suppression
Rocon, E., Belda-Lois, J. M., Ruiz, A. F., Manto, M., Moreno, J. C., & Pons, J. L. (2007) · IEEE Transactions on Neural Systems and Rehabilitation Engineering · doi:10.1109/tnsre.2007.903917 · Cited by 349
Research works printed but not linked: 1
- Prochazka, A., Elek, J. & Javidan, M. Attenuation of pathological tremors by functional electrical stimulation. I: Method. Ann. Biomed. Eng. 20, 205–224 (1992). · DOI · Paper page
Cited by
Peripheral electrical stimulation to reduce pathological tremor: a review
Pascual-Valdunciel, A., Hoo, G. W., Avrillon, S., Barroso, F. O., Goldman, J. G., Hernandez-Pavon, J. C., & Pons, J. L. (2021) · Journal of NeuroEngineering and Rehabilitation · doi:10.1186/s12984-021-00811-9 · Cited by 66
“It is worth mentioning that one study, out of the scope of this review, proposed mechanical vibration as an alternative method to acutely suppress tremor via stimulation of afferent fibers [64].”
MethodMedical Devices for Tremor Suppression: Current Status and Future Directions
Mo, J., & Priefer, R. (2021) · Biosensors · doi:10.3390/bios11040099 · Cited by 78
A Review on Wearable Technologies for Tremor Suppression
Lora-Millan, J. S., Delgado-Oleas, G., Benito-León, J., & Rocon, E. (2021) · Frontiers in Neurology · doi:10.3389/fneur.2021.700600 · Cited by 62
“26 Essential platform (87) Continuous mechanical afferent”
BackgroundMethodInfluentialSelf-citationOkelberry, T., Lyons, K. E., & Pahwa, R. (2024) · Parkinsonism & Related Disorders · doi:10.1016/j.parkreldis.2024.106086 · Cited by 46
4D printing of soft orthoses for tremor suppression
Mohammadi, M., Zolfagharian, A., Bodaghi, M., Xiang, Y., & Kouzani, A. Z. (2022) · Bio-Design and Manufacturing · doi:10.1007/s42242-022-00199-y · Cited by 42
Metadata
- Authors
- Lora-Millán, J. S., López-Blanco, R., Gallego, J. Á., Méndez-Guerrero, A., González de la Aleja, J., & Rocon, E.
- Affiliations
- Consejo Superior de Investigaciones Científicas (ES)
- Hospital Universitario 12 De Octubre (ES)
- Venue
- Scientific Reports
- Published
- 2019-11-11
- Volume
- 9
- Issue
- 1
- Pages
- 16476-16476
- ISSN
- 2045-2322 (ISSN-L)
- PMC
- PMC6848159
- OpenAlex
- W2986318758
- Cited by
- 20
- References
- 61
- Citations by year
- 2026: 2 · 2025: 3 · 2024: 3 · 2023: 3 · 2022: 4 · 2021: 4 · 2020: 1
- FWCI
- 1.52
- Type
- journal article
- Language
- en
- Open access
- gold
- doi.org
- Licence
- cc-by
- creativecommons.org/licenses/by/4.0 (tdm)
- creativecommons.org/licenses/by/4.0 (vor)
- Locations
- Scientific Reports (publishedVersion, cc-by)
- bioRxiv (Cold Spring Harbor Laboratory) (acceptedVersion, cc-by-nc-nd)
- Europe PMC (PubMed Central) (publishedVersion, cc-by)
- PubMed Central (publishedVersion, cc-by)
- PubMed (publishedVersion)
- DIGITAL.CSIC (Spanish National Research Council (CSIC)) (submittedVersion, cc-by)
- DOAJ (DOAJ: Directory of Open Access Journals) (submittedVersion)
- Funders
- Ministerio de Economía y Competitividad (RTC-2015-3967-1, DPI2015-72638-EXP, DPI2015-68664-C4-1-R)
- Topics
- Health Sciences › Medicine › Clinical Neurology › Deep Brain Stimulation and Movement Disorders
- Life Sciences › Neuroscience › Cognitive Neuroscience › Motor Control and Adaptation
- Health Sciences › Medicine › Orthopedics and Sports Medicine › Effects of Vibration on Health
- Keywords
- essential tremor, mechanical vibration, tremor suppression, piezoelectric actuators, vibration frequency, afferent pathways, inertial sensors
- MeSH terms
- Aged, Aged, 80 and over, Female, Humans, Male, Middle Aged, Muscle Contraction, Muscles, Spain, Tremor, Vibration, Essential Tremor
About these checks
Registry, retraction, Cites and statistics results are computed, not judged, with one exception: a printed reference that no index lists is read once by a model before it counts as a citation error. Claims are extracted by a model and kept only when their quote appears verbatim in the text; each cited source is then checked, with a model’s help, for whether it says what the claim relies on. Those verdicts can be wrong — read the claim’s quote and the cited source before relying on one.
Statistics and arithmetic are recomputed, not judged.
Confidence bands are shown only for fields calibrated on our annotated test set. None is calibrated yet, so no band is shown.
What counts as a claim ›How we measure confidence ›How we check this ›
Are you an author, or do you see a problem with this page? Request a review
How to cite
Cite CoChat for the checks on this page, and the paper for its own findings.
- This page
- CoChat. (2026). Citation check: Mechanical vibration does not systematically reduce the tremor in essential tremor patients. https://app.cochat.ai/papers/10.1038/s41598-019-52988-8
- The paper
- Lora-Millán, J. S., López-Blanco, R., Gallego, J. Á., Méndez-Guerrero, A., González de la Aleja, J., & Rocon, E. (2019). Mechanical vibration does not systematically reduce the tremor in essential tremor patients. Scientific Reports. https://doi.org/10.1038/s41598-019-52988-8
Data sources
Bibliographic data: Semantic Scholar, OpenAlex, Crossref.
Contains information from the Semantic Scholar Academic Graph Datasets, made available under the ODC Attribution License (ODC-BY 1.0).
Semantic Scholar’s data is described in: Kinney, R., et al. (2023). The Semantic Scholar Open Data Platform. arXiv:2301.10140.
