Cited by 168Neuroinflammation and Neurodegeneration MechanismsNeurogenesis and neuroplasticity mechanismsNeuroscience and Neuropharmacology Research

The DOI matches its Crossref record; 66 of the 66 references it cites were found in a registry or an index.

Co-stimulation with IL-1β and TNF-α induces an inflammatory reactive astrocyte phenotype with neurosupportive characteristics in a human pluripotent stem cell model system

Open access

Abstract

Astrocyte reactivation has been discovered to be an important contributor to several neurological diseases. In vitro models involving human astrocytes have the potential to reveal disease-specific mechanisms of these cells and to advance research on neuropathological conditions. Here, we induced a reactive phenotype in human induced pluripotent stem cell (hiPSC)-derived astrocytes and studied the inflammatory natures and effects of these cells on human neurons. Astrocytes responded to interleukin-1β (IL-1β) and tumor necrosis factor-α (TNF-α) treatment with a typical transition to polygonal morphology and a shift to an inflammatory phenotype characterized by altered gene and protein expression profiles. Astrocyte-secreted factors did not exert neurotoxic effects, whereas they transiently promoted the functional activity of neurons. Importantly, we engineered a novel microfluidic platform designed for investigating interactions between neuronal axons and reactive astrocytes that also enables the implementation of a controlled inflammatory environment. In this platform, selective stimulation of astrocytes resulted in an inflammatory niche that sustained axonal growth, further suggesting that treatment induces a reactive astrocyte phenotype with neurosupportive characteristics. Our findings show that hiPSC-derived astrocytes are suitable for modeling astrogliosis, and the developed in vitro platform provides promising novel tools for studying neuron-astrocyte crosstalk and human brain disease in a dish.

Overview

The claims and statistics of this paper haven’t been checked yet.

Run the check — free, no account needed. It reads the open-access text and checks the sources it cites.

A few free checks a day · papers already verified open instantly · results are public

Integrity signals

Registry

Crossref · 10.1038/s41598-019-53414-9

Cites

66 of 66 references verified0 citation errors · 0 not checkable

Statistics

Figures

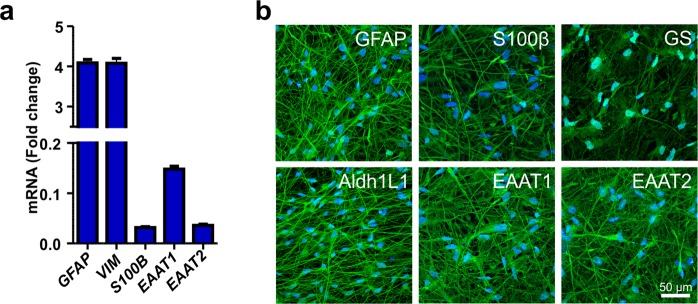
Figure 1 Characterization of hiPSC-derived astrocytes. (a) The hiPSC-derived astrocytes expressed several astrocyte-specific genes, including GFAP, VIM, S100B, EAAT1 and EAAT2. The data are presented as the mean ± s.e.m. (n = 2 with three technical replicates; the data are representative of two experiments). (b) Immunocytochemical staining was used to confirm the expression of the major astrocyte markers GFAP, S100β, GS, Aldh1L1, EAAT1 and EAAT2.
Figure 1 Characterization of hiPSC-derived astrocytes. (a) The hiPSC-derived astrocytes expressed several astrocyte-specific genes, including GFAP, VIM, S100B, EAAT1 and EAAT2. The data are presented as the mean ± s.e.m. (n = 2 with three technical replicates; the data are representative of two experiments). (b) Immunocytochemical staining was used to confirm the expression of the major astrocyte markers GFAP, S100β, GS, Aldh1L1, EAAT1 and EAAT2.CC BY · PubMed Central
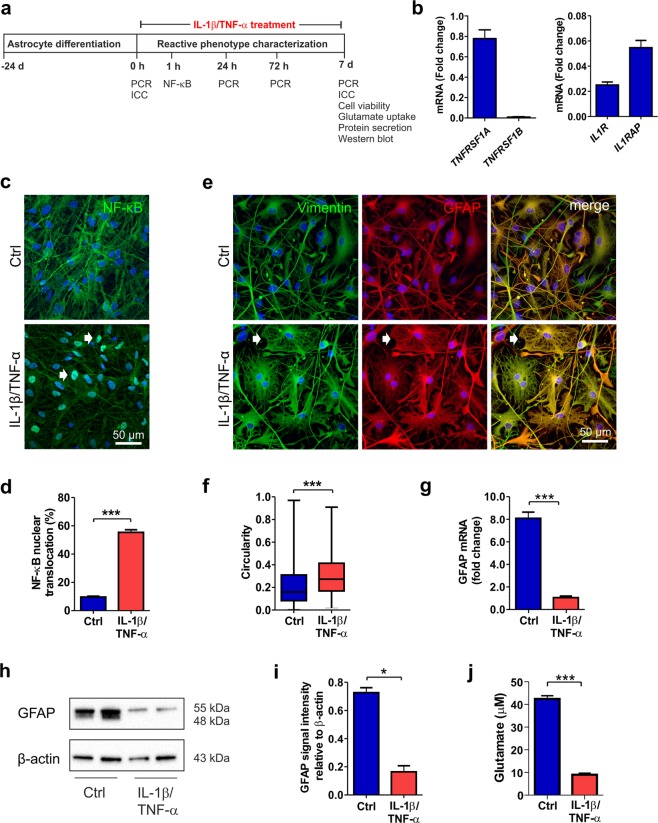
Figure 2 IL-1β and TNF-α treatment induces a reactive astrocyte phenotype. (a) Experimental setup for astrocyte stimulation with IL-1β and TNF-α and astrocyte characterization. (b) Gene expression analysis revealed the presence of TNFRSF1A, IL1R, and IL1RAP transcripts in the astrocytes (n = 2 with three technical replicates; the data are representative of two experiments). (c) In control astrocytes, NF-κB was ubiquitously expressed in the cytoplasm, whereas after 60 minutes cytokine stimulation, it was activated and translocated to the nucleus (white arrows). (d) NF-κB activation was quantified as the percentage of nuclei with translocation among the total nuclei (n = 6 cultures; the data were analyzed from two experiments). (e) Immunocytochemical staining of the intermediate filament proteins vimentin and GFAP showed morphological changes from filamentous to flattened shapes (white arrows) in response to cytokine stimulation. (f) Morphological change was quantified based on the vimentin staining of samples on day 7. The circularity of the cells in each group is presented as the median and interquartile range, with the whiskers showing the minimum and maximum values. Images were analyzed from six cultures derived from three experiments. (g) GFAP expression levels decreased following cytokine stimulation (n = 2 with three technical replicates; the data are representative of two experiments). (h) GFAP was analyzed at the protein level by western blot analysis, representative cropped images of the membranes for the GFAP and β-Actin are shown here and full length of membranes are presented in the Supplementary Fig. S4. (i) Quantification of GFAP and β-Actin showed a reduction after cytokine treatment. β-Actin was used as a loading control (n = 2; the data are representative of three experiments). (j) Cytokine treatment impaired the glutamate uptake capacity of astrocytes (n = 3; the data are representative of two experiments). The data are presented as the mean ± s.e.m. Statistical analysis was performed with independent-sample t-tests except in (f), in which statistical analysis was performed with the Mann-Whitney U test. Statistical significance: * p < 0.05, ** p < 0.01, and *** p < 0.001.
Figure 2 IL-1β and TNF-α treatment induces a reactive astrocyte phenotype. (a) Experimental setup for astrocyte stimulation with IL-1β and TNF-α and astrocyte characterization. (b) Gene expression analysis revealed the presence of TNFRSF1A, IL1R, and IL1RAP transcripts in the astrocytes (n = 2 with three technical replicates; the data are representative of two experiments). (c) In control astrocytes, NF-κB was ubiquitously expressed in the cytoplasm, whereas after 60 minutes cytokine stimulation, it was activated and translocated to the nucleus (white arrows). (d) NF-κB activation was quantified as the percentage of nuclei with translocation among the total nuclei (n = 6 cultures; the data were analyzed from two experiments). (e) Immunocytochemical staining of the intermediate filament proteins vimentin and GFAP showed morphological changes from filamentous to flattened shapes (white arrows) in response to cytokine stimulation. (f) Morphological change was quantified based on the vimentin staining of samples on day 7. The circularity of the cells in each group is presented as the median and interquartile range, with the whiskers showing the minimum and maximum values. Images were analyzed from six cultures derived from three experiments. (g) GFAP expression levels decreased following cytokine stimulation (n = 2 with three technical replicates; the data are representative of two experiments). (h) GFAP was analyzed at the protein level by western blot analysis, representative cropped images of the membranes for the GFAP and β-Actin are shown here and full length of membranes are presented in the Supplementary Fig. S4. (i) Quantification of GFAP and β-Actin showed a reduction after cytokine treatment. β-Actin was used as a loading control (n = 2; the data are representative of three experiments). (j) Cytokine treatment impaired the glutamate uptake capacity of astrocytes (n = 3; the data are representative of two experiments). The data are presented as the mean ± s.e.m. Statistical analysis was performed with independent-sample t-tests except in (f), in which statistical analysis was performed with the Mann-Whitney U test. Statistical significance: * p < 0.05, ** p < 0.01, and *** p < 0.001.CC BY · PubMed Central
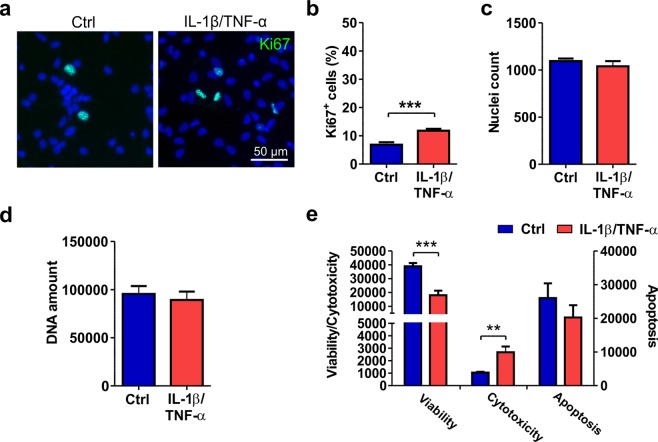
Figure 3 Viability and proliferation of cytokine-treated astrocytes. (a) Immunocytochemical staining of proliferating Ki67-positive cells in control and IL-1β/TNF-α-treated cultures. (b) The number of proliferating cells was increased after cytokine treatment. (c) The nuclei count quantified from DAPI staining remained similar between the control and treated groups. For Ki67 staining and nuclei counts, images were analyzed from 11 cultures derived from four experiments. (d) Additionally, the amount of DNA was similar between the groups (n = 6 with two technical replicates; the data are from two experiments). (e) The viability assay showed decreased viability and increased cytotoxicity but no significant difference in apoptosis following cytokine treatment (n = 3; the data are representative from two experiments). The quantification data are presented as the mean ± s.e.m. All statistical analysis was performed using independent-sample t-tests. The significant p-values are presented in the graphs. Statistical significance: * p < 0.05, ** p < 0.01, and *** p < 0.001.
Figure 3 Viability and proliferation of cytokine-treated astrocytes. (a) Immunocytochemical staining of proliferating Ki67-positive cells in control and IL-1β/TNF-α-treated cultures. (b) The number of proliferating cells was increased after cytokine treatment. (c) The nuclei count quantified from DAPI staining remained similar between the control and treated groups. For Ki67 staining and nuclei counts, images were analyzed from 11 cultures derived from four experiments. (d) Additionally, the amount of DNA was similar between the groups (n = 6 with two technical replicates; the data are from two experiments). (e) The viability assay showed decreased viability and increased cytotoxicity but no significant difference in apoptosis following cytokine treatment (n = 3; the data are representative from two experiments). The quantification data are presented as the mean ± s.e.m. All statistical analysis was performed using independent-sample t-tests. The significant p-values are presented in the graphs. Statistical significance: * p < 0.05, ** p < 0.01, and *** p < 0.001.CC BY · PubMed Central
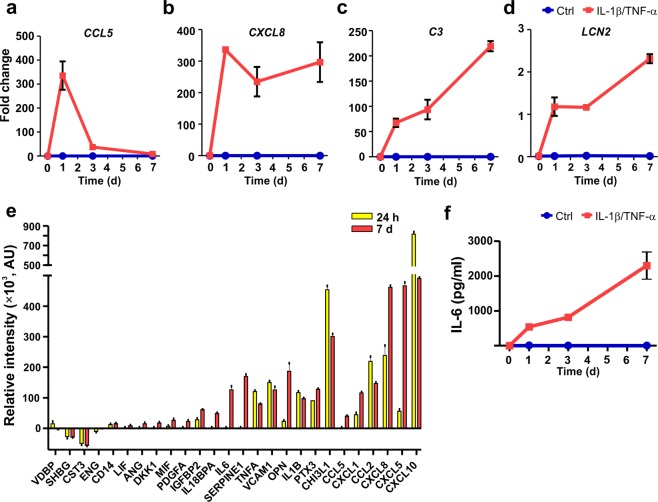
Figure 4 Cytokine treatment results in the inflammatory activation of astrocytes. (a–d) The gene expression levels of (a) CCL5, (b) CXCL8, (c) C3, and (d) LCN2 were analyzed in cytokine-treated and control astrocytes at the 0-, 1-, 3- and 7-day time points. Robust increases in the expression of all studied genes were detected after cytokine treatment (n = 2 with three technical replicates; the data are representative of two experiments). (e) Secretion of inflammatory factors into the medium was analyzed at the 24 h and 7-day time points. The relative intensity values for the different analytes were calculated by subtracting the intensity values of the control samples from those of the cytokine-treated samples at each time point (n = 1 with two technical replicates; the data are representative of two experiments). (f) The levels of IL-6 were analyzed at 0, 1, 3 and 7 day in cytokine-treated and control astrocytes. IL-6 levels increased in a time-dependent manner over 7 days in the cytokine-treated samples, while under control conditions, the levels were undetectable (n = 2 with two technical replicates; the data are representative of two experiments). The quantification data are presented as the mean ± s.e.m.
Figure 4 Cytokine treatment results in the inflammatory activation of astrocytes. (a–d) The gene expression levels of (a) CCL5, (b) CXCL8, (c) C3, and (d) LCN2 were analyzed in cytokine-treated and control astrocytes at the 0-, 1-, 3- and 7-day time points. Robust increases in the expression of all studied genes were detected after cytokine treatment (n = 2 with three technical replicates; the data are representative of two experiments). (e) Secretion of inflammatory factors into the medium was analyzed at the 24 h and 7-day time points. The relative intensity values for the different analytes were calculated by subtracting the intensity values of the control samples from those of the cytokine-treated samples at each time point (n = 1 with two technical replicates; the data are representative of two experiments). (f) The levels of IL-6 were analyzed at 0, 1, 3 and 7 day in cytokine-treated and control astrocytes. IL-6 levels increased in a time-dependent manner over 7 days in the cytokine-treated samples, while under control conditions, the levels were undetectable (n = 2 with two technical replicates; the data are representative of two experiments). The quantification data are presented as the mean ± s.e.m.CC BY · PubMed Central
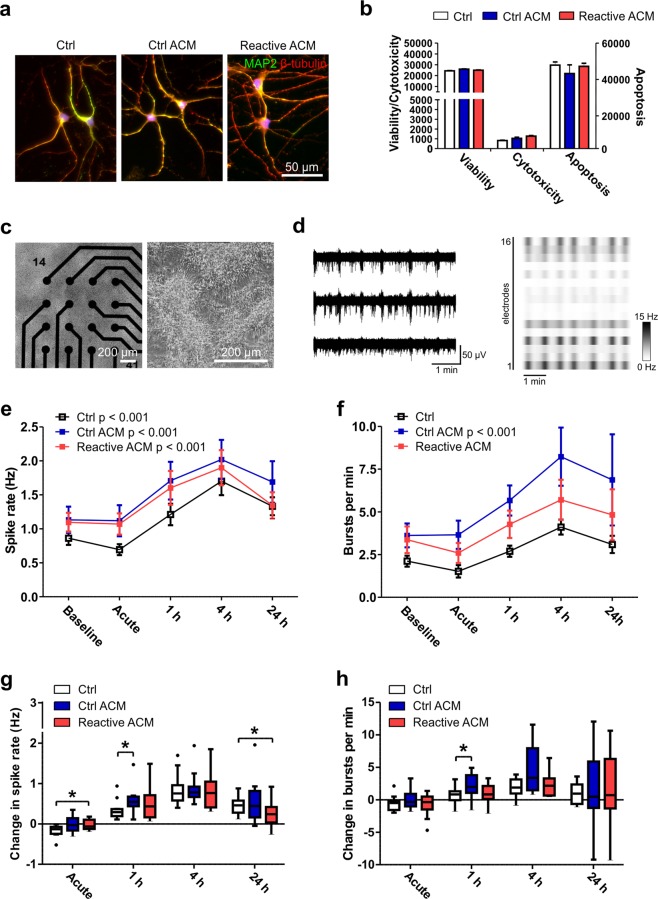
Figure 5 Viability and functionality of neuronal cells after exposure to reactive astrocyte conditioned medium. (a) Immunocytochemical staining of hPSC-derived neuronal cells exposed to control medium (Ctrl), control ACM (Ctrl ACM) and reactive ACM. Neuronal cells stained positive for MAP2 (green) and β-tubulin (red). DAPI nuclear staining is shown in blue. (b) The reactive astrocyte conditioned medium did not show an effect on the viability, cytotoxicity or apoptosis of neuronal cells after 48 h of exposure (the data are representative of two experiments; in each experiment n = 3–6 per group). Statistical analysis was performed using independent-sample t-tests. (c) The effect of ACM on neuronal functionality was studied with microelectrode array (MEA) measurements. The phase-contrast images show neuronal cells cultured on MEAs. (d) Typical spontaneous activity in neuronal networks recorded from three electrodes over 5 minutes. The raster blot shows the typical network-wide activity from all 16 electrodes of one well over 5 minutes. (e) Spike rate (Hz) development for active electrodes before (baseline) and after different medium exposures (acute, 1 h, 4 h and 24 h). (f) Number of bursts per minute before and after different medium exposures. For the MEA data, n = 12 networks derived from one differentiation. The data are presented as the mean ± s.e.m., and statistical analysis was performed using the Friedman test. (g-h) To highlight significant differences between treatment groups, the data from panels e-f were reused and are presented as the changes in spike and burst rates compared to the baseline measurements. The data are shown as Tukey boxplots. Statistical significances was determined with the Mann-Whitney U test; * p < 0.05, ** p < 0.01, and *** p < 0.001.
Figure 5 Viability and functionality of neuronal cells after exposure to reactive astrocyte conditioned medium. (a) Immunocytochemical staining of hPSC-derived neuronal cells exposed to control medium (Ctrl), control ACM (Ctrl ACM) and reactive ACM. Neuronal cells stained positive for MAP2 (green) and β-tubulin (red). DAPI nuclear staining is shown in blue. (b) The reactive astrocyte conditioned medium did not show an effect on the viability, cytotoxicity or apoptosis of neuronal cells after 48 h of exposure (the data are representative of two experiments; in each experiment n = 3–6 per group). Statistical analysis was performed using independent-sample t-tests. (c) The effect of ACM on neuronal functionality was studied with microelectrode array (MEA) measurements. The phase-contrast images show neuronal cells cultured on MEAs. (d) Typical spontaneous activity in neuronal networks recorded from three electrodes over 5 minutes. The raster blot shows the typical network-wide activity from all 16 electrodes of one well over 5 minutes. (e) Spike rate (Hz) development for active electrodes before (baseline) and after different medium exposures (acute, 1 h, 4 h and 24 h). (f) Number of bursts per minute before and after different medium exposures. For the MEA data, n = 12 networks derived from one differentiation. The data are presented as the mean ± s.e.m., and statistical analysis was performed using the Friedman test. (g-h) To highlight significant differences between treatment groups, the data from panels e-f were reused and are presented as the changes in spike and burst rates compared to the baseline measurements. The data are shown as Tukey boxplots. Statistical significances was determined with the Mann-Whitney U test; * p < 0.05, ** p < 0.01, and *** p < 0.001.CC BY · PubMed Central
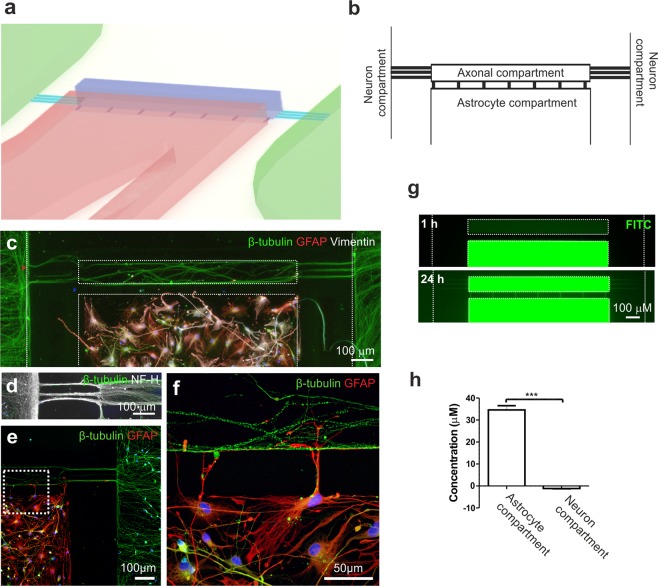
Figure 6 Description of the microfluidic device for co-culture of neurons and astrocytes and the fluidic isolation of the cell compartments. (a) Schematic showing a 3D illustration of the microfluidic device. (b) The microfluidic device consisted of two opposing compartments for neurons and a separate compartment for astrocytes, all of which were connected to an axonal compartment via microtunnels. (c) Immunocytochemical staining showing successful co-culture of β-tubulin-positive neurons and GFAP- and vimentin-positive astrocytes in the device and (d) the presence of NF-H-positive axons growing into the axonal compartment. (e) GFAP-positive astrocytes were placed close to the microtunnels leading to the axonal compartment, and (f) enlargement of the image illustrates cell-to-cell interactions between astrocytic processes and axons. (g) To evaluate the fluidic isolation of the astrocyte compartment, dextran-conjugated FITC was added to the astrocyte compartment, and its diffusion was evaluated by imaging with fluorescence microscopy at 1 h and 24 h. Fluorescence was detected in the axonal compartment after 24 h but was absent in the neuronal compartment (the compartments are shown with white dotted lines). (h) The concentration of dextran-FITC was measured after 24 h from medium collected from the astrocyte and neuron compartments. The data are shown as the mean ± s.e.m. (n = 6; the data are from one experiment). Statistical analysis was performed with independent-sample t-tests, and statistical significance is denoted as * p < 0.05, ** p < 0.01, and *** p < 0.001.
Figure 6 Description of the microfluidic device for co-culture of neurons and astrocytes and the fluidic isolation of the cell compartments. (a) Schematic showing a 3D illustration of the microfluidic device. (b) The microfluidic device consisted of two opposing compartments for neurons and a separate compartment for astrocytes, all of which were connected to an axonal compartment via microtunnels. (c) Immunocytochemical staining showing successful co-culture of β-tubulin-positive neurons and GFAP- and vimentin-positive astrocytes in the device and (d) the presence of NF-H-positive axons growing into the axonal compartment. (e) GFAP-positive astrocytes were placed close to the microtunnels leading to the axonal compartment, and (f) enlargement of the image illustrates cell-to-cell interactions between astrocytic processes and axons. (g) To evaluate the fluidic isolation of the astrocyte compartment, dextran-conjugated FITC was added to the astrocyte compartment, and its diffusion was evaluated by imaging with fluorescence microscopy at 1 h and 24 h. Fluorescence was detected in the axonal compartment after 24 h but was absent in the neuronal compartment (the compartments are shown with white dotted lines). (h) The concentration of dextran-FITC was measured after 24 h from medium collected from the astrocyte and neuron compartments. The data are shown as the mean ± s.e.m. (n = 6; the data are from one experiment). Statistical analysis was performed with independent-sample t-tests, and statistical significance is denoted as * p < 0.05, ** p < 0.01, and *** p < 0.001.CC BY · PubMed Central
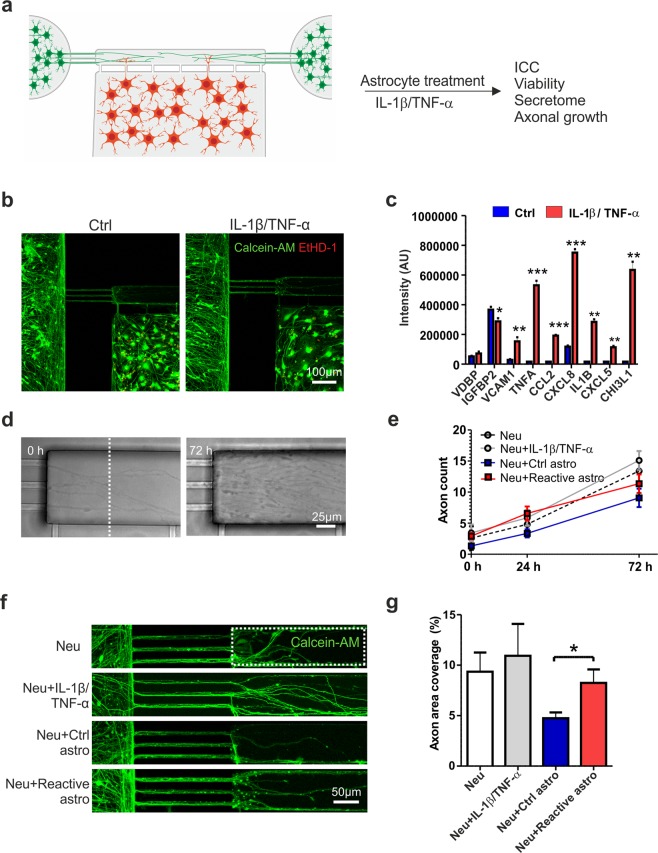
Figure 7 In vitro model for astrogliosis and axonal growth. (a) Experimental design for co-culture of astrocytes and neurons in the microfluidic device and astrocyte activation with IL-1β and TNF-α. (b) Both cell types remained viable (based on calcein-AM staining) on the platform after cytokine treatment, and very few dead cells (revealed by EtHD-1 staining) were observed. (c) Cytokine-treated astrocytes secreted significantly higher levels of several inflammatory factors than controls (n = 2; the data are from one experiment). (d) Phase-contrast images showing axons extending into the axonal compartment at 0 h and 72 h after cytokine treatment. (e) The number of axons extending into the axonal compartment (crossing the distance marked with the white dotted line) was quantified over 72 h. In addition to devices with co-cultures of control or reactive astrocytes and neurons (the Neu + Ctrl astro and Neu + Reactive astro groups), devices with cultures of only neurons were established to determine the effects of IL-1β and TNF-α treatment on axons (the Neu and Neu + IL-1β/TNF-α group) (n = 4–8 for each group; the data are from two experiments). (f) Axonal growth was also visualized with live-cell calcein-AM color staining to estimate coverage in the axonal compartment (the white dotted line). (g) Quantification of the area coverage in the axonal compartment revealed that reactive astrocytes supported axonal growth compared to control astrocytes (n = 6–13 for each group; the data are from one independent experiment). All data are presented as the mean ± s.e.m. Statistical analysis between groups was performed with independent-sample t-tests. P-values less than 0.05 were considered to indicate significance, and significant differences compared to the control group are presented in the graphs as * p < 0.05, ** p < 0.01, and *** p < 0.001.
Figure 7 In vitro model for astrogliosis and axonal growth. (a) Experimental design for co-culture of astrocytes and neurons in the microfluidic device and astrocyte activation with IL-1β and TNF-α. (b) Both cell types remained viable (based on calcein-AM staining) on the platform after cytokine treatment, and very few dead cells (revealed by EtHD-1 staining) were observed. (c) Cytokine-treated astrocytes secreted significantly higher levels of several inflammatory factors than controls (n = 2; the data are from one experiment). (d) Phase-contrast images showing axons extending into the axonal compartment at 0 h and 72 h after cytokine treatment. (e) The number of axons extending into the axonal compartment (crossing the distance marked with the white dotted line) was quantified over 72 h. In addition to devices with co-cultures of control or reactive astrocytes and neurons (the Neu + Ctrl astro and Neu + Reactive astro groups), devices with cultures of only neurons were established to determine the effects of IL-1β and TNF-α treatment on axons (the Neu and Neu + IL-1β/TNF-α group) (n = 4–8 for each group; the data are from two experiments). (f) Axonal growth was also visualized with live-cell calcein-AM color staining to estimate coverage in the axonal compartment (the white dotted line). (g) Quantification of the area coverage in the axonal compartment revealed that reactive astrocytes supported axonal growth compared to control astrocytes (n = 6–13 for each group; the data are from one independent experiment). All data are presented as the mean ± s.e.m. Statistical analysis between groups was performed with independent-sample t-tests. P-values less than 0.05 were considered to indicate significance, and significant differences compared to the control group are presented in the graphs as * p < 0.05, ** p < 0.01, and *** p < 0.001.CC BY · PubMed Central

Verification

Claims the paper makes

The claims and statistics of this paper haven’t been checked yet.

Run the check — free, no account needed. It reads the open-access text and checks the sources it cites.

A few free checks a day · papers already verified open instantly · results are public

Claims other papers make about this one

Each is checked against this paper’s own text: does it say what the citing paper says it does?

Self-check

Percentages, sums and reported differences re-computed from the paper’s own numbers.

The self-check needs the paper’s full text.

Citations

Cites

Show all 66 references

Cited by

Sorted by citations

See all 168

Metadata

Authors
Hyvärinen, T., Hagman, S., Ristola, M., Sukki, L., Veijula, K., Kreutzer, J., Kallio, P., & Narkilahti, S.
Affiliations
Tampere University (FI)
Corresponding author
Narkilahti, Susanna
Venue
Scientific Reports
Published
2019-11-15
Volume
9
Issue
1
Pages
16944-16944
ISSN
2045-2322 (ISSN-L)
OpenAlex
W2987198483
Cited by
168
References
66
Citations by year
2026: 18 · 2025: 23 · 2024: 39 · 2023: 16 · 2022: 26 · 2021: 31 · 2020: 14
FWCI
7.81
Type
journal article
Language
en
Open access
Locations
  • Scientific Reports (publishedVersion, cc-by)
  • Europe PMC (PubMed Central) (publishedVersion, cc-by)
  • PubMed Central (publishedVersion, cc-by)
  • PubMed (publishedVersion)
  • DOAJ (DOAJ: Directory of Open Access Journals) (submittedVersion)
  • Tampere University Institutional Repository (Tampere University) (submittedVersion, cc-by)
Funders
  • Academy of Finland (312411, 312414, 50191927, 296415)
  • Suomen Kulttuurirahasto (00170805, 312414, 50191927, 312411)
  • Business Finland (50191927, 312414)
Topics
  • Life Sciences › Neuroscience › Neurology › Neuroinflammation and Neurodegeneration Mechanisms
  • Life Sciences › Neuroscience › Developmental Neuroscience › Neurogenesis and neuroplasticity mechanisms
  • Life Sciences › Neuroscience › Cellular and Molecular Neuroscience › Neuroscience and Neuropharmacology Research
Keywords
reactive astrocytes, astrocyte activation, IL-1β, TNF-α, neuroinflammation, microfluidic platform, axon growth
MeSH terms
Astrocytes, Cell Communication, Cell Differentiation, Cell Survival, Cells, Cultured, Humans, Neurons, Phenotype, Tumor Necrosis Factor-alpha, Cytokines, Coculture Techniques, Pluripotent Stem Cells, Microfluidic Analytical Techniques, Cell Proliferation, Interleukin-1beta, Induced Pluripotent Stem Cells, Cellular Microenvironment

About these checks

Registry, retraction, Cites and statistics results are computed, not judged, with one exception: a printed reference that no index lists is read once by a model before it counts as a citation error. Claims are extracted by a model and kept only when their quote appears verbatim in the text; each cited source is then checked, with a model’s help, for whether it says what the claim relies on. Those verdicts can be wrong — read the claim’s quote and the cited source before relying on one.

Statistics and arithmetic are recomputed, not judged.

Confidence bands are shown only for fields calibrated on our annotated test set. None is calibrated yet, so no band is shown.

What counts as a claim ›How we measure confidence ›How we check this ›

Are you an author, or do you see a problem with this page? Request a review