Student or educator? Sign up with your school email and get 6 months of Pro free.
CoChat

The DOI matches its Crossref record; 90 of the 90 references it cites were found in a registry or an index.

Emotion Perception in Hadza Hunter-Gatherers

Open access

Abstract

It has long been claimed that certain configurations of facial movements are universally recognized as emotional expressions because they evolved to signal emotional information in situations that posed fitness challenges for our hunting and gathering hominin ancestors. Experiments from the last decade have called this particular evolutionary hypothesis into doubt by studying emotion perception in a wider sample of small-scale societies with discovery-based research methods. We replicate these newer findings in the Hadza of Northern Tanzania; the Hadza are semi-nomadic hunters and gatherers who live in tight-knit social units and collect wild foods for a large portion of their diet, making them a particularly relevant population for testing evolutionary hypotheses about emotion. Across two studies, we found little evidence of universal emotion perception. Rather, our findings are consistent with the hypothesis that people infer emotional meaning in facial movements using emotion knowledge embrained by cultural learning.

Overview

The claims and statistics of this paper haven’t been checked yet.

Free: it reads the open-access text and checks the first 5 claims that cite a source we can check. Create a free account to check every claim.

A few free checks a day · papers already verified open instantly · results are public

Integrity signals

Registry

Crossref · 10.1038/s41598-020-60257-2

Cites

90 of 90 references verified0 citation errors · 0 not checkable

Statistics

Figures

Figure 1 Tests of the Universality Hypothesis for Facial Configurations and Vocal Cues in Small-Scale Societies. Findings summarized for anger, disgust, fear, sadness, and surprise; happiness is the only pleasant category tested in all studies except Tracy and Robins (2008), and therefore perception can be (and likely is) guided by distinguishing valence in those studies. All studies used photographs of posed facial configurations or posed vocalizations, except Crivelli, Jarillo et al. (2016), Study 2, and Crivelli et al. (2017), Study 1, which used dynamic as well as static posed configurations and static spontaneous configurations from Papua New Guinea (PNG), respectively. In Bryant and HC Barrett (2008), participants were tested in a second language (Spanish) in which they received training. A subset of choice-from-array studies did not control whether foils and target facial configurations could be distinguished by valence and/or arousal, with the exception of Gendron et al. 2014a, Study 2, which controlled for valence and arousal; Sauter et al. 2015 (2010 re-analysis) and Cordaro et al. (2015) controlled for valence only. N = sample size. Unsupported = consistency and specificity at chance, or any level of consistency above chance combined with evidence of no specificity. Weak support = consistency between 20% and 40% (weak) for at least a single emotion category (other than happiness) combined with above-chance specificity for that category, or consistency between 41% and 70% (moderate) for at least a single category (other than happiness) with unknown specificity. Moderate support = consistency between 41% and 70% (moderate) combined with any evidence of above-chance specificity those categories, or consistency above 70% (strong) for at least a single category (other than happiness) with unknown specificity. Strong support = strong evidence of consistency (above 70%) and strong evidence of specificity for at least a single emotion category (other than happiness). Superscript a: Specificity levels were not reported. Superscript a1: Specificity inferred from reported results. Superscript a2: Traditional specificity and consistency tests are inappropriate for this method, but the results are placed here based on the original author’s interpretation of multidimensional scaling and clustering results. Superscript b: The sample size, marginal means, and exact pattern of errors reported for the Sadong samples is identical in Sorenson (1975), Sample 3 and Ekman et al. (1969); Sorenson described using a free-labeling method and Ekman et al. (1969) described using a choice-from-array method in which participants were shown photographs and asked to choose a label from a small list of emotion words; Ekman (1994) indicated, however, that he did not use a free-labeling method, implying that the samples are distinct. Superscript c: Sorenson (1975), Sample 2 included three groups of Fore participants (those with little, moderate, and most other-group contact). The pattern of findings is nearly identical for the subgroup with the most contact and the data reported for the Fore in Ekman et al. (1969); again, Sorenson described using a free-labeling method and Ekman et al. (1969) described using a choice-from-array method. It is questionable whether the Sadong and the Fore subgroup should be considered a small-scale society (see Sorenson, 1975, p. 362 and 363), but we include them here to avoid falsely dichotomizing cultures as “isolated from” versus “exposed to” one another (Fridlund, 1994; Gewald, 2010). Superscript d: These are likely the same sample because the sample sizes and pattern of data are identical for all emotion categories except for the fear category, which is extremely similar, and for the disgust category, which includes responses for contempt in Ekman and Friesen (1971) but was kept separate in Sorenson (1975). Superscript e: Participants were children. Superscript f: Participants were adolescents. Superscript g: The Dani sample reported in Ekman (1972) is likely a subset of the data from Ekman, Heider, Friesen, and Heider (unpublished manuscript).
Figure 1 Tests of the Universality Hypothesis for Facial Configurations and Vocal Cues in Small-Scale Societies. Findings summarized for anger, disgust, fear, sadness, and surprise; happiness is the only pleasant category tested in all studies except Tracy and Robins (2008), and therefore perception can be (and likely is) guided by distinguishing valence in those studies. All studies used photographs of posed facial configurations or posed vocalizations, except Crivelli, Jarillo et al. (2016), Study 2, and Crivelli et al. (2017), Study 1, which used dynamic as well as static posed configurations and static spontaneous configurations from Papua New Guinea (PNG), respectively. In Bryant and HC Barrett (2008), participants were tested in a second language (Spanish) in which they received training. A subset of choice-from-array studies did not control whether foils and target facial configurations could be distinguished by valence and/or arousal, with the exception of Gendron et al. 2014a, Study 2, which controlled for valence and arousal; Sauter et al. 2015 (2010 re-analysis) and Cordaro et al. (2015) controlled for valence only. N = sample size. Unsupported = consistency and specificity at chance, or any level of consistency above chance combined with evidence of no specificity. Weak support = consistency between 20% and 40% (weak) for at least a single emotion category (other than happiness) combined with above-chance specificity for that category, or consistency between 41% and 70% (moderate) for at least a single category (other than happiness) with unknown specificity. Moderate support = consistency between 41% and 70% (moderate) combined with any evidence of above-chance specificity those categories, or consistency above 70% (strong) for at least a single category (other than happiness) with unknown specificity. Strong support = strong evidence of consistency (above 70%) and strong evidence of specificity for at least a single emotion category (other than happiness). Superscript a: Specificity levels were not reported. Superscript a1: Specificity inferred from reported results. Superscript a2: Traditional specificity and consistency tests are inappropriate for this method, but the results are placed here based on the original author’s interpretation of multidimensional scaling and clustering results. Superscript b: The sample size, marginal means, and exact pattern of errors reported for the Sadong samples is identical in Sorenson (1975), Sample 3 and Ekman et al. (1969); Sorenson described using a free-labeling method and Ekman et al. (1969) described using a choice-from-array method in which participants were shown photographs and asked to choose a label from a small list of emotion words; Ekman (1994) indicated, however, that he did not use a free-labeling method, implying that the samples are distinct. Superscript c: Sorenson (1975), Sample 2 included three groups of Fore participants (those with little, moderate, and most other-group contact). The pattern of findings is nearly identical for the subgroup with the most contact and the data reported for the Fore in Ekman et al. (1969); again, Sorenson described using a free-labeling method and Ekman et al. (1969) described using a choice-from-array method. It is questionable whether the Sadong and the Fore subgroup should be considered a small-scale society (see Sorenson, 1975, p. 362 and 363), but we include them here to avoid falsely dichotomizing cultures as “isolated from” versus “exposed to” one another (Fridlund, 1994; Gewald, 2010). Superscript d: These are likely the same sample because the sample sizes and pattern of data are identical for all emotion categories except for the fear category, which is extremely similar, and for the disgust category, which includes responses for contempt in Ekman and Friesen (1971) but was kept separate in Sorenson (1975). Superscript e: Participants were children. Superscript f: Participants were adolescents. Superscript g: The Dani sample reported in Ekman (1972) is likely a subset of the data from Ekman, Heider, Friesen, and Heider (unpublished manuscript).CC BY · PubMed Central
Figure 2 Coded responses from Study 1. Top panel depicts verbal responses produced by Hadza (left) and US (right) samples that were coded as “mental states”. The proportion of labels produced by a given sample are plotted, with higher intensity (yellow) values indicating a higher proportion and lower intensity (blue) values indicating a lower proportion; numerical proportion is also presented in each cell. Responses are plotted by the coded label types produced (y-axis) for each facial configuration of interest (x-axis). Other mental = other mental labels offered that did not conform to otherwise coded categories. Lower panel depicts verbal responses produced by Hadza (left) and US (right) samples that were coded as consistent with a set of “functional” descriptions derived from the prior literature. Functional descriptions are clustered according to their theoretically proposed links to specific emotions. Other action = other action labels offered that did not conform to otherwise coded categories.
Figure 2 Coded responses from Study 1. Top panel depicts verbal responses produced by Hadza (left) and US (right) samples that were coded as “mental states”. The proportion of labels produced by a given sample are plotted, with higher intensity (yellow) values indicating a higher proportion and lower intensity (blue) values indicating a lower proportion; numerical proportion is also presented in each cell. Responses are plotted by the coded label types produced (y-axis) for each facial configuration of interest (x-axis). Other mental = other mental labels offered that did not conform to otherwise coded categories. Lower panel depicts verbal responses produced by Hadza (left) and US (right) samples that were coded as consistent with a set of “functional” descriptions derived from the prior literature. Functional descriptions are clustered according to their theoretically proposed links to specific emotions. Other action = other action labels offered that did not conform to otherwise coded categories.CC BY · PubMed Central
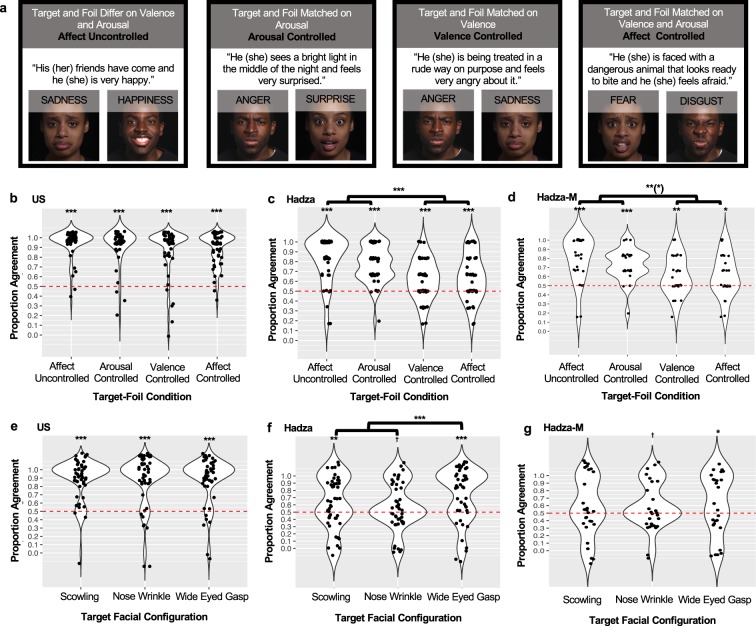
Figure 3 Study 2 Task Conditions (a) and Performance for US (b,e), Hadza (c,f) and Hadza participants with minimized exposure to other cultural groups (Hadza-M; subset based on proxy variables of second language skill and formal schooling) (d,g). (a) Examples of vignettes (for all scenarios, see Supplementary Information Table 6), targets and foils for the four trial types. Facial configurations are examples because stimulus sets restrict publication of actual photographs. Arousal-controlled trials: the foil face differed from the target only in depicting positivity or negativity, or valence (e.g., a smiling facial configuration hypothesized to be the universal expression of happiness vs. a scowling facial configuration hypothesized to be the universal expression of anger). Valence is a descriptive feature of affect, along with a second feature, level of arousal. For example, some evidence suggests that perceivers may be able to distinguish scowling from pouting not because scowling is perceived as “anger” and pouting is perceived as “sadness” but because scowling is typically perceived as high arousal and pouting as low arousal. Valence-controlled trials: the foil face differed from the target only in depicting level of arousal (e.g., a scowling vs. a pouting configuration hypothesized to be the universal expressions of anger and sadness, respectively). Affect-uncontrolled trials: the foil face differed from the target in depicting both valence and level arousal (e.g., a smiling vs. a pouting configuration). Affect-controlled trials: the foil face matched the target in depicting valence and arousal (e.g., a scowling vs. a wide-eyed gasping facial configuration hypothesized to be the universal expressions of anger and fear, respectively). Performance for each of the 4 experimental conditions (x-axis) is plotted for US participants (b), Hadza participants (c) and Hadza-M participants (d). Performance within the affect-controlled condition, for each of the 3 target facial configurations (x-axis) is plotted for US participants (e), Hadza participants (f) and Hadza-M participants (g). Individual data points represent mean proportion agreement (i.e., selecting a target matching the presumed universal model) for a given participant within a given condition. Contours of violin plots represent density of data points at a given agreement level. Horizontal red bar represents chance-level performance, and significance against chance-level responding is noted at the top of each violin plot: ***p < 0.001 **p < 0.01 *p < 0.05 †p < 0.10. Means combined with brackets represent conditions that do not statistically differ in χ2 tests (ps > 0.25). Statistically significant differences between conditions based on follow-up χ2 tests are notated using the same conventions, with the following exception: **(*) indicates statistical significance for individual tests ranged between p < 0.01 and p < 0.001.
Figure 3 Study 2 Task Conditions (a) and Performance for US (b,e), Hadza (c,f) and Hadza participants with minimized exposure to other cultural groups (Hadza-M; subset based on proxy variables of second language skill and formal schooling) (d,g). (a) Examples of vignettes (for all scenarios, see Supplementary Information Table 6), targets and foils for the four trial types. Facial configurations are examples because stimulus sets restrict publication of actual photographs. Arousal-controlled trials: the foil face differed from the target only in depicting positivity or negativity, or valence (e.g., a smiling facial configuration hypothesized to be the universal expression of happiness vs. a scowling facial configuration hypothesized to be the universal expression of anger). Valence is a descriptive feature of affect, along with a second feature, level of arousal. For example, some evidence suggests that perceivers may be able to distinguish scowling from pouting not because scowling is perceived as “anger” and pouting is perceived as “sadness” but because scowling is typically perceived as high arousal and pouting as low arousal. Valence-controlled trials: the foil face differed from the target only in depicting level of arousal (e.g., a scowling vs. a pouting configuration hypothesized to be the universal expressions of anger and sadness, respectively). Affect-uncontrolled trials: the foil face differed from the target in depicting both valence and level arousal (e.g., a smiling vs. a pouting configuration). Affect-controlled trials: the foil face matched the target in depicting valence and arousal (e.g., a scowling vs. a wide-eyed gasping facial configuration hypothesized to be the universal expressions of anger and fear, respectively). Performance for each of the 4 experimental conditions (x-axis) is plotted for US participants (b), Hadza participants (c) and Hadza-M participants (d). Performance within the affect-controlled condition, for each of the 3 target facial configurations (x-axis) is plotted for US participants (e), Hadza participants (f) and Hadza-M participants (g). Individual data points represent mean proportion agreement (i.e., selecting a target matching the presumed universal model) for a given participant within a given condition. Contours of violin plots represent density of data points at a given agreement level. Horizontal red bar represents chance-level performance, and significance against chance-level responding is noted at the top of each violin plot: ***p < 0.001 **p < 0.01 *p < 0.05 †p < 0.10. Means combined with brackets represent conditions that do not statistically differ in χ2 tests (ps > 0.25). Statistically significant differences between conditions based on follow-up χ2 tests are notated using the same conventions, with the following exception: **(*) indicates statistical significance for individual tests ranged between p < 0.01 and p < 0.001.CC BY · PubMed Central

Verification

Claims the paper makes

The claims and statistics of this paper haven’t been checked yet.

Free: it reads the open-access text and checks the first 5 claims that cite a source we can check. Create a free account to check every claim.

A few free checks a day · papers already verified open instantly · results are public

Claims other papers make about this one

Each is checked against this paper’s own text: does it say what the citing paper says it does?

Self-check

Percentages, sums and reported differences re-computed from the paper’s own numbers.

The self-check needs the paper’s full text.

Citations

Cites

Show all 90 references

Research works printed but not linked: 4

  1. Ekman, P. In Nebraska symposium on motivation, 1971. (ed. Cole, J.) 207–282 (University of Nebraska Press).
  2. Crivelli, C. & Gendron, M. In The Science of Facial Expression (eds José-Miguel Fernández-Dols & James A. Russell) (Oxford University Press, 2017).
  3. Siegel, E. H. et al. Emotion fingerprints or emotion populations? A meta-analytic investigation of autonomic features of emotion categories. (under review).
  4. Lee, D. H. & Anderson, A. K. In The Science of Facial Expression (eds Fernandez-Dols, J. M. & Russell, J. A.) 173 (Oxford University Press, 2017).

Cited by

See all 52

Metadata

Authors
Gendron, M., Hoemann, K., Crittenden, A. N., Mangola, S. M., Ruark, G. A., & Barrett, L. F.
Affiliations
  • Yale University (US)
  • Northeastern University (US)
  • University of Nevada, Las Vegas (US)
  • University of Arizona (US)
  • United States Army (US)
Corresponding author
  • Gendron, Maria
  • Barrett, Lisa Feldman
Venue
Scientific Reports
Published
2020-03-02
Volume
10
Issue
1
Pages
3867-3867
ISSN
2045-2322 (ISSN-L)
OpenAlex
W3010423010
Cited by
52
References
90
Citations by year
2026: 3 · 2025: 7 · 2024: 5 · 2023: 13 · 2022: 7 · 2021: 9 · 2020: 6
FWCI
8.46
Type
journal article
Language
en
Open access
Licence
Locations
  • Scientific Reports (publishedVersion, cc-by)
  • PubMed Central (publishedVersion, cc-by)
  • PubMed (publishedVersion)
  • Lirias (acceptedVersion, cc-by)
  • UA Campus Repository (The University of Arizona) (acceptedVersion, cc-by)
  • Digital Scholarship - UNLV (University of Nevada Reno) (submittedVersion, cc-by)
  • PsyArXiv (OSF Preprints) (submittedVersion)
  • OSF Preprints (OSF Preprints) (submittedVersion)
  • PsyArXiv (OSF Preprints) (submittedVersion, cc-by)
Funders
  • U.S. Department of Health and Human Services (5F32MH105052)
  • National Institutes of Health
  • National Institute of Mental Health (F32MH105052)
  • Army Research Institute for the Behavioral and Social Sciences (W911NF-15-1-0647)
Topics
  • Social Sciences › Psychology › Experimental and Cognitive Psychology › Evolutionary Psychology and Human Behavior
  • Life Sciences › Neuroscience › Cognitive Neuroscience › Face Recognition and Perception
  • Social Sciences › Psychology › Social Psychology › Cultural Differences and Values
Keywords
emotion perception, Hadza, facial expressions, universal emotions, hunter-gatherers, cultural learning, embodied knowledge, evolutionary psychology, small-scale societies, replication
MeSH terms
Cross-Cultural Comparison, Emotions, Ethnicity, Female, Humans, Male, Tanzania

About these checks

Registry, retraction, Cites and statistics results are computed, not judged, with one exception: a printed reference that no index lists is read once by a model before it counts as a citation error. Claims are extracted by a model and kept only when their quote appears verbatim in the text; each cited source is then checked, with a model’s help, for whether it says what the claim relies on. Those verdicts can be wrong — read the claim’s quote and the cited source before relying on one.

Statistics and arithmetic are recomputed, not judged.

Confidence bands are shown only for fields calibrated on our annotated test set. None is calibrated yet, so no band is shown.

What counts as a claim ›How we measure confidence ›How we check this ›

Are you an author, or do you see a problem with this page? Request a review

How to cite

Cite CoChat for the checks on this page, and the paper for its own findings.

This page
CoChat. (2026). Citation check: Emotion Perception in Hadza Hunter-Gatherers. https://app.cochat.ai/papers/10.1038/s41598-020-60257-2
The paper
Gendron, M., Hoemann, K., Crittenden, A. N., Mangola, S. M., Ruark, G. A., & Barrett, L. F. (2020). Emotion Perception in Hadza Hunter-Gatherers. Scientific Reports. https://doi.org/10.1038/s41598-020-60257-2

Data sources

Bibliographic data: Semantic Scholar, OpenAlex, Crossref.

Contains information from the Semantic Scholar Academic Graph Datasets, made available under the ODC Attribution License (ODC-BY 1.0).

Semantic Scholar’s data is described in: Kinney, R., et al. (2023). The Semantic Scholar Open Data Platform. arXiv:2301.10140.