

The DOI matches its Crossref record; 77 of the 77 references it cites were found in a registry or an index; none of the 70 sources its claims cite is checked for support yet.
The effect of smoking on chronic inflammation, immune function and blood cell composition
Open accessAbstract
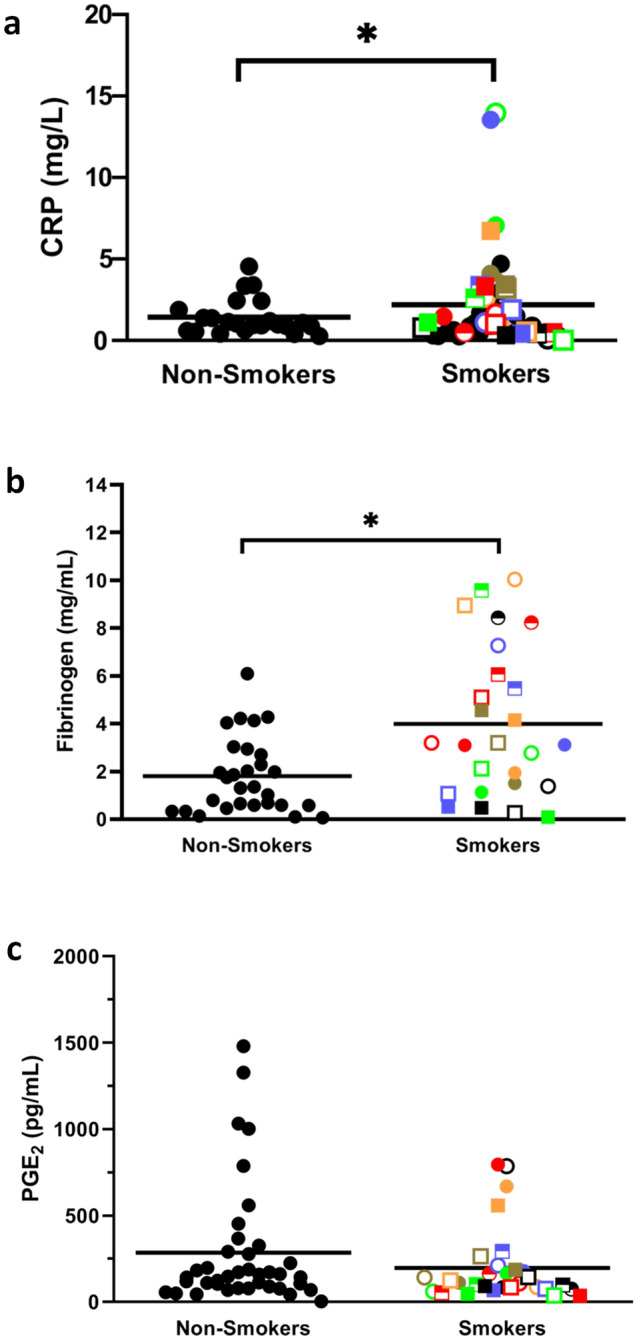
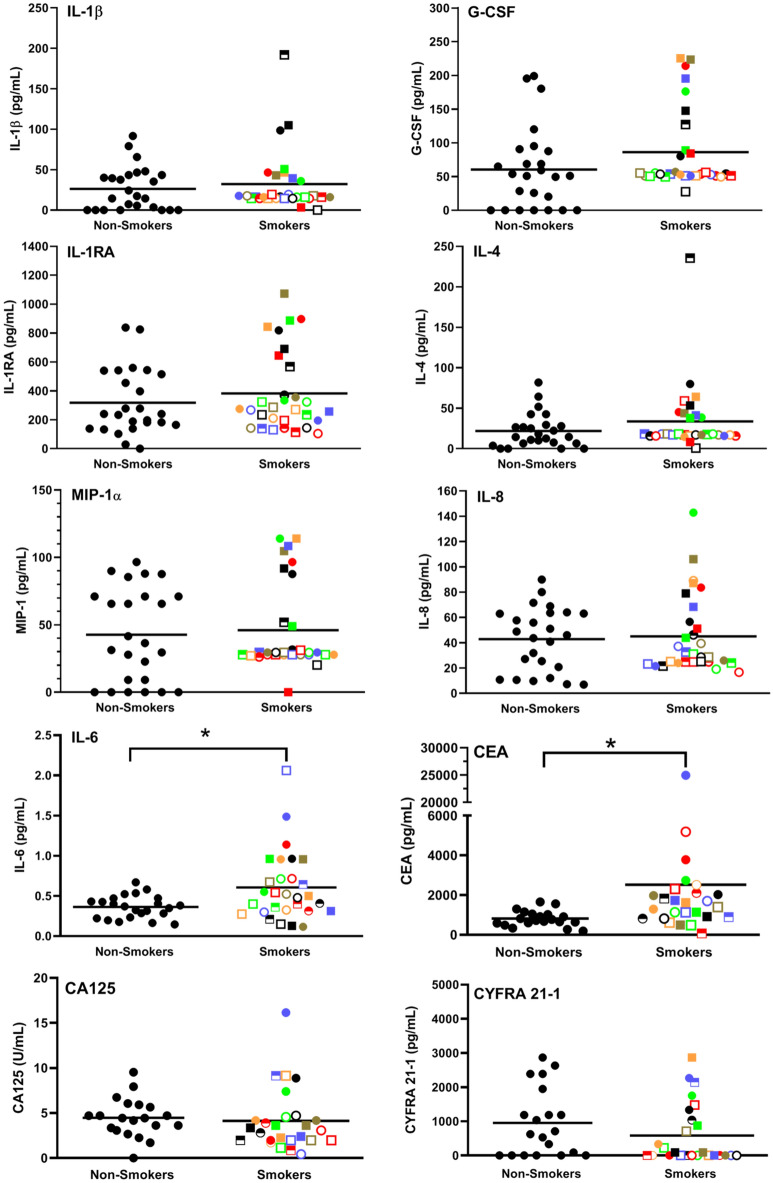
Smoking is the number one risk factor for cancer mortality but only 15–20% of heavy smokers develop lung cancer. It would, therefore, be of great benefit to identify those at high risk early on so that preventative measures can be initiated. To investigate this, we evaluated the effects of smoking on inflammatory markers, innate and adaptive immune responses to bacterial and viral challenges and blood cell composition. We found that plasma samples from 30 heavy smokers (16 men and 14 women) had significantly higher CRP, fibrinogen, IL-6 and CEA levels than 36 non-smoking controls. Whole blood samples from smokers, incubated for 7 h at 37 °C in the absence of any exogenous stimuli, secreted significantly higher levels of IL-8 and a number of other cytokines/chemokines than non-smokers. When challenged for 7 h with E. coli, whole blood samples from smokers secreted significantly lower levels of many inflammatory cytokines/chemokines. However, when stimulated with HSV-1, significantly higher levels of both PGE 2 and many cytokines/chemokines were secreted from smokers’ blood samples than from controls. In terms of blood cell composition, red blood cells, hematocrits, hemoglobin levels, MCV, MCH, MCHC, Pct and RDW levels were all elevated in smokers, in keeping with their compromised lung capacity. As well, total leukocytes were significantly higher, driven by increases in granulocytes and monocytes. In addition, smokers had lower NK cells and higher Tregs than controls, suggesting that smoking may reduce the ability to kill nascent tumor cells. Importantly, there was substantial person-to person variation amongst smokers with some showing markedly different values from controls and others showing normal levels of many parameters measured, indicating the former may be at significantly higher risk of developing lung cancer.
Overview
CoChat Summary
TL;DR
In a cross-sectional comparison, heavy smokers showed elevated chronic inflammation markers (CRP, fibrinogen, IL-6, CEA) and altered blood cell composition (higher granulocytes/monocytes/Tregs, lower NK cells) versus non-smokers. Whole blood from smokers also had higher unstimulated and HSV-1-induced cytokine/PGE2 responses but lower responses to E. coli, with substantial person-to-person variation.
Key findings
- Plasma from 30 heavy smokers had significantly higher CRP (p = 0.046), fibrinogen (p = 0.005), IL-6 (p = 0.049), and CEA (p = 0.0009) than 36 non-smoking controls; PGE2 was not significantly elevated (p = 0.259).
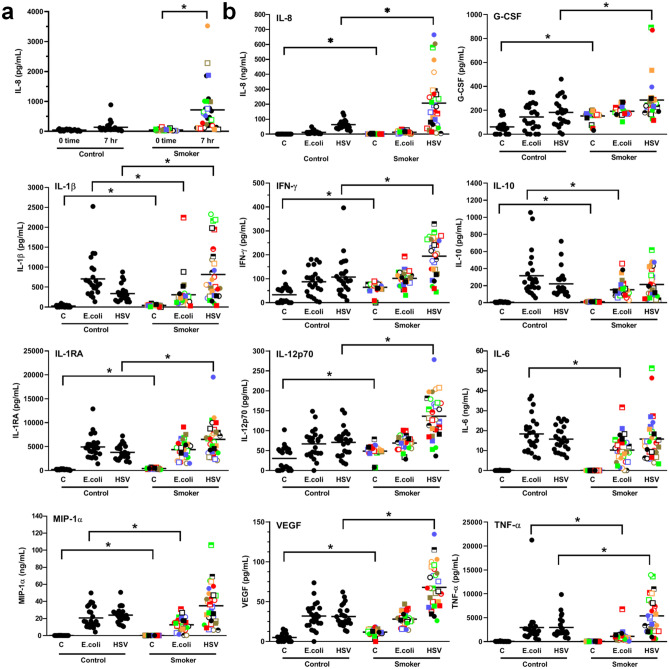
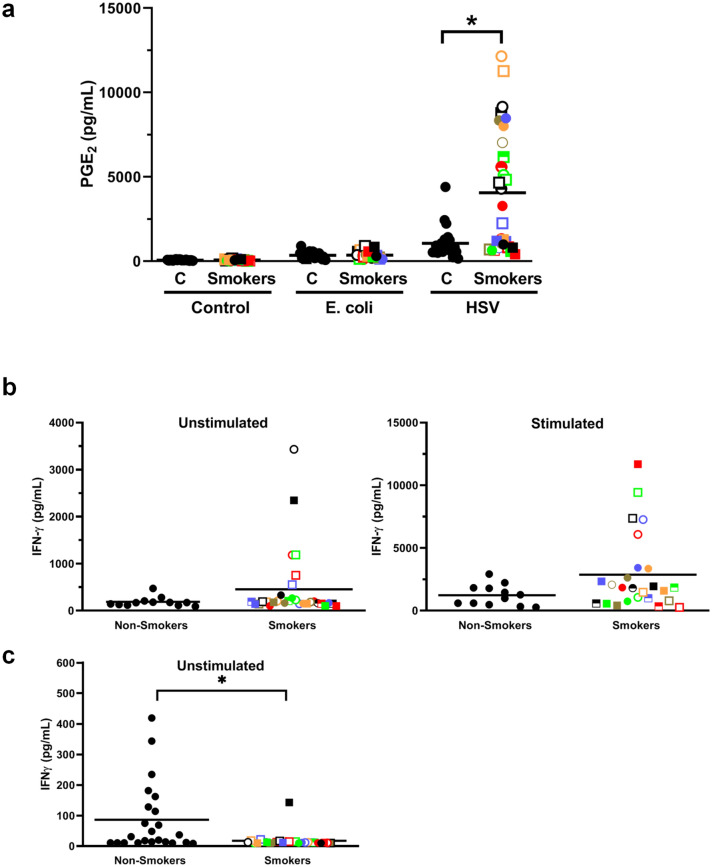
- After 7 h incubation without exogenous stimulus, smokers’ whole blood secreted significantly more IL-8 (p < 0.0001). With HSV-1, smokers’ blood secreted significantly more G-CSF (p = 0.012), IL-8 (p = 0.002), IL-1β (p = 0.004), IFNγ (p = 0.0002), IL-1RA (p = 0.0005), IL-12 (p < 0.0001), TNFα (p = 0.003), VEGF (p < 0.0001), and PGE2. With E. coli, smokers’ blood secreted significantly less IL-1β (p = 0.002), IL-10 (p = 0.0003), IL-6 (p = 0.0004), MIP1α (p = 0.02), and TNFα (p < 0.0001).
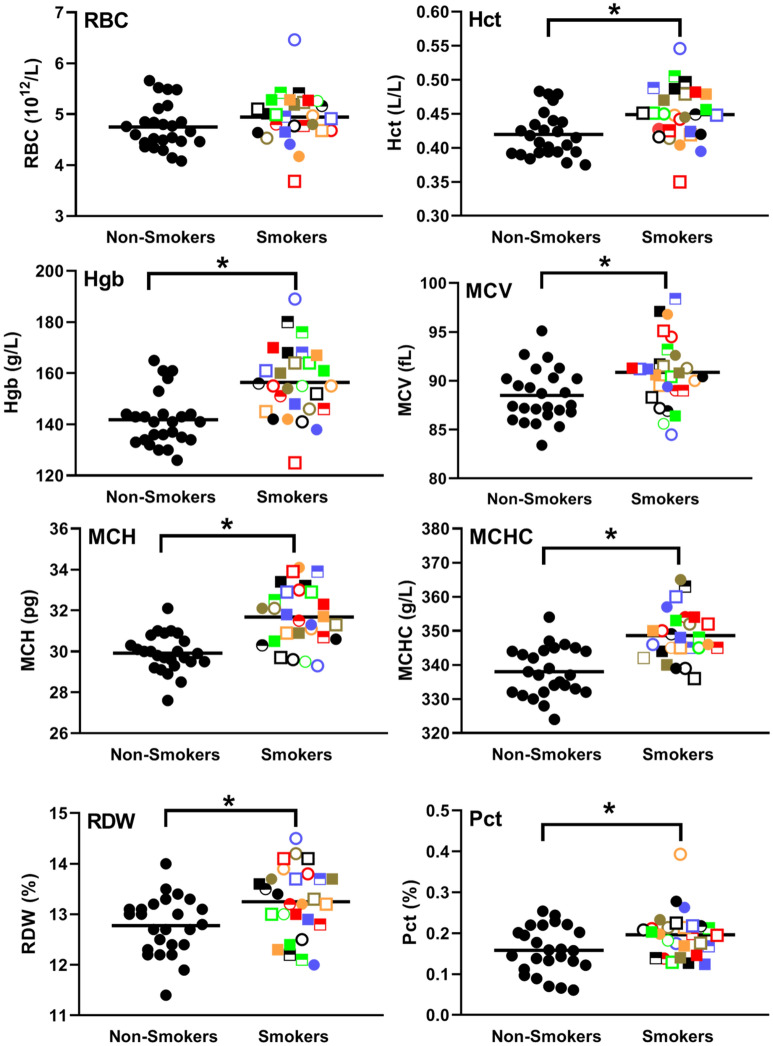
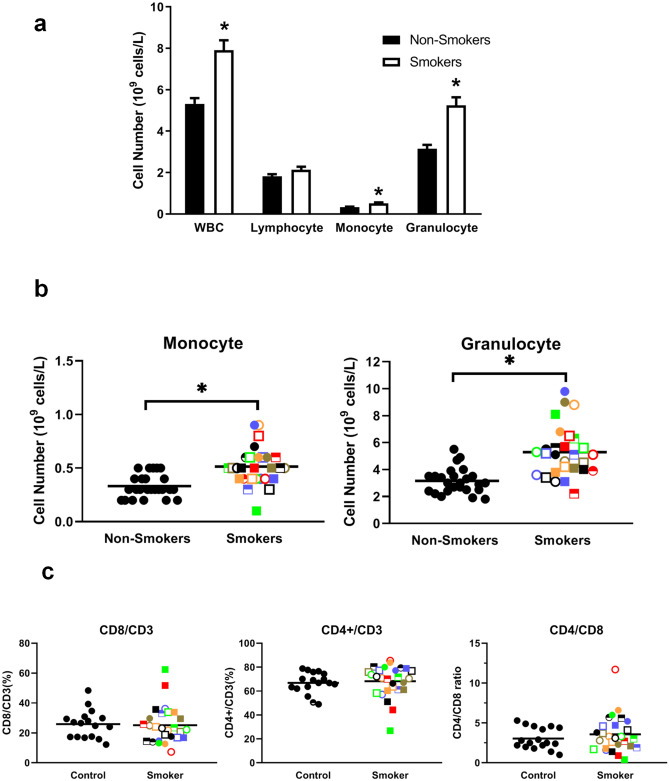
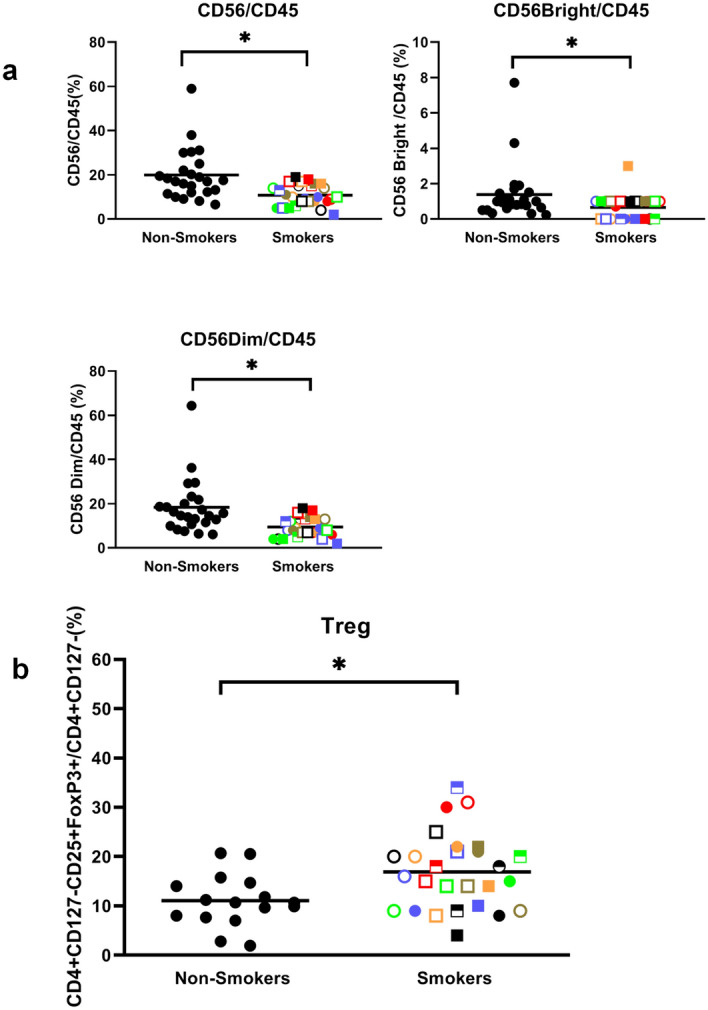
- Smokers had significantly higher hematocrit (p = 0.01), hemoglobin (p = 0.0002), MCV/MCH/MCHC (p < 0.05), RDW (p = 0.007), and plateletcrit (p = 0.02), but no significant difference in RBC count (p = 0.212). Total leukocytes, monocytes, and granulocytes were significantly higher (p < 0.0001 each), lymphocytes were not (p = 0.058), NK cells were lower (p = 0.0002), and Tregs were higher; CD4/CD8 ratio did not change.
- There was substantial person-to-person variation among smokers, with some showing markedly different values from controls and others normal levels across many parameters.
Methods
- Cross-sectional comparison of 30 heavy smokers (current smokers smoking ≥ 1 pack/day for at least 20 years; 16 men and 14 women) and 36 healthy never-smoker controls; blood collected at BC Cancer between 8:30 am and 10:00 am.
- Whole blood was incubated for 7 h at 37 °C in 5% oxygen with PBS, E. coli, or HSV-1; plasma cytokines/chemokines were measured by Luminex and MesoScale, and PGE2, fibrinogen, and CRP by ELISA. Blood differential counts used a Coulter Ac•T diff2 analyzer; immunophenotyping used flow cytometry; T cell activation used anti-CD3 + anti-CD28.
- Statistical comparisons used unpaired two-tailed t-tests or Mann–Whitney tests after normality/variance checks, with Pearson correlations; p < 0.05 considered significant.
Limitations
- Stated: the sample size is relatively small, the data set is from a single time point, and it is difficult to determine the relative weight to give different biomarkers; the authors intend to expand the sample and follow participants over time to see who develops lung cancer.
- Evident: the cross-sectional design cannot establish causality or directly predict future lung cancer, and the study reports no cancer outcomes.
- Evident: subgroup analyses are small (e.g., 9 smokers with COPD vs 21 without; sex comparisons), and some in vitro assays gave discordant IFNγ results between whole blood and PBMC cultures.
Model-written summary. Check it against the paper before relying on it.
Integrity signals
Registry
Cites
Statistics
Figures
Verification
Claims the paper makes
0 Valid · 0 Not valid · 41 Not checked · 80 Own results and interpretations
A result the paper reports from its own data — it cites no other source for it, so there is none to check. The quote shows it is in the paper.
In the paper
“hematocrits (top right panel, Fig. 5, p = 0.01) and hemoglobin levels (2nd row left panel, Fig. 5, p = 0.0002) were significantly elevated in smokers.”
§ The effect of smoking on chronic inflammation, immune function and blood cell composition > Results > Smoking increases the size and hemoglobin level of red blood cells
plainstates an association- Asserted: passes — The authors put it forward as true.
- Checkable: passes — It can be checked against evidence.
- Load-bearing: passes — The paper’s conclusions depend on it.
- Based: passes — The paper gives a reason why it holds.
- Rests on an assumption not shown here.
A result the paper reports from its own data — it cites no other source for it, so there is none to check. The quote shows it is in the paper.
In the paper
“there was a trend towards higher levels of IFNγ secretion under both unstimulated and stimulated conditions.”
§ The effect of smoking on chronic inflammation, immune function and blood cell composition > Results > Smoking tends to increase IFNγ secretion from activated T cells
hedgedstates an association- Asserted: passes — The authors put it forward as true.
- Checkable: passes — It can be checked against evidence.
- Load-bearing: unclear — It is unclear whether the paper’s conclusions depend on it.
- Based: passes — The paper gives a reason why it holds.
- Rests on 2 assumptions not shown here.
A result the paper reports from its own data — it cites no other source for it, so there is none to check. The quote shows it is in the paper.
In the paper
“we found a significantly (p = 0.0002) lower proportion of natural killer (NK) cells (i.e., both CD56 bright and dim cells) and higher Tregs (CD4 + CD127low/-CD25 + FoxP3 + cells) (Fig. 7)”
§ The effect of smoking on chronic inflammation, immune function and blood cell composition > Results > Smokers have elevated monocytes, granulocytes and Tregs and reduced NK cells
plainstates an association- Asserted: passes — The authors put it forward as true.
- Checkable: passes — It can be checked against evidence.
- Load-bearing: passes — The paper’s conclusions depend on it.
- Based: passes — The paper gives a reason why it holds.
- Rests on an assumption not shown here.
A result the paper reports from its own data — it cites no other source for it, so there is none to check. The quote shows it is in the paper.
In the paper
“Of note, there was a strong correlation, following E. coli stimulation, between IL-6 and MIP-1α (R = 0.913) levels as well as between IL-1β and TNFα (R = 0.822) levels (Table 3, Supplementary Table S2).”
§ The effect of smoking on chronic inflammation, immune function and blood cell composition > Results > Blood from smokers secrete elevated levels of inflammatory cytokines/chemokines when incubated with or without HSV-1 but reduced levels with E. coli
boostedstates an association- Asserted: passes — The authors put it forward as true.
- Checkable: passes — It can be checked against evidence.
- Load-bearing: unclear — It is unclear whether the paper’s conclusions depend on it.
- Based: passes — The paper gives a reason why it holds.
- Rests on 2 assumptions not shown here.
A result the paper reports from its own data — it cites no other source for it, so there is none to check. The quote shows it is in the paper.
In the paper
“However, in response to E. coli stimulation this trend was reversed with significantly lower levels of IL-1β (p = 0.002), IL-10 (p = 0.0003), IL-6 (p = 0.0004), MIP1α (p = 0.02) and TNFα (p < 0.0001) in whole blood samples from smokers than from controls (Fig. 3b).”
§ The effect of smoking on chronic inflammation, immune function and blood cell composition > Results > Blood from smokers secrete elevated levels of inflammatory cytokines/chemokines when incubated with or without HSV-1 but reduced levels with E. coli
plainstates a cause- Asserted: passes — The authors put it forward as true.
- Checkable: passes — It can be checked against evidence.
- Load-bearing: passes — The paper’s conclusions depend on it.
- Based: passes — The paper gives a reason why it holds.
- Rests on 2 assumptions not shown here.
86 more claims
Create a free account to see all 121 claims and to verify the 70 references still open.
- It may state two separate claims as one. 19
- The quote only partly states this claim. 3
- Probably not a substantial claim. 9
Self-check
Percentages, sums and reported differences re-computed from the paper’s own numbers.
Each contradiction between two passages listed here was confirmed by an independent check.
Rated minor: it would not touch a result — a value no result rests on, a p-value that stays on the same side of the significance level, or a conflict that is clerical, resolved elsewhere in the paper, or outside its own findings.
In the paper
§ The effect of smoking on chronic inflammation, immune function and blood cell composition > Abstract
“red blood cells, hematocrits, hemoglobin levels, MCV, MCH, MCHC, Pct and RDW levels were all elevated in smokers”
§ The effect of smoking on chronic inflammation, immune function and blood cell composition > Results > Smoking increases the size and hemoglobin level of red blood cells
“Figure 5 Smoking increases hematocrits, HgB, MCV, MCH, MCHC, RDW and Pct but not RBC levels.”
Rated minor: it would not touch a result — a value no result rests on, a p-value that stays on the same side of the significance level, or a conflict that is clerical, resolved elsewhere in the paper, or outside its own findings.
In the paper
“| Male % | 33.3% | 55.1% |”
§ The effect of smoking on chronic inflammation, immune function and blood cell composition > Results > Smoking is associated with elevated CRP, fibrinogen, IL-6 and CEA but not PGE2 levels
Reported 55.1 · recomputed 53.333333
Rated minor: it would not touch a result — a value no result rests on, a p-value that stays on the same side of the significance level, or a conflict that is clerical, resolved elsewhere in the paper, or outside its own findings.
In the paper
§ The effect of smoking on chronic inflammation, immune function and blood cell composition > Discussion > Smoking is associated with elevated CRP, fibrinogen, IL-6 and CEA levels
“in response to HIV-1 stimulation, significantly lower levels of IL-1β.”
§ The effect of smoking on chronic inflammation, immune function and blood cell composition > Results > Blood from smokers secrete elevated levels of inflammatory cytokines/chemokines when incubated with or without HSV-1 but reduced levels with E. coli
“To mimic an in vivo bacterial or viral infection, we employed intact E. coli and HSV-1 as in our earlier obesity20and aging studies21.”
Rated minor: it would not touch a result — a value no result rests on, a p-value that stays on the same side of the significance level, or a conflict that is clerical, resolved elsewhere in the paper, or outside its own findings.
In the paper
§ The effect of smoking on chronic inflammation, immune function and blood cell composition > Results > Blood from smokers secrete elevated levels of inflammatory cytokines/chemokines when incubated with or without HSV-1 but reduced levels with E. coli
“Whole fresh blood from smokers and controls were diluted tenfold with RPMI and incubated for 4 days at 37 °C in the absence (left panel) or presence (right panel) of anti-CD3 + anti-CD28 antibodies.”
§ The effect of smoking on chronic inflammation, immune function and blood cell composition > Methods > T cell activation
“Fresh whole blood samples collected in heparin were diluted tenfold with RPMI and 90 µl of the diluted blood was incubated in 96-well flat-bottom tissue culture plates in a humidified incubator at 5% CO2, 37ºC for 2 days in the presence or absence of anti-CD3 + anti-CD28.”
Citations
Cites
IL‐6 in inflammation, immunity, and disease
Tanaka, T., Narazaki, M., & Kishimoto, T. (2014) · Cold Spring Harbor Perspectives in Biology · doi:10.1101/cshperspect.a016295 · Cited by 5,046
Role of C-Reactive Protein at Sites of Inflammation and Infection
Sproston, N. R., & Ashworth, J. (2018) · Frontiers in Immunology · doi:10.3389/fimmu.2018.00754 · Cited by 3,276
Antiviral Actions of Interferons
Samuel, C. E. (2001) · Clinical Microbiology Reviews · doi:10.1128/cmr.14.4.778-809.2001 · Cited by 2,743
Kishimoto, T. (1989) · Blood · doi:10.1182/blood.v74.1.1.bloodjournal7411 · Cited by 2,068
Ridker, P. M., MacFadyen, J. G., Thuren, T., Everett, B. M., Libby, P., Glynn, R. J., Ridker, P., Lorenzatti, A., Krum, H., Varigos, J., et al. (2017) · The Lancet · doi:10.1016/s0140-6736(17)32247-x · Cited by 1,344
Ridker, P. M. (2016) · Circulation Research · doi:10.1161/circresaha.115.306656 · Cited by 1,002
Global Effects of Smoking, of Quitting, and of Taxing Tobacco
Jha, P., & Peto, R. (2014) · New England Journal of Medicine · doi:10.1056/nejmra1308383 · Cited by 843
Yanbaeva, D. G., Dentener, M. A., Creutzberg, E. C., Wesseling, G., & Wouters, E. F. M. (2007) · Chest · doi:10.1378/chest.06-2179 · Cited by 809
Systemic oxidative stress in asthma, COPD, and smokers
Rahman, I., Morrison, D., Donaldson, K., & MacNee, W. (1996) · American Journal of Respiratory and Critical Care Medicine · doi:10.1164/ajrccm.154.4.8887607 · Cited by 774
Cigarette Smoking and Inflammation: Cellular and Molecular Mechanisms
Lee, J., Taneja, V., & Vassallo, R. (2011) · Journal of Dental Research · doi:10.1177/0022034511421200 · Cited by 705
Cited by
Items 201–265 of 265
Sex-specific relations of ceramides and white matter hyperintensities in the Rhineland study
Landstra, E. N., Lohner, V., & Breteler, M. M. B. (2025) · Scientific Reports · doi:10.1038/s41598-025-06911-z
Framingham risk score associates with incident cancer and heart failure
van den Berg, P. F., Yousif, L. I. E., van Essen, B. J., Damman, K., Voors, A. A., Sayour, N. V., Suthahar, N., Kok, T. F., Yang, Y., Bakker, S. J. L., et al. (2025) · European Heart Journal Supplements · doi:10.1093/eurheartjsupp/suaf083.078
Li, F., Zhang, L., Shi, M., Yang, C., Tong, J., Gao, Y., & Li, Z. (2025) · Pharmacognosy Magazine · doi:10.1177/09731296251364981
Nath, K. A. (2025) · Mayo Clinic Proceedings · doi:10.1016/j.mayocp.2025.07.026
Cappella, F., Rienzo, A. D., Chiapponi, M., Liverotti, V., & Dobran, M. (2025) · Rheumato · doi:10.3390/rheumato5030013
Abscisic Acid as a Marker of Metabolic Imbalance: Serum Levels from Diabetic and Smoking Subjects
Abate, F., Schiano, E., Guerra, F., Piccinocchi, G., Tenore, G. C., & Novellino, E. (2025) · Diabetology · doi:10.3390/diabetology6090093
Treur, J. L., Vermeulen, J. M., & van de Weijer, M. P. (2025) · Journal of Child Psychology and Psychiatry · doi:10.1111/jcpp.70059
Tang, W., & Li, R. (2025) · Journal of Orthopaedic Surgery and Research · doi:10.1186/s13018-025-06014-5
Lv, H., Liu, J., Cao, Y., Fan, W., Shen, G., Wang, F., Ye, Q., Wu, X., & Xu, K. (2025) · Interactive Journal of Medical Research · doi:10.2196/72244
Hu, W., Chen, S., Cai, J., Yang, Y., Yan, H., & Chen, F. (2024) · Figshare · doi:10.6084/m9.figshare.26728942
Кіюн, І. Д., & Kiiun, I. (2024) · DSpace BSMU
Balls, E. (2024) · Open Access at Essex (University of Essex)
Chiong, O. (2024) · eScholarship (California Digital Library)
Watanabe, Y., Koide, Y., Aoyama, T., Hashimoto, S., Tachibana, H., & Kodaira, T. (2025) · The Royal College of Radiologists Open · doi:10.1016/j.rcro.2025.100352
Matala-asteisen tulehduksen yhteys masennukseen : kuvaileva kirjallisuuskatsaus
Ruotsala, A. (2025) · Theseus (Ammattikorkeakoulujen)
Sullivan, J. Y., Huang, H. X., Heidmann, J. C., Diaz, F., Brzechffa, C., Chen, J. H., Soyfer, E. M., Iwobi, N., Hasen, I., Ting, A., et al. (2026) · Toxicological Sciences · doi:10.1093/toxsci/kfag096
Investigating the impact of combustible and electronic cigarettes on clonal hematopoiesis
Sullivan, J. Y. (n.d.) · eScholarship (California Digital Library)
Chen, D., Li, Z., Zhou, C., Li, R., Ji, X., Feng, B., & Song, J. (2026) · Frontiers in Clinical Diabetes and Healthcare · doi:10.3389/fcdhc.2026.1665837
Profile Of SGPT (Serum Glutamic Pyruvic Transaminase) Levels In Active Smokers Aged 20-60 Years
Sudarwo, D. T. R., Hidayati, S., & Muflihah, A. I. (2024) · Journal of Medical Laboratory in Infectious and Degenerative Diseases · doi:10.36858/jmid.v2i1.20
Wang, Y. C., & Zhang, X. (2026) · Frontiers in Cardiovascular Medicine · doi:10.3389/fcvm.2026.1773167
Umphres, S. S., Alarabi, A. B., Ali, H. E. A., Qadri, S. M., Khasawneh, F. T., & Alshbool, F. Z. (2026) · Cardiovascular Toxicology · doi:10.1007/s12012-026-10093-z
Zhang, X., Li, Q., Zhao, F., Zhang, D., Song, X., & Wang, T. (2026) · BMC Psychiatry · doi:10.1186/s12888-026-07908-2
Zhang, L., Liao, J., Zhu, J., & Muscat, J. E. (2026) · Free Radical Biology and Medicine · doi:10.1016/j.freeradbiomed.2026.02.053
RetractedPetit, G., Selim, M. K., Canals, S., Starkel, P., Dricot, L., Poncin, M., Leclercq, S., & de Timary, P. (2026) · Translational Psychiatry · doi:10.1038/s41398-026-03907-9
Utuş, A., Özyılmaz, S., Karataş, T., Dağ, N., Ural, G., Çiçek, İ. B., & Kılıç, M. (2026) · Journal of Clinical Medicine · doi:10.3390/jcm15051950
Sasaki, T., Abe, S., Nozawa, H., Sasaki, K., Murono, K., Emoto, S., Yokoyama, Y., Nagai, Y., Harada, Y., & Ishihara, S. (2026) · Annals of Gastroenterological Surgery · doi:10.1002/ags3.70212
Saravia, A. R. (2025) · Investigative News in Education (Universidad de Costa Rica)
Mitochondria and cancer prevention
Taghizadeh‐Hesary, F., & Akbari, H. (2026) · Elsevier eBooks · doi:10.1016/b978-0-443-40535-8.00016-8
PCSK9 inhibition and inflammatory biomarkers: Signal, substrate, or confounding?
Özlek, B., & Tanık, V. O. (2026) · Journal of clinical lipidology · doi:10.1016/j.jacl.2026.02.023
Addo, P. N. O., Brown, M. J., Gupta, R. D., Apreku, A., Hall, C. D. X., & Naar, S. (2026) · Frontiers in Nutrition · doi:10.3389/fnut.2026.1808382
Ergüder, B. İ., Alemdar, M., Nojadeh, J. N., Türker, A. Y., & Yazıhan, N. (2026) · Turkish Journal of Tobacco Control · doi:10.64511/tjtc.2026.40
Hojeij, B., Tchetverikov, I., Kok, M. R., Vis, M., Goekoop-Ruiterman, Y. P. M., Bijsterbosch, J., Baudoin, P., Bos, R., van der Kaap, J. H., Kok, P., et al. (2026) · Arthritis Care & Research · doi:10.1002/acr.80080
Smoking, inflammation and joint health: A toxicological perspective in knee osteoarthritis
Fernández‐Torres, J., Martínez‐Nava, G. A., Martínez-Villarreal, A. A., Zamudio-Cuevas, Y. E., Hernández-Valencia, C. G., Torre-Morales, C. M., Vargas-Sandoval, B., Ilizaliturri-Sánchez, V. M., Espinosa-Morales, R., Cervantes-Meneses, J. F., et al. (2026) · Reumatología Clínica · doi:10.1016/j.reuma.2026.502157
Uzun, E., Uysal, Ö. A., & İnce, B. (2026) · International Journal of Psychiatry in Clinical Practice · doi:10.1080/13651501.2026.2669132
Yalew, M., Lumsden, A. L., Mulugeta, A., Madakkatel, I., Lee, S., Oehler, M. K., Maenpaa, J. U., & Hyppönen, E. (2026) · Journal of Public Health · doi:10.1093/pubmed/fdag034
Ting, M., Hsieh, C., & Chen, P.-C. (2026) · PubMed Central · doi:10.6515/acs.202605_42(3).20251008c
Smoking, inflammation and joint health: A toxicological perspective in knee osteoarthritis
Fernández‐Torres, J., Martínez‐Nava, G. A., Martínez-Villarreal, A. A., Zamudio-Cuevas, Y. E., Hernández-Valencia, C. G., Torre-Morales, C. M., Vargas-Sandoval, B., Ilizaliturri-Sánchez, V. M., Espinosa-Morales, R., Cervantes-Meneses, J. F., et al. (2026) · Reumatología Clínica (English Edition) · doi:10.1016/j.reumae.2026.502157
Prevalence and Associated Factors of Maskne in Dentistry Students
Gözükara, M. G., Bek, M., YUKSEL, R. G., ALKAN, S. N. E., Altundal, E. G., Ünal, E., Gökler, M. E., & Mollahaliloğlu, S. (2026) · Ankara Medical Journal · doi:10.5505/amj.2026.26675
Mirjalili, F. S., Jambarsang, S., Yazd, E. F., Dianatinasab, M., Eussen, S. J. P. M., Schram, M. T., Koster, A., Salehi‐Abargouei, A., Yu, E. Y.-W., Zeegers, M. P., et al. (2026) · American Journal of Clinical Nutrition · doi:10.1016/j.ajcnut.2026.101415
Mao, J., Guo, H., Yang, J., Wang, J., Tao, M., Wang, Y., Yan, X., & Li, M. (2026) · Cancer Management and Research · doi:10.2147/cmar.s611679
Self-citationThe Effect of DPP10 in Smoking and Vaping Induced Apoptosis and Inflammation
Afonja, A. (2026) · BCU Open Access Repository (Birmingham City University)
Schwarze, Y., Voges, J. F., Stenger, S., Stierand, J., Junghanns, K., Voß, O., Hundt, J. E., Paulus, F. M., Krach, S., Cabanis, M., et al. (2026) · Brain Behavior & Immunity - Health · doi:10.1016/j.bbih.2026.101313
Celiac disease onset and inflammatory milieu
Ciaccio, E. J., Wolf, R. L., Ciacci, C., Green, P. H. R., & Acharya, U. R. (2026) · World Journal of Gastrointestinal Endoscopy · doi:10.4253/wjge.118718
Systemic immune-inflammatory index is associated with malignancy in Lung-RADS 4 lung nodules
Ceron, S., Broad, S. R., Khan, A. A., Denson, K. L., Naeem, W., Lally, A., Kunta, C., Alex, G. C., Waxman, J., Seder, C. W., et al. (2026) · Journal of Thoracic Disease · doi:10.21037/jtd-2026-1-0433
Karska, J., Kowalski, S., Rudy, K., Szyszka, M., Lewicka, W., Enrico, P., Drexhage, H. A., Pawlak, E., Piotrowski, P., & Misiak, B. (2026) · Brain Behavior and Immunity · doi:10.1016/j.bbi.2026.106934
Elshamy, A. M., Samy, S. S., Shater, M. A. E., Fouad, S. M., Sayed, F. M. E., Khalil, A. M., & Amer, H. A. (2026) · The Egyptian Journal of Internal Medicine · doi:10.1186/s43162-026-00696-x
Qiu, Y., & Sun, X. (2026) · Clinical Cosmetic and Investigational Dermatology · doi:10.2147/ccid.s624506
Serum inflammatory markers and influencing factors in patients with colorectal adenomas
Chen, L., Zhong, H., Wang, Z., Zhang, X., & Li, Y. (2026) · American Journal of Cancer Research · doi:10.62347/ppei1509
Nicotine Is Not a Proinflammatory Component of E-cigarette Vapor
Smith, C. J., & Perfetti, T. A. (2026) · Contributions to Tobacco & Nicotine Research · doi:10.2478/cttr-2026-0009
Health behaviours and telomere biology in severe mental disorders
Mlakar, V., Forti, M. D., Halff, E. F., Srivastava, D. P., Akkouh, I. A., Djurovic, S., Martin-Ruiz, C. M., Quintana, D. S., Birkenæs, V., Steen, N. E., et al. (2026) · Translational Psychiatry · doi:10.1038/s41398-026-04362-2
Rementería, A. A. N. (2026) · MLS Health & Nutrition Research · doi:10.60134/mlshn.v5n1.4594
Quantifying annotation-stratified pleiotropy and co-polygenicity between complex traits
Qu, J., Zhao, T., Lin, T., Li, A., Liu, S., Chauquet, S., Visscher, P. M., Wray, N. R., Yengo, L., Zeng, J., et al. (2026) · World Congress on Genetics Applied to Livestock Production (WCGALP) · doi:10.31274/wcgalp.24241
Hematological Profiles and Complete Blood Count Alterations in Smokers
Berk, Ş. Ş., & Şahin, H. (2026) · Journal of Dependence · doi:10.51982/bagimli.622
Association of smoking cessation with late-life frailty risk: the Singapore Chinese health study
Lee, A. R. Y. B., Li, H., Chua, K. Y., & Koh, W.-P. (2026) · Frontiers in Aging · doi:10.3389/fragi.2026.1870256
Joshi, A., & Sanna, P. P. (2026) · bioRxiv (Cold Spring Harbor Laboratory) · doi:10.64898/2026.09.24.753990
Effect of Cigarette Smoking on Haematological Parameters Among Male in Derna, Libya
الحصني, ه. ص., إبعيص, إ. ع., العوكلي, ب. س., الزحاف, ر. ا., Alhosni, H. S., ebais, E. A.-A., Al-Awkli, B. S., & Elzahaf, R. A. (2025) · Sharwes Scientific Journal · doi:10.26629/ssj.2025.27
Zare, K., Salehi, Z., Gholami, M., Sharbaf, F. V., Zabihi, M. R., Toutounchian, S., Morovat, A., Dehghanian, A., Dehghan, A., Farjam, M., et al. (2026) · Scientific Reports · doi:10.1038/s41598-026-74430-6
Kumar, M. S. A. K., Srivastav, S., Devi, S. S., & Devi, C. R. (2023) · Journal Of Advanced Zoology
Liu, Q., Zeng, Z., Kuang, Y., Hua, Y., Zhang, C., Wang, M., Gong, J., Zhou, J., Deng, Y., Lu, J., et al. (2026) · International Journal of Cancer · doi:10.1002/ijc.70772
Gandara, I., Du, M., Li, Y., Su, L., Kothari, J., Lanuti, M., Gainor, J. F., & Christiani, D. C. (2026) · iScience · doi:10.1016/j.isci.2026.117843
Dinda, Febriani, H., & Ningrum, N. A. (2026) · Bioscientist Jurnal Ilmiah Biologi · doi:10.33394/bioscientist.v14i3.22299
Metadata
- Authors
- Elisia, I., Lam, V., Cho, B., Hay, M., Li, M. Y., Yeung, M., Bu, L., Jia, W., Norton, N., Lam, S., & Krystal, G.
- Affiliations
- University of British Columbia (CA)
- Corresponding author
- Krystal, Gerald
- Venue
- Scientific Reports
- Published
- 2020-11-10
- Volume
- 10
- Issue
- 1
- Pages
- 19480-19480
- ISSN
- 2045-2322 (ISSN-L)
- PMC
- PMC7655856
- OpenAlex
- W3098547973
- Semantic Scholar
- 2d338a0e15102ec7f2f5e47d29abf9e9e167b97e
- Cited by
- 263
- References
- 77
- Citations by year
- 2026: 62 · 2025: 68 · 2024: 59 · 2023: 37 · 2022: 28 · 2021: 9
- FWCI
- 13.54
- Type
- journal article
- Language
- en
- Open access
- gold
- doi.org
- Locations
- Scientific Reports (publishedVersion, cc-by)
- PubMed (publishedVersion)
- PubMed Central (publishedVersion, cc-by)
- Funders
- Lotte and John Hecht Memorial Foundation (3693)
- Topics
- Health Sciences › Medicine › Public Health, Environmental and Occupational Health › Smoking Behavior and Cessation
- Health Sciences › Medicine › Pulmonary and Respiratory Medicine › Chronic Obstructive Pulmonary Disease (COPD) Research
- Life Sciences › Immunology and Microbiology › Immunology › Immunotoxicology and immune responses
- Keywords
- smoking, chronic inflammation, immune function, blood cell composition, C-reactive protein, interleukin-6, fibrinogen, cytokines and chemokines, Escherichia coli challenge, prostaglandin E2, natural killer cells, regulatory T cells, granulocytes, monocytes, red blood cell indices, lung cancer risk, heavy smokers
- MeSH terms
- Aged, Blood Cell Count, C-Reactive Protein, Carcinoembryonic Antigen, Chronic Disease, Female, Fibrinogen, Humans, Immunity, Innate, Inflammation, Male, Middle Aged, Smoking, Biomarkers, Interleukin-6, Cytokines, Adaptive Immunity
About these checks
Registry, retraction, Cites and statistics results are computed, not judged, with one exception: a printed reference that no index lists is read once by a model before it counts as a citation error. Claims are extracted by a model and kept only when their quote appears verbatim in the text; each cited source is then checked, with a model’s help, for whether it says what the claim relies on. Those verdicts can be wrong — read the claim’s quote and the cited source before relying on one.
A language model drew the claims from the paper on 2026-11-13, under version 3 of the claim definition (model deepseek-v4.1-flash, prompt extract-v3).
A second model labelled each claim on 2026-11-13 (model jev-1.13-20260917, definition revision gold-guideline-v0.2).
Statistics and arithmetic are recomputed, not judged.
Confidence bands are shown only for fields calibrated on our annotated test set. None is calibrated yet, so no band is shown.
What counts as a claim ›How we measure confidence ›How we check this ›
Are you an author, or do you see a problem with this page? Request a review
Data sources
Bibliographic data: Semantic Scholar, OpenAlex, Crossref.
Contains information from the Semantic Scholar Academic Graph Datasets, made available under the ODC Attribution License (ODC-BY 1.0).
Semantic Scholar’s data is described in: Kinney, R., et al. (2023). The Semantic Scholar Open Data Platform. arXiv:2301.10140.
