

The DOI matches its Crossref record; 71 of the 71 references it cites were found in a registry or an index.
SkipGNN: predicting molecular interactions with skip-graph networks
Open accessAbstract
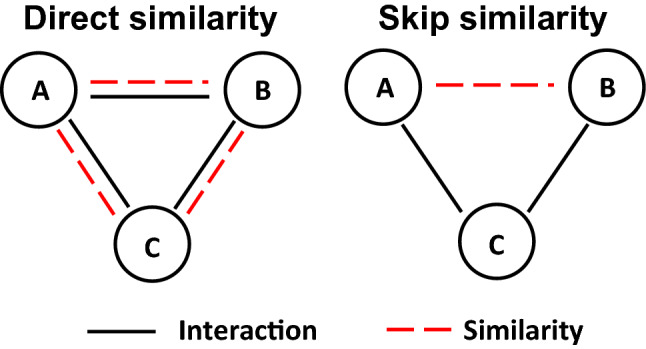
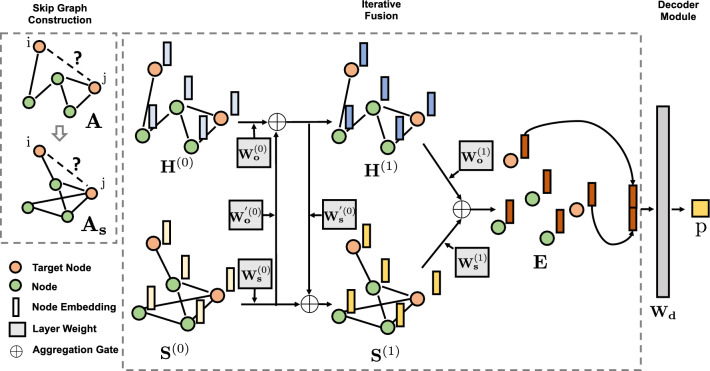
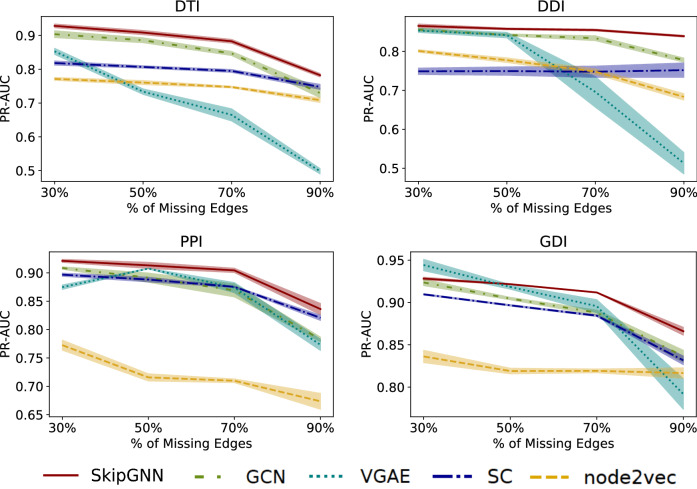
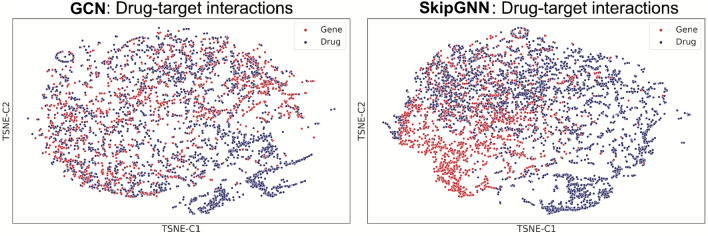
Molecular interaction networks are powerful resources for molecular discovery. They are increasingly used with machine learning methods to predict biologically meaningful interactions. While deep learning on graphs has dramatically advanced the prediction prowess, current graph neural network (GNN) methods are mainly optimized for prediction on the basis of direct similarity between interacting nodes. In biological networks, however, similarity between nodes that do not directly interact has proved incredibly useful in the last decade across a variety of interaction networks. Here, we present SkipGNN, a graph neural network approach for the prediction of molecular interactions. SkipGNN predicts molecular interactions by not only aggregating information from direct interactions but also from second-order interactions, which we call skip similarity. In contrast to existing GNNs, SkipGNN receives neural messages from two-hop neighbors as well as immediate neighbors in the interaction network and non-linearly transforms the messages to obtain useful information for prediction. To inject skip similarity into a GNN, we construct a modified version of the original network, called the skip graph. We then develop an iterative fusion scheme that optimizes a GNN using both the skip graph and the original graph. Experiments on four interaction networks, including drug–drug, drug–target, protein–protein, and gene–disease interactions, show that SkipGNN achieves superior and robust performance. Furthermore, we show that unlike popular GNNs, SkipGNN learns biologically meaningful embeddings and performs especially well on noisy, incomplete interaction networks.
Overview
The claims and statistics of this paper haven’t been checked yet.
Run the check — free, no account needed. It reads the open-access text and checks the sources it cites.
Integrity signals
Registry
Cites
Statistics
Figures
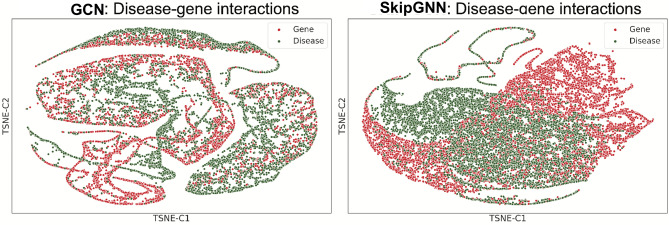
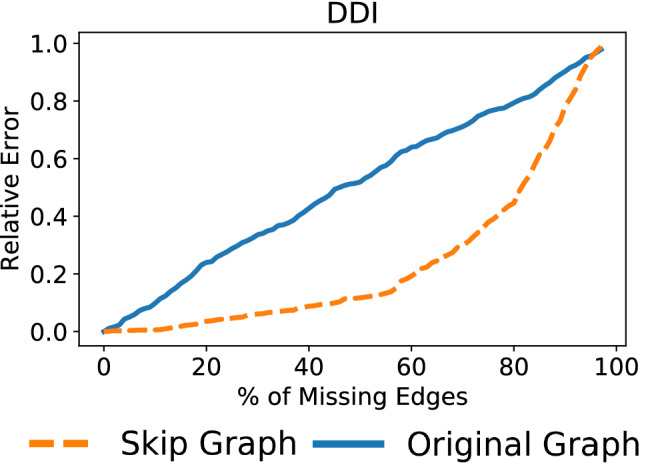
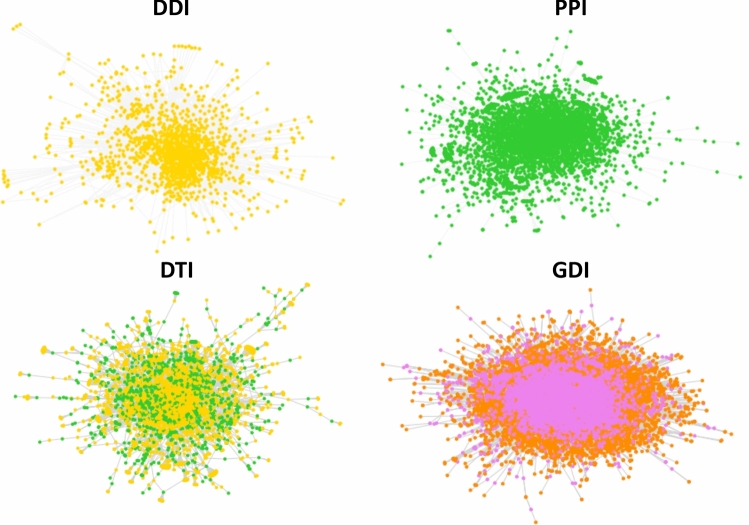
Verification
Claims the paper makes
The claims and statistics of this paper haven’t been checked yet.
Run the check — free, no account needed. It reads the open-access text and checks the sources it cites.
Claims other papers make about this one
Each is checked against this paper’s own text: does it say what the citing paper says it does?
In the citing paper
“Specifically, the inductive ability of graph convolution neural networks to generalize to data points unseen during model training (Section 2.2) and even generate new data points from scratch by decoding latent representation from the embedding space (Section 2.3) has enabled the discovery of new molecules, interactions, and functions [101, 108, 109].”
From Graph representation learning in biomedicine and healthcare (2022) · cites this paper as [101]
In the citing paper
“Unlike machine learning approaches designed to analyze data modalities like medical images and biological sequences, graph representation learning methods are uniquely able to leverage structural information in multimodal datasets [101].”
From Graph representation learning in biomedicine and healthcare (2022) · cites this paper as [101]
Self-check
Percentages, sums and reported differences re-computed from the paper’s own numbers.
The self-check needs the paper’s full text.
Citations
Cites
Adam: A Method for Stochastic Optimization
Kingma, D. P., & Ba, J. (2014) · arXiv · doi:10.48550/arxiv.1412.6980 · Cited by 98,946
Emergence of Scaling in Random Networks
Barabási, A.-L., & Albert, R. (1999) · Science · doi:10.1126/science.286.5439.509 · Cited by 36,135
(2008) · Journal of Machine Learning Research · Cited by 33,051
Semi-supervised classification with graph convolutional networks
Kipf, T. N., & Welling, M. (2016) · arXiv · doi:10.48550/arxiv.1609.02907 · Cited by 24,853
Graph Attention NetworksPreprint
Veličković, P., Casanova, A., Liò, P., Cucurull, G., Romero, A., & Bengio, Y. (2017) · arXiv (Cornell University) · doi:10.17863/cam.48429 · Cited by 19,745
Birds of a Feather: Homophily in Social Networks
McPherson, M., Smith-Lovin, L., & Cook, J. M. (2001) · Annual Review of Sociology · doi:10.1146/annurev.soc.27.1.415 · Cited by 18,567
Veličković, P., Cucurull, G., Casanova, A., Romero, A., Liò, P., & Bengio, Y. (2017) · arXiv · doi:10.48550/arxiv.1710.10903 · Cited by 12,107
A Comprehensive Survey on Graph Neural Networks
Wu, Z., Pan, S., Chen, F., Long, G., Zhang, C., & Yu, P. S. (2021) · IEEE Transactions on Neural Networks and Learning Systems · doi:10.1109/tnnls.2020.2978386 · Cited by 11,000
node2vec: Scalable Feature Learning for Networks
Grover, A., & Leskovec, J. (2016) · Proceedings of the 22nd ACM SIGKDD International Conference on Knowledge Discovery and Data Mining · doi:10.1145/2939672.2939754 · Cited by 10,926
Inductive Representation Learning on Large Graphs
Hamilton, W. L., Ying, R., & Leskovec, J. (2017) · arXiv · doi:10.48550/arxiv.1706.02216 · Cited by 10,639
Research works printed but not linked: 6
- Ribeiro, L. F., Saverese, P. H. & Figueiredo, D. R. struc2vec: Learning node representations from structural identity. In KDD 385–394 (2017).
- Xu, K., Hu, W., Leskovec, J. & Jegelka, S. How powerful are graph neural networks? In ICLR (2018).
- DuPont, P. Product Information. Coumadin (Warfarin). (DuPont Pharmaceuticals, Wilmington, 2000).
- Merck, C. I. Product Information. Belsomra (Suvorexant). (Merck & Company Inc., Whitehouse Station, 2014).
- Ligand, P. Product Information. Targretin (Bexarotene). (Ligand Pharmaceuticals, San Diego, 1999).
- Novartis, P. Product Information. Clozaril (Clozapine). (Novartis Pharmaceuticals, East Hanover, 1989).
Cited by
Sorted by citations
Items 101–133 of 133
Drug–drug interaction analysis based on information bottleneck graph neural network: A review
Wang, S. (2025) · Medicine · doi:10.1097/md.0000000000042904 · Cited by 1
IMF-DDI: Information Mapping and Fusion Framework for Drug-drug Interaction Prediction
Li, X., Zhang, Y., Liu, Y., Lu, X., Ma, P., Li, Y., Kitsuregawa, M., & Gu, Y. (2025) · Interdisciplinary Sciences Computational Life Sciences · doi:10.1007/s12539-025-00781-9 · Cited by 1
Graph neural networks for protein-protein interactions
Chang, S., Wang, Y., Zhang, X., & Zhang, F. (2023) · International Conference on Advanced Algorithms and Signal Image Processing (AASIP) · doi:10.1117/12.3006152 · Cited by 1
Graph Neural Networks with Non-Recursive Message Passing
Tan, Q., Zhang, X., Du, J., & Huang, X. X. (2023) · IEEE ... International Conference on Data Mining workshops · doi:10.1109/icdmw60847.2023.00072 · Cited by 1
Application and difficulties of deep learning in drug target discovery
Kuang, X. (2024) · MedScien · doi:10.61173/gj8h0z74 · Cited by 1
Jiang, W., Zhao, Z., Luo, Z., Zhou, J., Zhang, S., Hu, B., & Bian, P. (2024) · Electronics · doi:10.3390/electronics13152897 · Cited by 1
Are Generative-Based Graph Counterfactual Explainers Worth It?
Prado-Romero, M. A., Prenkaj, B., & Stilo, G. (2024) · Communications in computer and information science · doi:10.1007/978-3-031-74633-8_10 · Cited by 1
Enhancing Graph Convolutional Networks by Topology Sampling
Petit, Q. R., Li, C., Petiton, S. G., Chai, K., & Emad, N. (2022) · IEEE International Conference on Big Data (BigData) · doi:10.1109/bigdata55660.2022.10021014 · Cited by 1
Priyakumar, U. D., Korlepara, D. B., Vasavi, C. S., Srivastava, R. K., Pal, P. K., Raza, S. H., Kumar, V., Pandit, S., Nair, A. G., Pandey, S., et al. (2023) · ChemRxiv · doi:10.26434/chemrxiv-2023-mg07d · Cited by 1
Deep Learning for Network Biology
Lusito, E. (2024) · Wiley eBooks · doi:10.1002/9781119846567.ch5 · Cited by 2
Can GNNs Learn Link Heuristics? A Concise Review and Evaluation of Link Prediction MethodsPreprint
Liang, S., Ding, Y., Li, Z., Liang, B., Zhang, S., Wang, Y., & Fang, C. (2024) · Qeios · doi:10.32388/vx45mk · Cited by 1
Layer-stacked Attention for Heterogeneous Network EmbeddingPreprint
Tran, N., & Gao, J. (2020) · arXiv (Cornell University) · doi:10.48550/arxiv.2009.08072
Wang, N., Gao, Q., & Fan, J. (2023) · Communications in computer and information science · doi:10.1007/978-981-99-8141-0_37
Tu, S., Yang, Z., Wang, L., Liu, W., Zhang, Y., Luo, L., Xu, B., Wang, J., Yang, Y., Zhao, Z., et al. (2024) · IEEE International Conference on Bioinformatics and Biomedicine (BIBM) · doi:10.1109/bibm62325.2024.10822260
Siminea, N., Anand, P., Păun, A., Chiosis, G., Freeman, A., & Petre, I. (2025) · Elsevier eBooks · doi:10.1016/b978-0-443-29808-0.00021-2
Pharmacovigilance service recommendation with multilayered tripartite contrastive learning
Bai, Z., Liu, S., Yang, P., Zheng, Y., & Zhang, Y. (2025) · Expert Systems with Applications · doi:10.1016/j.eswa.2025.130464
Network Representation Learning Algorithm Integrating Local and Global Topology Information
Han, L., & Zhao, H. (2025) · Concurrency and Computation Practice and Experience · doi:10.1002/cpe.70516
AI-Driven Insights into Protein Sequence Analysis Landscape
Asim, M. N., Ahmed, S., & Dengel, A. (2025) · Springer eBooks · doi:10.1007/978-3-031-90454-7_5
Man, X., Sun, C., Chen, Z., Ji, Y., Du, J., & Yu, B. (2026) · ACS Synthetic Biology · doi:10.1021/acssynbio.5c00722
DrugBank-2025: An AI-Ready Next-Generation Dataset for Drug–Drug Interaction Prediction
Zhang, R., Du, T., Xiao, W. H., Chen, Z., Xu, P., Li, P., Wang, X., & Wang, P. (2025) · IEEE ... International Conference on Data Mining workshops · doi:10.1109/icdmw69685.2025.00009
ASSDA: Adaptive subgraph sampling with dual-attention for drug-drug interaction prediction
Chen, H., Guan, Q., & Duan, R. (2026) · Neurocomputing · doi:10.1016/j.neucom.2026.133575
Ming, Y., Li, L., Xia, J., Wang, Y., Lin, K., Huang, F., & Yang, F. (2026) · Analytical Biochemistry · doi:10.1016/j.ab.2026.116153
Xu, Y., Zhou, Z., Yuan, H., Liu, S., Zou, Q., Zhang, Y., & Zhang, W. (2026) · Briefings in Functional Genomics · doi:10.1093/bfgp/elag006
Nguyen, H., Nguyen, Q. H., & Le, D. (2026) · Journal of Chemical Information and Modeling · doi:10.1021/acs.jcim.6c01949
Brecher, V., Androutsopoulou, V. A., Sicouri, S., Ramlawi, B., Avgerinos, D. V., Athanasiou, T., & Magouliotis, D. E. (2026) · Frontiers in Systems Biology · doi:10.3389/fsysb.2026.1897299
Decoupling topological and molecular features for interpretable biomolecular interaction prediction
Wu, Q., Liu, Y., Yang, F., Huang, W., Zhu, X., & Liu, J. (2026) · Briefings in Bioinformatics · doi:10.1093/bib/bbag471
Hu, C., & Zhang, Z. (2026) · Electronics · doi:10.3390/electronics15184081
Hatami, F., & Moradi, M. (2026) · Machine Learning and Knowledge Extraction · doi:10.3390/make8100295
Cabrera‐Andrade, A., Robalino-Díaz, J., Dueñas-Espín, I., Zambrano, A. K., & Villegas-Ch, W. E. (2026) · Frontiers in Bioinformatics · doi:10.3389/fbinf.2026.1966469
Mokgopa, K. P., Tshiwawa, T., & Lobb, K. A. (2026) · Physical Chemistry Chemical Physics · doi:10.1039/d6cp02523d
SmartDyGNN: Dynamic Sparse Training for GNNs via Structural and Gradient Fusion
Hu, B., Li, N., Jiao, R., Zhang, Y., 杨翠娥, & Wei, Z. (2026) · International Joint Conference on Neural Networks (IJCNN) · doi:10.1109/ijcnn69854.2026.11728781
Qian, Y., Huang, Z., Zhong, L., Dong, X., & Hu, Q. (2026) · SSRN Electronic Journal · doi:10.2139/ssrn.7665712
Metadata
- Authors
- Huang, K., Xiao, C., Glass, L. M., Zitnik, M., & Sun, J.
- Affiliations
- Harvard University (US)
- IQVIA (United States) (US)
- University of Illinois Urbana-Champaign (US)
- Corresponding author
- Sun, Jimeng
- Venue
- Scientific Reports
- Published
- 2020-12-03
- Volume
- 10
- Issue
- 1
- Pages
- 21092-21092
- ISSN
- 2045-2322 (ISSN-L)
- PMC
- PMC7713130
- OpenAlex
- W3108458441
- Cited by
- 133
- References
- 65
- Citations by year
- 2026: 14 · 2025: 28 · 2024: 34 · 2023: 18 · 2022: 24 · 2021: 12 · 2020: 3
- FWCI
- 4.62
- Type
- journal article
- Language
- en
- Open access
- gold
- doi.org
- Locations
- Scientific Reports (publishedVersion, cc-by)
- arXiv (Cornell University) (publishedVersion)
- PubMed Central (publishedVersion, cc-by)
- PubMed (publishedVersion)
- arXiv (Cornell University) (cc-by)
- Topics
- Life Sciences › Biochemistry, Genetics and Molecular Biology › Molecular Biology › Bioinformatics and Genomic Networks
- Life Sciences › Pharmacology, Toxicology and Pharmaceutics › Drug Discovery › Computational Drug Discovery Methods
- Physical Sciences › Computer Science › Artificial Intelligence › Advanced Graph Neural Networks
- Keywords
- graph neural networks, molecular interaction prediction, second-order interactions, skip graphs, drug-drug interactions, drug-target interactions, protein-protein interaction, gene-disease interaction, node embeddings
About these checks
Registry, retraction, Cites and statistics results are computed, not judged, with one exception: a printed reference that no index lists is read once by a model before it counts as a citation error. Claims are extracted by a model and kept only when their quote appears verbatim in the text; each cited source is then checked, with a model’s help, for whether it says what the claim relies on. Those verdicts can be wrong — read the claim’s quote and the cited source before relying on one.
Statistics and arithmetic are recomputed, not judged.
Confidence bands are shown only for fields calibrated on our annotated test set. None is calibrated yet, so no band is shown.
What counts as a claim ›How we measure confidence ›How we check this ›
Are you an author, or do you see a problem with this page? Request a review
