

The DOI matches its Crossref record; 41 of the 43 references it cites were found in a registry or an index.
COVID-19 diagnosis by routine blood tests using machine learning
Open accessAbstract
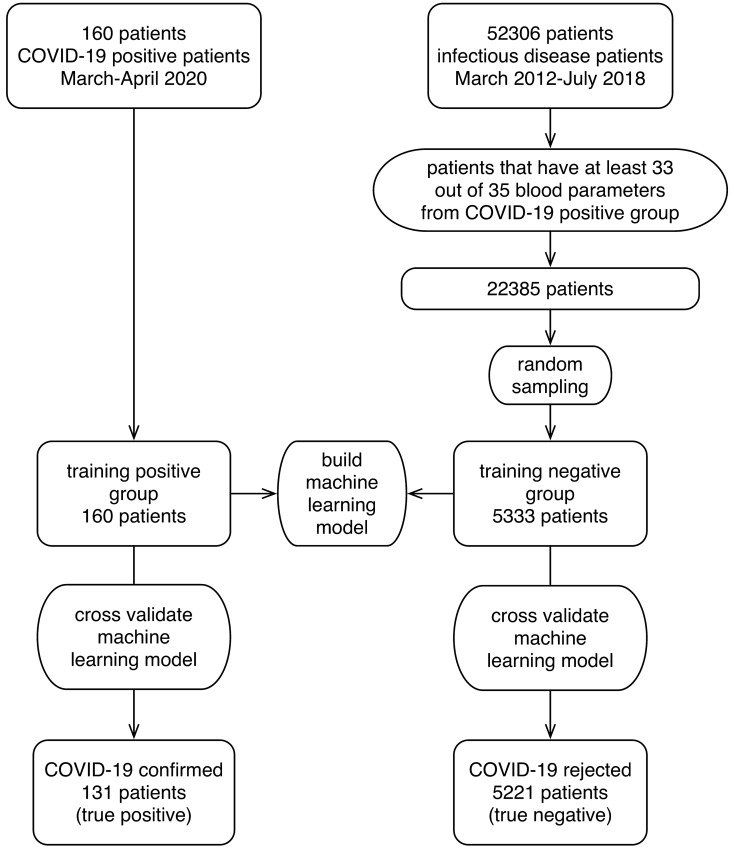
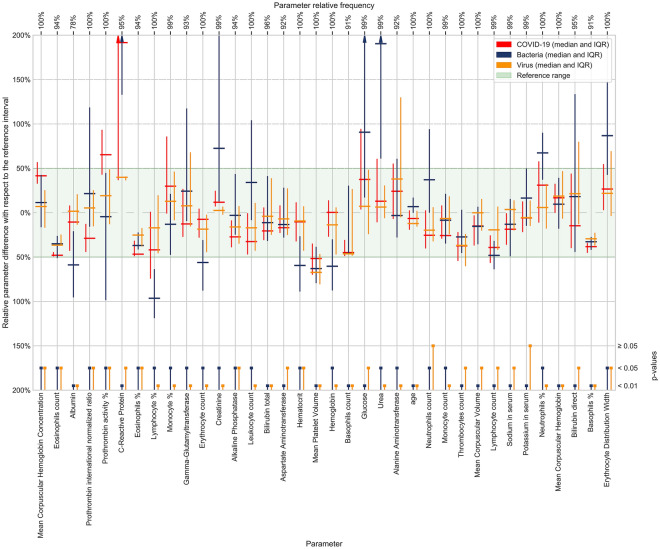
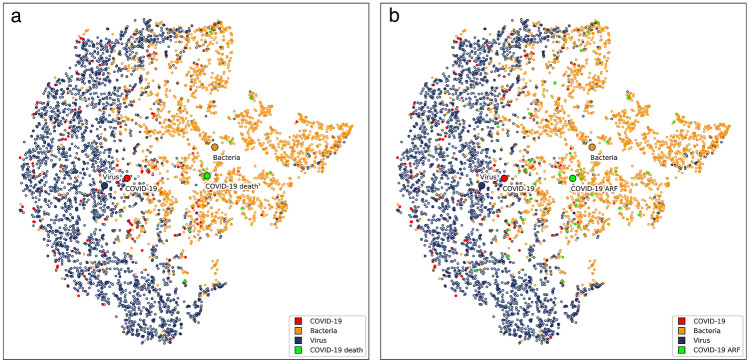
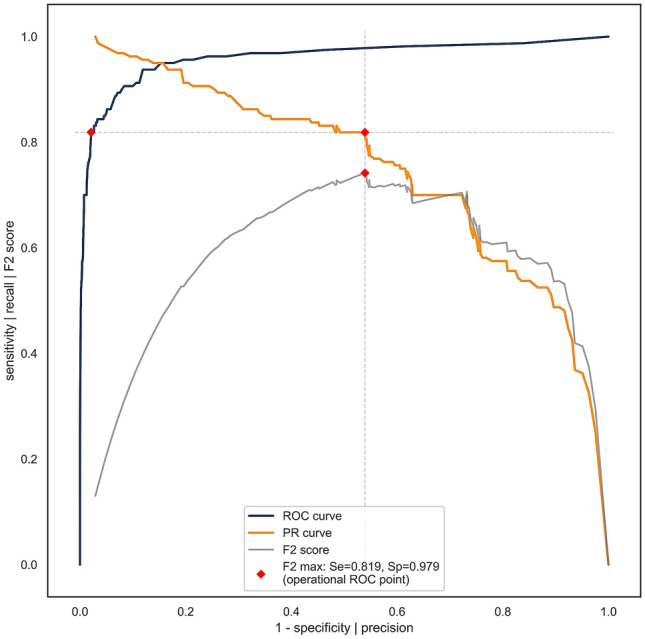
Physicians taking care of patients with COVID-19 have described different changes in routine blood parameters. However, these changes hinder them from performing COVID-19 diagnoses. We constructed a machine learning model for COVID-19 diagnosis that was based and cross-validated on the routine blood tests of 5333 patients with various bacterial and viral infections, and 160 COVID-19-positive patients. We selected the operational ROC point at a sensitivity of 81.9% and a specificity of 97.9%. The cross-validated AUC was 0.97. The five most useful routine blood parameters for COVID-19 diagnosis according to the feature importance scoring of the XGBoost algorithm were: MCHC, eosinophil count, albumin, INR, and prothrombin activity percentage. t-SNE visualization showed that the blood parameters of the patients with a severe COVID-19 course are more like the parameters of a bacterial than a viral infection. The reported diagnostic accuracy is at least comparable and probably complementary to RT-PCR and chest CT studies. Patients with fever, cough, myalgia, and other symptoms can now have initial routine blood tests assessed by our diagnostic tool. All patients with a positive COVID-19 prediction would then undergo standard RT-PCR studies to confirm the diagnosis. We believe that our results represent a significant contribution to improvements in COVID-19 diagnosis.
Overview
The claims and statistics of this paper haven’t been checked yet.
Run the check — free, no account needed. It reads the open-access text and checks the sources it cites.
Integrity signals
Registry
Cites
Statistics
Figures
Verification
Claims the paper makes
The claims and statistics of this paper haven’t been checked yet.
Run the check — free, no account needed. It reads the open-access text and checks the sources it cites.
Claims other papers make about this one
Each is checked against this paper’s own text: does it say what the citing paper says it does?
The cited source says what the claim attributes to it.
In the citing paper
“However, owing to limited specificity of individual predictors, artificial intelligence approaches applied to richer predictor sets are necessary to achieve clinically-acceptable performance.21”
Self-check
Percentages, sums and reported differences re-computed from the paper’s own numbers.
The self-check needs the paper’s full text.
Citations
Cites
XGBoost: A Scalable Tree Boosting System
Chen, T., & Guestrin, C. (2016) · Proceedings of the 22nd ACM SIGKDD International Conference on Knowledge Discovery and Data Mining · doi:10.1145/2939672.2939785 · Cited by 54,569
Clinical features of patients infected with 2019 novel coronavirus in Wuhan, China
Huang, C., Wang, Y., Li, X., Ren, L., Zhao, J., Hu, Y., Zhang, L., Fan, G., Xu, J., Gu, X., et al. (2020) · The Lancet · doi:10.1016/s0140-6736(20)30183-5 · Cited by 48,884
(2008) · Journal of Machine Learning Research · Cited by 33,051
SMOTE synthetic minority over-sampling technique
Chawla, N. V., Bowyer, K. W., Hall, L. O., & Kegelmeyer, W. P. (2002) · Journal of Artificial Intelligence Research · doi:10.1613/jair.953 · Cited by 32,865
Greedy function approximation: A gradient boosting machine
Friedman, J. H. (2001) · The Annals of Statistics · doi:10.1214/aos/1013203451 · Cited by 30,731
Clinical characteristics of coronavirus disease 2019 in China
Guan, W.-J., Ni, Z.-Y., Hu, Y., Liang, W.-H., Ou, C.-Q., He, J.-X., Liu, L., Shan, H., Lei, C.-L., Hui, D. S. C., et al. (2020) · New England Journal of Medicine · doi:10.1056/nejmoa2002032 · Cited by 30,246
A novel coronavirus from patients with pneumonia in China, 2019
Zhu, N., Zhang, D., Wang, W., Li, X., Yang, B., Song, J., Zhao, X., Huang, B., Shi, W., Lu, R., et al. (2020) · New England Journal of Medicine · doi:10.1056/nejmoa2001017 · Cited by 28,244
Gorbalenya, A. E., Baker, S. C., Baric, R. S., de Groot, R. J., Drosten, C., Gulyaeva, A. A., Haagmans, B. L., Lauber, C., Leontovich, A. M., Neuman, B. W., et al. (2020) · Nature Microbiology · doi:10.1038/s41564-020-0695-z · Cited by 8,745
Detection of 2019 novel coronavirus (2019-nCoV) by real-time RT-PCR
Corman, V. M., Landt, O., Kaiser, M., Molenkamp, R., Meijer, A., Chu, D. K. W., Bleicker, T., Brünink, S., Schneider, J. A., Schmidt, M. L., et al. (2020) · Eurosurveillance · doi:10.2807/1560-7917.es.2020.25.3.2000045 · Cited by 7,266
Friedman, J. H. (2002) · Computational Statistics & Data Analysis · doi:10.1016/s0167-9473(01)00065-2 · Cited by 7,067
Research works printed but not linked: 2
- Nielsen, D. Tree boosting with XGBoost – why does XGBoost win “every” machine learning competition? [Master’s thesis] (Norwegian University of Science and Technology, 2016).
- Flach, P., Hernández-Orallo, J. & Ferri, C. A coherent interpretation of AUC as a measure of aggregated classification performance. In The 28th International Conference on Machine Learning, ICML’11 (eds Getoor, L. & Scheffer, T.) 657–664 (Omnipress, 2011).
Cited by
Sorted by citations
Machine learning approaches in COVID-19 diagnosis, mortality, and severity risk prediction: A review
Alballa, N., & Al-Turaiki, I. M. (2021) · Informatics in Medicine Unlocked · doi:10.1016/j.imu.2021.100564 · Cited by 232
Applications of artificial intelligence in battling against covid-19: A literature review
Tayarani N., M.-H. (2021) · Chaos, Solitons & Fractals · doi:10.1016/j.chaos.2020.110338 · Cited by 210
Cabitza, F., Campagner, A., Ferrari, D., Resta, C. D., Ceriotti, D., Sabetta, E., Colombini, A., Vecchi, E. D., Banfi, G., Locatelli, M., et al. (2020) · Clinical Chemistry and Laboratory Medicine (CCLM) · doi:10.1515/cclm-2020-1294 · Cited by 174
Time series prediction of COVID-19 transmission in America using LSTM and XGBoost algorithms
Luo, J., Zhang, Z.-L., Fu, Y., & Rao, F. (2021) · Results in Physics · doi:10.1016/j.rinp.2021.104462 · Cited by 167
Ensemble learning model for diagnosing COVID-19 from routine blood tests
AlJame, M., Ahmad, I., Imtiaz, A., & Mohammed, A. (2020) · Informatics in Medicine Unlocked · doi:10.1016/j.imu.2020.100449 · Cited by 153
Nwanosike, E. M., Conway, B. R., Merchant, H. A., & Hasan, S. S. (2021) · International Journal of Medical Informatics · doi:10.1016/j.ijmedinf.2021.104679 · Cited by 152
Alves, M. A., de Castro, G. Z., Oliveira, B. A. S., Ferreira, L. A., Ramírez, J. A., Silva, R., & Guimarães, F. G. (2021) · Computers in Biology and Medicine · doi:10.1016/j.compbiomed.2021.104335 · Cited by 111
Methodology-Centered Review of Molecular Modeling, Simulation, and Prediction of SARS-CoV-2
Gao, K., Wang, R., Chen, J., Cheng, L., Frishcosy, J., Huzumi, Y., Qiu, Y., Schluckbier, T., Wei, X., & Wei, G. (2022) · Chemical Reviews · doi:10.1021/acs.chemrev.1c00965 · Cited by 93
Automatic COVID-19 prediction using explainable machine learning techniques
Solayman, S., Aumi, S. A., Mery, C. S., Mubassir, M., & Khan, R. (2023) · International Journal of Cognitive Computing in Engineering · doi:10.1016/j.ijcce.2023.01.003 · Cited by 82
Cai, J., Li, Y., Liu, B., Wu, Z., Zhu, S., Chen, Q., Lei, Q., Hou, H., Guo, Z., Jiang, H., et al. (2024) · IEEE Journal of Biomedical and Health Informatics · doi:10.1109/jbhi.2024.3384333 · Cited by 78
COVID-19 Detection Empowered with Machine Learning and Deep Learning Techniques: A Systematic Review
Rehman, A., Iqbal, M. A., Xing, H., & Ahmed, I. (2021) · Applied Sciences · doi:10.3390/app11083414 · Cited by 75
Mansour, N. A., Saleh, A. I., Badawy, M., & Ali, H. A. (2021) · Journal of Ambient Intelligence and Humanized Computing · doi:10.1007/s12652-020-02883-2 · Cited by 66
Application of artificial intelligence in COVID-19 medical area: a systematic review
Chang, Z., Zhan, Z., Zhao, Z., You, Z., Liu, Y., Yan, Z., Fu, Y., Liang, W., & Zhao, L. (2021) · Journal of Thoracic Disease · doi:10.21037/jtd-21-747 · Cited by 64
Clinical and Laboratory Approach to Diagnose COVID-19 Using Machine Learning
Chadaga, K., Chakraborty, C., Prabhu, S., Umakanth, S., Vivekananda Bhat, K., & Sampathila, N. (2022) · Interdisciplinary Sciences Computational Life Sciences · doi:10.1007/s12539-021-00499-4 · Cited by 58
A novel explainable COVID-19 diagnosis method by integration of feature selection with random forest
Rostami, M., & Oussalah, M. (2022) · Informatics in Medicine Unlocked · doi:10.1016/j.imu.2022.100941 · Cited by 61
Soltan, A. A. S., Yang, J., Pattanshetty, R., Novak, A., Yang, Y., Rohanian, O., Beer, S., Soltan, M. A., Thickett, D. R., Fairhead, R., et al. (2022) · The Lancet Digital Health · doi:10.1016/s2589-7500(21)00272-7 · Cited by 54
COVID-19 diagnosis from routine blood tests using artificial intelligence techniques
Rikan, S. B., Azar, A. S., Ghafari, A., Bagherzadeh, J., & Pirnejad, H. (2021) · Biomedical Signal Processing and Control · doi:10.1016/j.bspc.2021.103263 · Cited by 53
Soui, M., Mansouri, N., Alhamad, R. I., Kessentini, M., & Ghédira, K. (2021) · Nonlinear Dynamics · doi:10.1007/s11071-021-06504-1 · Cited by 50
Diagnosing COVID-19 using artificial intelligence: a comprehensive review
Khanna, V. V., Chadaga, K., Sampathila, N., Prabhu, S., Chadaga, R., & Umakanth, S. (2022) · Network Modeling Analysis in Health Informatics and Bioinformatics · doi:10.1007/s13721-022-00367-1 · Cited by 52
Velichko, A., Huyut, M. T., Belyaev, M. A., Izotov, Y., & Korzun, D. G. (2022) · Sensors · doi:10.3390/s22207886 · Cited by 48
An Ensemble Learning Model for COVID-19 Detection from Blood Test Samples
Abayomi‐Alli, O., Damaševičius, R., Maskeliūnas, R., & Misra, S. (2022) · Sensors · doi:10.3390/s22062224 · Cited by 52
Baddal, B., Taner, F., & Ozsahin, D. U. (2024) · Diagnostics · doi:10.3390/diagnostics14050484 · Cited by 55
Cheah, B. C. J., Vicente, C. R., & Chan, K. R. (2025) · Viruses · doi:10.3390/v17070882 · Cited by 61
Diagnosis and Prognosis of COVID-19 Disease Using Routine Blood Values and LogNNet Neural Network
Huyut, M. T., & Velichko, A. (2022) · Sensors · doi:10.3390/s22134820 · Cited by 41
An integrated analysis and comparison of serum, saliva and sebum for COVID-19 metabolomics
Spick, M. P., Lewis, H.-M., Frampas, C., Longman, K., Costa, C., Stewart, A., Dunn‐Walters, D. K., Greener, D., Evetts, G., Wilde, M. J., et al. (2022) · Scientific Reports · doi:10.1038/s41598-022-16123-4 · Cited by 41
Paul, S. G., Saha, A., Biswas, A. A., Zulfiker, M. S., Arefin, M. S., Rahman, M. M., & Reza, A. W. (2022) · Array · doi:10.1016/j.array.2022.100271 · Cited by 38
Dairi, A., Harrou, F., & Sun, Y. (2021) · IEEE Transactions on Instrumentation and Measurement · doi:10.1109/tim.2021.3130675 · Cited by 37
Lee, Y., Kim, Y.-S., Lee, D., Jeong, S., Kang, G.-H., Jang, Y. S., Kim, W., Choi, H. Y., Kim, J. G., & Choi, S.-H. (2022) · Scientific Reports · doi:10.1038/s41598-022-05069-2 · Cited by 35
XGBoost-Based Feature Learning Method for Mining COVID-19 Novel Diagnostic Markers
Song, X., Zhu, J., Tan, X., Yu, W., Wang, Q., Shen, D., & Chen, W. (2022) · Frontiers in Public Health · doi:10.3389/fpubh.2022.926069 · Cited by 35
Gürsoy, E., & Kaya, Y. (2023) · Multimedia Systems · doi:10.1007/s00530-023-01083-0 · Cited by 40
Modern Machine-Learning Predictive Models for Diagnosing Infectious Diseases
Alqaissi, E., Alotaibi, F. S., & Ramzan, M. S. (2022) · Computational and Mathematical Methods in Medicine · doi:10.1155/2022/6902321 · Cited by 34
Huyut, M. T., & Huyut, Z. (2023) · Heliyon · doi:10.1016/j.heliyon.2023.e14015 · Cited by 34
Potential of Microneedle Systems for COVID-19 Vaccination: Current Trends and Challenges
Hassan, J., Haigh, C., Ahmed, T., Uddin, M. J., & Das, D. B. (2022) · Pharmaceutics · doi:10.3390/pharmaceutics14051066 · Cited by 36
Predictive models for COVID-19 detection using routine blood tests and machine learning
Kistenev, Y. V., Vrazhnov, D. A., Shnaider, E. E., & Zuhayri, H. (2022) · Heliyon · doi:10.1016/j.heliyon.2022.e11185 · Cited by 33
Du, R., Tsougenis, E., Ho, J. W. K., Chan, J. K. Y., Chiu, K. W.-H., Fang, B., Ng, M., Leung, S. T., Lo, C. S.-Y., Wong, H. Y. F., et al. (2021) · Scientific Reports · doi:10.1038/s41598-021-93719-2 · Cited by 30
External validation of Machine Learning models for COVID-19 detection based on Complete Blood Count
Campagner, A., Carobene, A., & Cabitza, F. (2021) · Health Information Science and Systems · doi:10.1007/s13755-021-00167-3 · Cited by 29
An Overview of Supervised Machine Learning Methods and Data Analysis for COVID-19 Detection
Kouanou, A. T., Attia, T. M., Feudjio, C., Djeumo, A. F., Mouelas, A. N., Nzogang, M. P., Tchapga, C. T., & Tchiotsop, D. (2021) · Journal of Healthcare Engineering · doi:10.1155/2021/4733167 · Cited by 24
Huyut, M. T., Velichko, A., & Belyaev, M. A. (2022) · Applied Sciences · doi:10.3390/app122312180 · Cited by 28
Cobre, A. D. F., Surek, M., Stremel, D. P., Fachi, M. M., Borba, H. H. L., Tonin, F. S., & Pontarolo, R. (2022) · Computers in Biology and Medicine · doi:10.1016/j.compbiomed.2022.105659 · Cited by 25
Jahangirimehr, A., Shahvali, E. A., Rezaeijo, S. M., Khalighi, A., Honarmandpour, A., Honarmandpour, F., Labibzadeh, M., Bahmanyari, N., & Heydarheydari, S. (2022) · Clinical Nutrition ESPEN · doi:10.1016/j.clnesp.2022.07.011 · Cited by 24
Chakraborty, S. (2020) · doi:10.31219/osf.io/usztn · Cited by 23
Dipaola, F., Gatti, M., Levra, A. G., Menè, R., Shiffer, D., Faccincani, R., Raouf, Z., Secchi, A., Rovere, P. Q., Voza, A., et al. (2023) · Scientific Reports · doi:10.1038/s41598-023-37512-3 · Cited by 22
Classification of COVID-19 by using supervised optimized machine learning technique
Sharma, D. K., Subramanian, M., Malyadri, P., Reddy, B. S., Sharma, M., & Tahreem, M. (2021) · Materials Today Proceedings · doi:10.1016/j.matpr.2021.11.388 · Cited by 22
MALDI-TOF mass spectrometry of saliva samples as a prognostic tool for COVID-19
Lázari, L. C., Zerbinati, R. M., Rosa-Fernandes, L., Santiago, V. F., Rosa, K. F., Angeli, C. B., Schwab, G., Palmieri, M., Sarmento, D. J. D. S., Marinho, C. R. F., et al. (2022) · Journal of Oral Microbiology · doi:10.1080/20002297.2022.2043651 · Cited by 21
Cocoş, R., Mahler, B., Turcu-Ştiolică, A., Stoichiță, A., Ghinet, A., Shelby, E.-S., & Bohîlțea, L. C. (2022) · Viruses · doi:10.3390/v14061201 · Cited by 21
COVID-19 and Artificial Intelligence: An Approach to Forecast the Severity of Diagnosis
Udriștoiu, Ș., Ghenea, A. E., Udriștoiu, Ș., Neaga, M., Zlatian, O. M., Vasile, C. M., Popescu, M., Țieranu, E. N., Salan, A.-I., Turcu, A. A., et al. (2021) · Life · doi:10.3390/life11111281 · Cited by 21
Zgheib, R., Chahbandarian, G., Kamalov, F., Messiry, H. E., & Al-Gindy, A. (2023) · Neurocomputing · doi:10.1016/j.neucom.2023.01.007 · Cited by 21
Hemogram‐based decision tree models for discriminating COVID ‐19 from RSV in infants
Dobrijević, D., Andrijević, L., Antić, J., Rakić, G., & Pastor, K. (2023) · Journal of Clinical Laboratory Analysis · doi:10.1002/jcla.24862 · Cited by 19
Speech as a Biomarker for COVID-19 Detection Using Machine Learning
Usman, M. J., Gunjan, V. K., Wajid, M., Zubair, M., & Siddiquee, K. N. E. A. (2022) · Computational Intelligence and Neuroscience · doi:10.1155/2022/6093613 · Cited by 18
Rehman, A., Xing, H., Khan, M. A., Hussain, M., Hussain, A., & Gulzar, N. (2023) · Biomedical Signal Processing and Control · doi:10.1016/j.bspc.2023.104642 · Cited by 18
MultiCOVID: a multi modal deep learning approach for COVID-19 diagnosis
Hardy-Werbin, M., Maiques, J. M., Busto, M., Cirera, I., Aguirre, A., García-Gisbert, N., Zuccarino, F., Carbullanca, S., Bellido, L. A. D. C., Ramal, D., et al. (2023) · Scientific Reports · doi:10.1038/s41598-023-46126-8 · Cited by 18
Căliman-Sturdza, O. A., Filip, F., Baitan, M. T., & Dimian, M. (2025) · Diagnostics · doi:10.3390/diagnostics15141830 · Cited by 18
Kaur, B. P., Singh, H., Hans, R., Sharma, S. K., Sharma, C., & Hassan, M. M. (2024) · PLoS ONE · doi:10.1371/journal.pone.0308015 · Cited by 15
Dobrijević, D., Antić, J., Rakić, G., Katanić, J., Andrijević, L., & Pastor, K. (2023) · Children · doi:10.3390/children10050761 · Cited by 15
Gunčar, G., Kukar, M., Smole, T., Moškon, S., Vovko, T. D., Podnar, S., Černelč, P., Brvar, M., Notar, M., Koster, M., et al. (2024) · Heliyon · doi:10.1016/j.heliyon.2024.e29372 · Cited by 19
Self-citationMachine learning applications to Covid-19: a state-of-the-art survey
Kamalov, F., Cherukuri, A. K., & Thabtah, F. (2022) · Advances in Science and Engineering Technology International Conferences (ASET) · doi:10.1109/aset53988.2022.9734959 · Cited by 16
Mohanadas, H. P., Manikandan, A., Ismail, A. F., Tucker, N., & Jaganathan, S. K. (2026) · Journal of Medical Internet Research · doi:10.2196/72410 · Cited by 17
Vimala, G. S. A. G., Kesavan, R., Manigandan, E., Latha, S. P., Kumar, B. V., & Padmakala, S. (2023) · International Conference on Automation, Computing and Renewable Systems (ICACRS) · doi:10.1109/icacrs58579.2023.10404938 · Cited by 13
Pal, J. B., Bhattacharyea, A., Banerjee, D., & Maharaj, B. T. (2024) · Expert Systems with Applications · doi:10.1016/j.eswa.2024.123660 · Cited by 15
Viderman, D., Kotov, A., Popov, M., & Abdildin, Y. G. (2023) · International Journal of Medical Informatics · doi:10.1016/j.ijmedinf.2023.105308 · Cited by 14
Towards Applicability of Information Communication Technologies in Automated Disease Detection
Zamani, A. S., Rajput, S., Kaur, H., Dr.A.Meenakshi, D. V. H., Bangare, S. L., & Ray, S. (2022) · INTERNATIONAL JOURNAL OF NEXT-GENERATION COMPUTING · doi:10.47164/ijngc.v13i3.705 · Cited by 12
Selective Electrochemical Detection of SARS-CoV-2 Using Deep Learning
Gecgel, O., Ramanujam, A., & Botte, G. G. (2022) · Viruses · doi:10.3390/v14091930 · Cited by 12
Predicting Influenza A Virus Infection in the Lung from Hematological Data with Machine Learning
Jhutty, S. S., Boehme, J. D., Jeron, A., Volckmar, J., Schultz, K., Schreiber, J., Schughart, K., Zhou, K., Steinheimer, J., Horst Stöcker, B., et al. (2022) · mSystems · doi:10.1128/msystems.00459-22 · Cited by 12
ISW-LM: An intensive symptom weight learning mechanism for early COVID-19 diagnosis
Fang, L., & Liang, X. (2022) · Computers in Biology and Medicine · doi:10.1016/j.compbiomed.2022.105615 · Cited by 11
Artificial intelligence enabled COVID-19 detection: techniques, challenges and use cases
Chahal, M., Reddy, A., Shah, R., & Shah, J. (2023) · Multimedia Tools and Applications · doi:10.1007/s11042-023-15247-7 · Cited by 11
An Explainable System for Diagnosis and Prognosis of COVID-19
Lu, J., Jin, R., Song, E., Alrashoud, M. R., Al-Mutib, K. N., & Al-Rakhami, M. S. (2020) · IEEE Internet of Things Journal · doi:10.1109/jiot.2020.3037915 · Cited by 12
Huyut, M. T., & Velichko, A. (2023) · MethodsX · doi:10.1016/j.mex.2023.102194 · Cited by 10
Stacked deep learning approach for efficient SARS-CoV-2 detection in blood samples
Wang, W., Harrou, F., Dairi, A., & Sun, Y. (2024) · Artificial Intelligence in Medicine · doi:10.1016/j.artmed.2024.102767 · Cited by 10
Anemia detection and classification from blood samples using data analysis and deep learning*
Bahadure, N. B., Khomane, R. B., & Nittala, A. (2024) · Automatika · doi:10.1080/00051144.2024.2352317 · Cited by 10
Individual Factors Associated With COVID-19 Infection: A Machine Learning Study
Ramírez-delReal, T. A., Martínez-García, M., Márquez, M. F., López-Trejo, L., Gutiérrez-Esparza, G. O., & Lemus, E. H. (2022) · Frontiers in Public Health · doi:10.3389/fpubh.2022.912099 · Cited by 11
Marateb, H. R., Nezhad, F. Z., Mohebian, M. R., Sami, R., Javanmard, S. H., Niri, F. D., Savari, M. A., Mansourian, M., Mañanas, M. Á., Wolkewitz, M., et al. (2021) · Frontiers in Medicine · doi:10.3389/fmed.2021.768467 · Cited by 10
Cardozo, G., Tirloni, S. F., Moro, A. R. P., & Marques, J. L. B. (2022) · JMIR Bioinformatics and Biotechnology · doi:10.2196/40473 · Cited by 10
Ballaz, S., Pulgar-Sánchez, M., Chamorro, K., & Fernández-Moreira, E. (2023) · Informatics in Medicine Unlocked · doi:10.1016/j.imu.2023.101312 · Cited by 11
Mann, S., Yadav, D., Muthusamy, S., Rathee, D., & Mishra, O. P. (2023) · Wireless Personal Communications · doi:10.1007/s11277-023-10836-z · Cited by 9
COVID-19 mortality prediction in Hungarian ICU settings implementing random forest algorithm
Hamar, A., Mohammed, D., Váradi, A., Herczeg, R., Balázsfalvi, N., Fülesdi, B., László, I., Gömöri, L., Gergely, P. A., Kovács, G. L., et al. (2024) · Scientific Reports · doi:10.1038/s41598-024-62791-9 · Cited by 9
Neuromorphic chips for biomedical engineering
Wang, K., Ren, S., Jia, Y., Yan, X., Wang, L., & Fan, Y. (2025) · Mechanobiology in Medicine · doi:10.1016/j.mbm.2025.100133 · Cited by 11
Jillahi, K. B., & Iorliam, A. (2024) · Journal of Computing Theories and Applications · doi:10.62411/jcta.10350 · Cited by 9
Equilibrium-based COVID-19 diagnosis from routine blood tests: A sparse deep convolutional model
Altantawy, D. A., & Kishk, S. S. (2022) · Expert Systems with Applications · doi:10.1016/j.eswa.2022.118935 · Cited by 10
Using Artificial Intelligence for COVID-19 Detection in Blood Exams: A Comparative Analysis
Loddo, A., Meloni, G., & Pes, B. (2022) · IEEE Access · doi:10.1109/access.2022.3221750 · Cited by 9
Hu, W., Liu, Y., Dong, J., Peng, X., Yang, C., Wang, H., Chen, Y., Shi, S., & Li, J. (2025) · Journal of Medical Internet Research · doi:10.2196/67847 · Cited by 8
Recent Progress on Wearable Sensor based on Nanocomposite Hydrogel
Xu, K., & Wang, C. (2023) · Current Nanoscience · doi:10.2174/1573413719666230217141149 · Cited by 8
Habashi, S. A., Koyuncu, M., & Alizadehsani, R. (2023) · Diagnostics · doi:10.3390/diagnostics13101749 · Cited by 8
SARS-CoV-2 amyloid, is COVID-19-exacerbated dementia an amyloid disorder in the making?
Milton, N. G. N. (2023) · Frontiers in Dementia · doi:10.3389/frdem.2023.1233340 · Cited by 8
COVIDAL: A Machine Learning Classifier for Digital COVID-19 Diagnosis in German Hospitals
Bartenschlager, C. C., Ebel, S. S., Kling, S., Vehreschild, J. J., Zabel, L. T., Spinner, C. D., Schüler, A., Heller, A. R., Borgmann, S., Hoffmann, R. F. G., et al. (2022) · ACM Transactions on Management Information Systems · doi:10.1145/3567431 · Cited by 8
Predicting SARS-CoV-2 infection among hemodialysis patients using multimodal data
Duan, J., Li, H., Ma, X., Zhang, H., Lasky, R. A., Monaghan, C. K., Chaudhuri, S., Usvyat, L. A., Gu, M., Guo, W., et al. (2023) · Frontiers in Nephrology · doi:10.3389/fneph.2023.1179342 · Cited by 7
Ormeño-Arriagada, P., Márquez, G., Araya, D., Rimassa, C., & Taramasco, C. (2025) · Applied Sciences · doi:10.3390/app15031132 · Cited by 6
Sargiani, V., de Souza, A. A., de Almeida, D. C., Barcelos, T., Muñoz, R., & da Silva, L. A. (2022) · Applied Sciences · doi:10.3390/app12105137 · Cited by 7
Serum N-glycomic profiling may provide potential signatures for surveillance of COVID-19
Xie, Y., & Butler, M. (2022) · Glycobiology · doi:10.1093/glycob/cwac051 · Cited by 7
Kara, A. (2024) · Multimedia Tools and Applications · doi:10.1007/s11042-024-18850-4 · Cited by 6
Kosar, A., Asif, M., Ahmad, M. B., Akram, W., Mahmood, K., & Kumari, S. (2024) · Artificial Intelligence in Medicine · doi:10.1016/j.artmed.2024.102858 · Cited by 8
Cabrera, J. J., Larrañaga, A., Pérez‐Castro, S., Martínez, J. M., Lamas, L. M., Daviña‐Núñez, C., del Campo-Pérez, V., Luque, S. S., Regueiro, B. J., & Fresco, J. P. (2023) · Scientific Reports · doi:10.1038/s41598-023-34882-6 · Cited by 7
Machine Learning-Based Prediction of COVID-19 Prognosis Using Clinical and Hematologic Data
Kamel, F. O., Magadmi, R. M., Qutub, S., Badawi, M. A., Badawi, M., Madani, T. A., Alhothali, A., Abozinadah, E., Bakhshwin, D., Jamal, M., et al. (2023) · Cureus · doi:10.7759/cureus.50212 · Cited by 5
RetractedBosco, M. S., Topçu, Z., Pradhan, S., Sossah, A., Tsatsaris, V., Vauloup‐Fellous, C., Agasti, S. S., Rozenholc, Y., & Gagey‐Eilstein, N. (2024) · Sensors & Diagnostics · doi:10.1039/d4sd00009a · Cited by 5
COVID-19 Outbreak Prediction Analysis using Machine Learning
Bala, S. (2021) · International Journal for Research in Applied Science and Engineering Technology · doi:10.22214/ijraset.2021.32690 · Cited by 5
Artificial Intelligence-Based Predictive Tools for Life-Threatening Diseases
Jeyakumar, V., Sundaram, P., & Ramapathiran, N. (2023) · Signals and communication technology · doi:10.1007/978-3-031-19752-9_8 · Cited by 5
Raihan, M. M. S., Khan, M. M. U., Akter, L., & Shams, A. B. (2021) · arXiv (Cornell University) · Cited by 5
do Prado, A. L., Cobre, A. D. F., Volanski, W., Signorini, L., Valdameri, G., Moure, V. R., Alves, A. C., Rego, F. G. D. M., & Picheth, G. (2025) · COVID · doi:10.3390/covid5100167 · Cited by 4
Sekaran, K., Varghese, R. P., Ramanathan, G., Karthik, G., Ramya, I., & Doss, C. G. P. (2022) · Cell Biochemistry and Function · doi:10.1002/cbf.3769 · Cited by 4
Ovcharenko, E. A., Кутихин, А. Г., Gruzdeva, O. V., Kuzmina, A. A., Александровна, С. Т., Брусина, Е. Б., Владимировна, К. С., Евгеньевна, Б. Т., Kuzmenko, S., Osyaev, N. Y., et al. (2023) · Journal of Cardiovascular Development and Disease · doi:10.3390/jcdd10020039 · Cited by 4
Metadata
- Authors
- Kukar, M., Gunčar, G., Vovko, T., Podnar, S., Černelč, P., Brvar, M., Zalaznik, M., Notar, M., Moškon, S., & Notar, M.
- Affiliations
- University of Ljubljana (SI)
- Ljubljana University Medical Centre (SI)
- Corresponding author
- Notar, Mateja
- Notar, Marko
- Venue
- Scientific Reports
- Published
- 2021-05-24
- Volume
- 11
- Issue
- 1
- Pages
- 10738-10738
- ISSN
- 2045-2322 (ISSN-L)
- PMC
- PMC8144373
- OpenAlex
- W3033612360
- Cited by
- 179
- References
- 43
- Citations by year
- 2026: 7 · 2025: 18 · 2024: 25 · 2023: 47 · 2022: 50 · 2021: 27
- FWCI
- 11.80
- Type
- journal article
- Language
- en
- Open access
- gold
- doi.org
- Locations
- Scientific Reports (publishedVersion, cc-by)
- PubMed Central (publishedVersion, cc-by)
- PubMed (publishedVersion)
- arXiv (Cornell University) (submittedVersion)
- DOAJ (DOAJ: Directory of Open Access Journals) (submittedVersion, cc-by-sa)
- arXiv (Cornell University)
- Funders
- Smart Blood Analytics Swiss SA
- Topics
- Health Sciences › Medicine › Infectious Diseases › COVID-19 Clinical Research Studies
- Health Sciences › Medicine › Radiology, Nuclear Medicine and Imaging › COVID-19 diagnosis using AI
- Health Sciences › Medicine › Infectious Diseases › SARS-CoV-2 detection and testing
- Keywords
- COVID-19 diagnosis, routine blood tests, machine learning, XGBoost, feature importance, mean corpuscular hemoglobin concentration, eosinophil count, albumin, international normalized ratio, prothrombin activity, t-SNE visualization, diagnostic accuracy
- MeSH terms
- Machine Learning, COVID-19, SARS-CoV-2, Aged, Eosinophils, Female, Hematologic Tests, Humans, Male, Prothrombin, ROC Curve, Sensitivity and Specificity, Serum Albumin, Severity of Illness Index, Thorax, Tomography, X-Ray Computed, Biomarkers, Area Under Curve
About these checks
Registry, retraction, Cites and statistics results are computed, not judged, with one exception: a printed reference that no index lists is read once by a model before it counts as a citation error. Claims are extracted by a model and kept only when their quote appears verbatim in the text; each cited source is then checked, with a model’s help, for whether it says what the claim relies on. Those verdicts can be wrong — read the claim’s quote and the cited source before relying on one.
Statistics and arithmetic are recomputed, not judged.
Confidence bands are shown only for fields calibrated on our annotated test set. None is calibrated yet, so no band is shown.
What counts as a claim ›How we measure confidence ›How we check this ›
Are you an author, or do you see a problem with this page? Request a review
