Student or educator? Sign up with your school email and get 6 months of Pro free.
CoChat

The DOI matches its Crossref record; 47 of the 47 references it cites were found in a registry or an index.

Hippocampus-retrosplenial cortex interaction is increased during phasic REM and contributes to memory consolidation

Open access
de Almeida-Filho, Daniel Gomes, Koike, Bruna Del Vechio, Billwiller, Francesca, Farias, Kelly Soares, de Sales, Igor Rafael Praxedes, Luppi, Pierre-Hervé, Ribeiro, Sidarta, Queiroz, Claudio Marcos · 2021 · Scientific Reports

Abstract

Hippocampal (HPC) theta oscillation during post-training rapid eye movement (REM) sleep supports spatial learning. Theta also modulates neuronal and oscillatory activity in the retrosplenial cortex (RSC) during REM sleep. To investigate the relevance of theta-driven interaction between these two regions to memory consolidation, we computed the Granger causality within theta range on electrophysiological data recorded in freely behaving rats during REM sleep, both before and after contextual fear conditioning. We found a training-induced modulation of causality between HPC and RSC that was correlated with memory retrieval 24 h later. Retrieval was proportional to the change in the relative influence RSC exerted upon HPC theta oscillation. Importantly, causality peaked during theta acceleration, in synchrony with phasic REM sleep. Altogether, these results support a role for phasic REM sleep in hippocampo-cortical memory consolidation and suggest that causality modulation between RSC and HPC during REM sleep plays a functional role in that phenomenon.

Overview

The claims and statistics of this paper haven’t been checked yet.

Free: it reads the open-access text and checks the first 5 claims that cite a source we can check. Create a free account to check every claim.

A few free checks a day · papers already verified open instantly · results are public

Integrity signals

Registry

Crossref · 10.1038/s41598-021-91659-5

Cites

47 of 47 references verified0 citation errors · 0 not checkable

Statistics

Figures

Figure 1 Experimental protocol and sleep architecture. (a) Experimental design and results. Animals (N = 13) were implanted with matrices of single wires into the hippocampus (HPC) and the retrosplenial cortex (RSC), and recorded 3 h before (pre) and after (post) a contextual fear conditioning protocol (CFC). During training, seven animals underwent standard CFC (shock group), whereas six (sham group) underwent the same experimental steps, except for the foot-shocks during training. Both groups were tested for CFC 24 h after training. Inset: The shock group shows significant fear behavior compared to before training and to the sham group. Average freezing across animals for each group during testing (sham n = 6: training vs test, p = 0.63 and shock n = 7: training vs test, p = 0.02; Wilcoxon signed rank test. Testing: sham n = 6 vs shock n = 7: p = 0.001; Wilcoxon rank-sum test). (b) Sleep architecture throughout pre and post recordings averaged across animals and spanning 4 behavioral states: wake (WK), slow wave sleep (SWS), intermediate sleep (IS), and rapid eye movement (REM) sleep. Data expressed as the percentage (%) of each state per 30 s epochs, 15 s overlap. As expected, animals from the shock group remained awake for the majority of time during the first hours after fear training (time awake during post; 1st: 83.8 ± 2.8%, 2nd: 49.2 ± 9.2%, and 3rd hour: 37.3 ± 7.7%), although the exposure to novelty without foot-shock elicited a similar trend in the sham group (1st: 72.6 ± 7.1%, 2nd: 55.2 ± 8.4%, and 3rd hour: 42.3 ± 10.9%). (c) REM sleep is not significantly reduced after training. Percentage of REM sleep within each period (pre or post) for groups sham (top) and shock (bottom) (pre × post: sham n = 6, p = 0.15; shock n = 7: p = 0.58; Wilcoxon signed rank test). *p < 0.05. Graphs show mean ± SEM (lines/bars ± shades/lines).
Figure 1 Experimental protocol and sleep architecture. (a) Experimental design and results. Animals (N = 13) were implanted with matrices of single wires into the hippocampus (HPC) and the retrosplenial cortex (RSC), and recorded 3 h before (pre) and after (post) a contextual fear conditioning protocol (CFC). During training, seven animals underwent standard CFC (shock group), whereas six (sham group) underwent the same experimental steps, except for the foot-shocks during training. Both groups were tested for CFC 24 h after training. Inset: The shock group shows significant fear behavior compared to before training and to the sham group. Average freezing across animals for each group during testing (sham n = 6: training vs test, p = 0.63 and shock n = 7: training vs test, p = 0.02; Wilcoxon signed rank test. Testing: sham n = 6 vs shock n = 7: p = 0.001; Wilcoxon rank-sum test). (b) Sleep architecture throughout pre and post recordings averaged across animals and spanning 4 behavioral states: wake (WK), slow wave sleep (SWS), intermediate sleep (IS), and rapid eye movement (REM) sleep. Data expressed as the percentage (%) of each state per 30 s epochs, 15 s overlap. As expected, animals from the shock group remained awake for the majority of time during the first hours after fear training (time awake during post; 1st: 83.8 ± 2.8%, 2nd: 49.2 ± 9.2%, and 3rd hour: 37.3 ± 7.7%), although the exposure to novelty without foot-shock elicited a similar trend in the sham group (1st: 72.6 ± 7.1%, 2nd: 55.2 ± 8.4%, and 3rd hour: 42.3 ± 10.9%). (c) REM sleep is not significantly reduced after training. Percentage of REM sleep within each period (pre or post) for groups sham (top) and shock (bottom) (pre × post: sham n = 6, p = 0.15; shock n = 7: p = 0.58; Wilcoxon signed rank test). *p < 0.05. Graphs show mean ± SEM (lines/bars ± shades/lines).CC BY · PubMed Central
Figure 2 Change in Granger causality (GC) estimates during REM sleep is related to fear memory expression. GC between HPC and RSC channels of rats from sham (a) and shock (b) groups during REM sleep pre- and post-CFC training. Data plotted in the frequency domain ranging from 3 to 12 Hz. Grey shade, theta range (5–10 Hz). (c,d) Relative RSC GC (rRSCGC) during REM sleep from pre to post periods. Data points are the difference on GC peak values within theta band between the RSC → HPC and HPC → RSC directions (i.e., rRSCGC = RSC → HPC—HPC → RSC). Black dashed line: no dominance/threshold for dominance inversion. Note that most of the animals show HPC dominance over RSC theta oscillation during pre for both sham (c) and shock (d) groups. Numbers represent animals from the shock group sorted from the highest to the lowest freezing during testing (# 1 to # 7). (e) Change in rRSCGC in the shock group (data points from d) from pre to post, defined as ∆rRSCGC, is positively correlated with freezing behavior assessed 24 h after CFC training (n = 7; R2 = 0.71; ρ = 0.93, p = 0.007; Spearman correlation). Data points represent the modulation of the strength of RSC → HPC dominance over the HPC → RSC direction from before to after training (post–pre) for individual rats (see “Methods”). Pink and purple represent sham and shock groups, respectively. Purple line: least-squares linear regression for the shock group data points. Graphs show mean ± SEM (lines ± shades).
Figure 2 Change in Granger causality (GC) estimates during REM sleep is related to fear memory expression. GC between HPC and RSC channels of rats from sham (a) and shock (b) groups during REM sleep pre- and post-CFC training. Data plotted in the frequency domain ranging from 3 to 12 Hz. Grey shade, theta range (5–10 Hz). (c,d) Relative RSC GC (rRSCGC) during REM sleep from pre to post periods. Data points are the difference on GC peak values within theta band between the RSC → HPC and HPC → RSC directions (i.e., rRSCGC = RSC → HPC—HPC → RSC). Black dashed line: no dominance/threshold for dominance inversion. Note that most of the animals show HPC dominance over RSC theta oscillation during pre for both sham (c) and shock (d) groups. Numbers represent animals from the shock group sorted from the highest to the lowest freezing during testing (# 1 to # 7). (e) Change in rRSCGC in the shock group (data points from d) from pre to post, defined as ∆rRSCGC, is positively correlated with freezing behavior assessed 24 h after CFC training (n = 7; R2 = 0.71; ρ = 0.93, p = 0.007; Spearman correlation). Data points represent the modulation of the strength of RSC → HPC dominance over the HPC → RSC direction from before to after training (post–pre) for individual rats (see “Methods”). Pink and purple represent sham and shock groups, respectively. Purple line: least-squares linear regression for the shock group data points. Graphs show mean ± SEM (lines ± shades).CC BY · PubMed Central
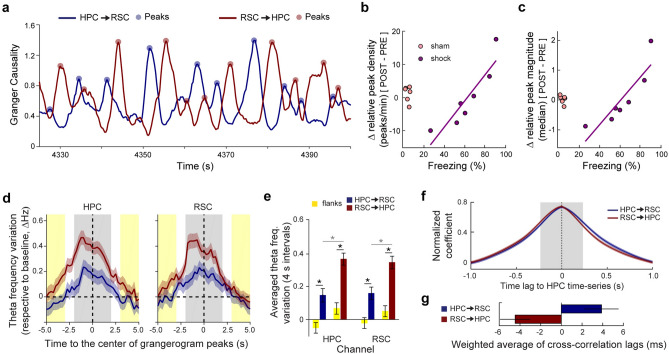
Figure 3 Grangerogram peaks are informative about memory retrieval and are related to theta transient acceleration. (a) Smoothed (2-s rectangular kernel) maximum GC values within theta range (grangerogram) during exemplary REM sleep epoch. (b,c) The changes in relative grangerogram peak density (b) and magnitude (c) in the shock group from pre to post are positively correlated with freezing behavior during testing (density, n = 7: R2 = 0.82, ρ = 0.96, p = 0.003; and magnitude, n = 7: R2 = 0.77, ρ = 0.96, p = 0.003; Spearman correlation). Data points calculated as in Fig. 2e (see “Methods”). Purple line, least-squares linear regression for the shock group. (d) Average theta frequency variation across animals/periods in the HPC and RSC channels within time windows centered at grangerogram peaks (4 s, grey shadow). Yellow shadow, 4-s window (2-s each side) used as controls (flanks). (e) Theta frequency increases close to grangerogram peaks in the HPC and RSC channels (peaks n = 260 vs flanks n = 260. HPC channel: HPC → RSC: t(259) = − 4.6, p = 0; RSC → HPC: t(259) = − 6.6, p = 0. RSC channel: HPC → RSC: t(259) = − 4.3, p = 0; RSC → HPC: t(259) = − 6.7, p = 0), and is even higher in the vicinity of RSC → HPC compared to HPC → RSC peaks (RSC → HPC n = 260 vs HPC → RSC n = 260; HPC channel: t(518) = − 3.9, p = 0. RSC channel: t(518) = − 3.3, p = 10–4). (f) Average cross-correlation functions between HPC and RSC instantaneous theta frequency in the vicinity of grangerogram peaks (Supplementary Fig. S7a–e). Grey shadow, window that maximizes the difference between directions (± 234 ms; Supplementary Fig. S7h). (g) The weighted average of cross-correlation functions in (f) shows that the precedence of theta acceleration between regions is dependent on grangerogram direction (HPC → RSC: + 3.9 ± 1.6 ms and RSC → HPC: − 4.5 ± 1.4 ms respective to HPC; HPC → RSC, n = 238; RSC → HPC, n = 239, outliers excluded if outside Mean ± 2 × STD, t(473) = 3.8, p = 10–4; see “Methods” and Supplementary Fig. S7f,g). *p < 0.05. Graphs show mean ± SEM (lines/bars ± shades/lines). Spearman correlation in (b,c). paired t test in [(e), comparison with flanks]. unpaired t test in [(e, between directions) and (g)].
Figure 3 Grangerogram peaks are informative about memory retrieval and are related to theta transient acceleration. (a) Smoothed (2-s rectangular kernel) maximum GC values within theta range (grangerogram) during exemplary REM sleep epoch. (b,c) The changes in relative grangerogram peak density (b) and magnitude (c) in the shock group from pre to post are positively correlated with freezing behavior during testing (density, n = 7: R2 = 0.82, ρ = 0.96, p = 0.003; and magnitude, n = 7: R2 = 0.77, ρ = 0.96, p = 0.003; Spearman correlation). Data points calculated as in Fig. 2e (see “Methods”). Purple line, least-squares linear regression for the shock group. (d) Average theta frequency variation across animals/periods in the HPC and RSC channels within time windows centered at grangerogram peaks (4 s, grey shadow). Yellow shadow, 4-s window (2-s each side) used as controls (flanks). (e) Theta frequency increases close to grangerogram peaks in the HPC and RSC channels (peaks n = 260 vs flanks n = 260. HPC channel: HPC → RSC: t(259) = − 4.6, p = 0; RSC → HPC: t(259) = − 6.6, p = 0. RSC channel: HPC → RSC: t(259) = − 4.3, p = 0; RSC → HPC: t(259) = − 6.7, p = 0), and is even higher in the vicinity of RSC → HPC compared to HPC → RSC peaks (RSC → HPC n = 260 vs HPC → RSC n = 260; HPC channel: t(518) = − 3.9, p = 0. RSC channel: t(518) = − 3.3, p = 10–4). (f) Average cross-correlation functions between HPC and RSC instantaneous theta frequency in the vicinity of grangerogram peaks (Supplementary Fig. S7a–e). Grey shadow, window that maximizes the difference between directions (± 234 ms; Supplementary Fig. S7h). (g) The weighted average of cross-correlation functions in (f) shows that the precedence of theta acceleration between regions is dependent on grangerogram direction (HPC → RSC: + 3.9 ± 1.6 ms and RSC → HPC: − 4.5 ± 1.4 ms respective to HPC; HPC → RSC, n = 238; RSC → HPC, n = 239, outliers excluded if outside Mean ± 2 × STD, t(473) = 3.8, p = 10–4; see “Methods” and Supplementary Fig. S7f,g). *p < 0.05. Graphs show mean ± SEM (lines/bars ± shades/lines). Spearman correlation in (b,c). paired t test in [(e), comparison with flanks]. unpaired t test in [(e, between directions) and (g)].CC BY · PubMed Central
Figure 4 Phasic REM events are related to transient modulation of granger causality. (a) Phasic REM (phREM) events in relation to the simultaneous grangerogram time series and HPC spectrogram. Top, HPC LFP raw trace in black, phREM events in red. Insets, zoom in (3-s window) on representative phREM events in which the RSC leads HPC theta (left) and HPC leads RSC theta (right). Grey dashed lines highlight insets across all plots. Middle, grangerogram time series and their selected peaks (dots). Bottom, HPC spectrogram showing the characteristic transient theta acceleration related to phREM events. White arrow, exemplary transient theta acceleration synchronous with a grangerogram peak, which was not detected as a phREM event. (b,c) No difference was found in phREM mean density among groups or periods (Sham, n = 6, Shock, n = 7; pre vs post: sham, p = 0.56; shock, p = 0.94. sham vs shock: pre, p = 0.29; post, p = 0.36; (b) or duration (Sham, n = 6, Shock, n = 7; pre vs post: sham, p = 0.32; shock, p = 0.68. sham vs shock: pre, p = 0.62; post, p = 0.52; (c). (d) Grangerograms centered at phREM events, normalized by phREM length (x-axis), by each respective baseline grangerogram (y-axis), and averaged across groups/periods. Plot shows the difference in GC modulation between the directions with highest and the lowest values (see “Methods”). Black dashed lines: vertical, center of phREM events; horizontal, baseline. (e) The GC averaged across one phREM unit (d, grey shadow) is significantly upmodulated in the highest direction and downmodulated in the lowest direction as compared with controls centered at random data points (n = 396/group. Highest: phREM × control, t(790) = 10.8, p = 10–25; Lowest: phREM × control, t(790) = − 4.0, p = 10–5; unpaired t test). Black dashed line, baseline. (f) The likelihood that the HPC will lead the RSC theta oscillation due to phREM-dependent GC upmodulation shows a trend to be higher than the opposite direction for both groups, although only reaching significance for the sham group (Sham, n = 6, Shock, n = 7; HPC → RSC vs RSC → HPC: pre-sham, p = 0.04; pre-shock, p = 0.23; post-sham, p = 0.006; post-shock, p = 0.87; Wilcoxon signed rank test). No significant differences was found between groups, except in the RSC → HPC direction during post, in which the probability of group shock is higher than sham (Sham, n = 6, Shock, n = 7; sham vs shock: HPC → RSC-pre, p = 0.26; RSC → HPC-pre, p = 0.90; HPC → RSC-post, p = 0.63; RSC → HPC-post, p = 0.04; Wilcoxon rank-sum test). *p < 0.05. Graphs show mean ± SEM (lines/bars ± shades/lines).
Figure 4 Phasic REM events are related to transient modulation of granger causality. (a) Phasic REM (phREM) events in relation to the simultaneous grangerogram time series and HPC spectrogram. Top, HPC LFP raw trace in black, phREM events in red. Insets, zoom in (3-s window) on representative phREM events in which the RSC leads HPC theta (left) and HPC leads RSC theta (right). Grey dashed lines highlight insets across all plots. Middle, grangerogram time series and their selected peaks (dots). Bottom, HPC spectrogram showing the characteristic transient theta acceleration related to phREM events. White arrow, exemplary transient theta acceleration synchronous with a grangerogram peak, which was not detected as a phREM event. (b,c) No difference was found in phREM mean density among groups or periods (Sham, n = 6, Shock, n = 7; pre vs post: sham, p = 0.56; shock, p = 0.94. sham vs shock: pre, p = 0.29; post, p = 0.36; (b) or duration (Sham, n = 6, Shock, n = 7; pre vs post: sham, p = 0.32; shock, p = 0.68. sham vs shock: pre, p = 0.62; post, p = 0.52; (c). (d) Grangerograms centered at phREM events, normalized by phREM length (x-axis), by each respective baseline grangerogram (y-axis), and averaged across groups/periods. Plot shows the difference in GC modulation between the directions with highest and the lowest values (see “Methods”). Black dashed lines: vertical, center of phREM events; horizontal, baseline. (e) The GC averaged across one phREM unit (d, grey shadow) is significantly upmodulated in the highest direction and downmodulated in the lowest direction as compared with controls centered at random data points (n = 396/group. Highest: phREM × control, t(790) = 10.8, p = 10–25; Lowest: phREM × control, t(790) = − 4.0, p = 10–5; unpaired t test). Black dashed line, baseline. (f) The likelihood that the HPC will lead the RSC theta oscillation due to phREM-dependent GC upmodulation shows a trend to be higher than the opposite direction for both groups, although only reaching significance for the sham group (Sham, n = 6, Shock, n = 7; HPC → RSC vs RSC → HPC: pre-sham, p = 0.04; pre-shock, p = 0.23; post-sham, p = 0.006; post-shock, p = 0.87; Wilcoxon signed rank test). No significant differences was found between groups, except in the RSC → HPC direction during post, in which the probability of group shock is higher than sham (Sham, n = 6, Shock, n = 7; sham vs shock: HPC → RSC-pre, p = 0.26; RSC → HPC-pre, p = 0.90; HPC → RSC-post, p = 0.63; RSC → HPC-post, p = 0.04; Wilcoxon rank-sum test). *p < 0.05. Graphs show mean ± SEM (lines/bars ± shades/lines).CC BY · PubMed Central

Verification

Claims the paper makes

The claims and statistics of this paper haven’t been checked yet.

Free: it reads the open-access text and checks the first 5 claims that cite a source we can check. Create a free account to check every claim.

A few free checks a day · papers already verified open instantly · results are public

Claims other papers make about this one

Each is checked against this paper’s own text: does it say what the citing paper says it does?

Self-check

Percentages, sums and reported differences re-computed from the paper’s own numbers.

The self-check needs the paper’s full text.

Citations

Cites

Show all 47 references

Cited by

See all 62

Metadata

Authors
de Almeida-Filho, D. G., Koike, B. D. V., Billwiller, F., Farias, K. S., de Sales, I. R. P., Luppi, P.-H., Ribeiro, S., & Queiroz, C. M.
Affiliations
  • Lyon 1 Université (FR)
  • Universidade Federal do Rio Grande do Norte (BR)
Corresponding author
  • Ribeiro, Sidarta
  • Queiroz, Claudio Marcos
Venue
Scientific Reports
Published
2021-06-22
Volume
11
Issue
1
Pages
13078-13078
ISSN
2045-2322 (ISSN-L)
OpenAlex
W3174547852
Cited by
56
References
47
Citations by year
2026: 14 · 2025: 12 · 2024: 10 · 2023: 10 · 2022: 8 · 2021: 2
FWCI
3.95
Type
journal article
Language
en
Open access
Licence
Locations
  • Scientific Reports (publishedVersion, cc-by)
  • PubMed Central (publishedVersion, cc-by)
  • PubMed (publishedVersion)
  • LA Referencia (Red Federada de Repositorios Institucionales de Publicaciones Científicas) (publishedVersion, cc-by)
  • HAL (submittedVersion, cc-by)
  • DOAJ (DOAJ: Directory of Open Access Journals) (submittedVersion, cc-by-sa)
  • LA Referencia (Red Federada de Repositorios Institucionales de Publicaciones Científicas) (submittedVersion, cc-by)
Funders
  • Coordenação de Aperfeiçoamento de Pessoal de Nível Superior (783/13)
  • Centre National de la Recherche Scientifique
  • Fondation pour la Recherche Medicale
  • Conselho Nacional de Desenvolvimento Científico e Tecnológico (308775/2015-5, 480875/2012-0)
  • Financiadora de Estudos e Projetos (01.17.0009.00)
  • Fundação de Amparo à Pesquisa do Estado de São Paulo (2013/07699-0)
Topics
  • Life Sciences › Neuroscience › Cognitive Neuroscience › Sleep and Wakefulness Research
  • Life Sciences › Neuroscience › Cognitive Neuroscience › Memory and Neural Mechanisms
  • Life Sciences › Neuroscience › Cognitive Neuroscience › Neural dynamics and brain function
Keywords
hippocampus, retrosplenial cortex, REM sleep, memory consolidation, hippocampal theta oscillations, Granger causality, contextual fear conditioning, memory retrieval, hippocampal-cortical interaction
MeSH terms
Memory Consolidation, Animals, Gyrus Cinguli, Hippocampus, Male, Memory, Neurons, Sleep, Sleep, REM, Theta Rhythm, Wakefulness, Rats, Sprague-Dawley, Rats

About these checks

Registry, retraction, Cites and statistics results are computed, not judged, with one exception: a printed reference that no index lists is read once by a model before it counts as a citation error. Claims are extracted by a model and kept only when their quote appears verbatim in the text; each cited source is then checked, with a model’s help, for whether it says what the claim relies on. Those verdicts can be wrong — read the claim’s quote and the cited source before relying on one.

Statistics and arithmetic are recomputed, not judged.

Confidence bands are shown only for fields calibrated on our annotated test set. None is calibrated yet, so no band is shown.

What counts as a claim ›How we measure confidence ›How we check this ›

Are you an author, or do you see a problem with this page? Request a review

How to cite

Cite CoChat for the checks on this page, and the paper for its own findings.

This page
CoChat. (2026). Citation check: Hippocampus-retrosplenial cortex interaction is increased during phasic REM and contributes to memory consolidation. https://app.cochat.ai/papers/10.1038/s41598-021-91659-5
The paper
de Almeida-Filho, D. G., Koike, B. D. V., Billwiller, F., Farias, K. S., de Sales, I. R. P., Luppi, P.-H., Ribeiro, S., & Queiroz, C. M. (2021). Hippocampus-retrosplenial cortex interaction is increased during phasic REM and contributes to memory consolidation. Scientific Reports. https://doi.org/10.1038/s41598-021-91659-5

Data sources

Bibliographic data: Semantic Scholar, OpenAlex, Crossref.

Contains information from the Semantic Scholar Academic Graph Datasets, made available under the ODC Attribution License (ODC-BY 1.0).

Semantic Scholar’s data is described in: Kinney, R., et al. (2023). The Semantic Scholar Open Data Platform. arXiv:2301.10140.