

The DOI matches its Crossref record; 5 of the 5 references it cites were found in a registry or an index.
Assessing and forecasting collective urban heat exposure with smart city digital twins
Open accessAbstract
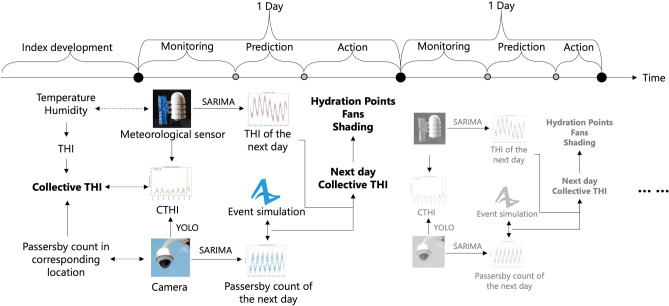
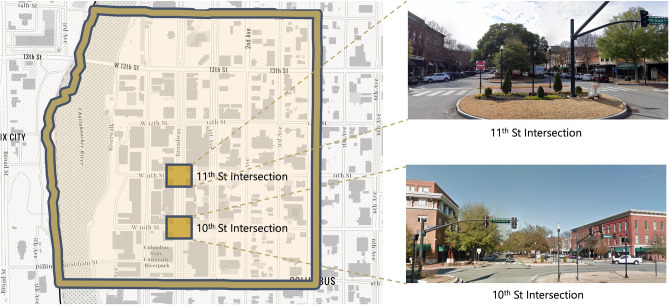
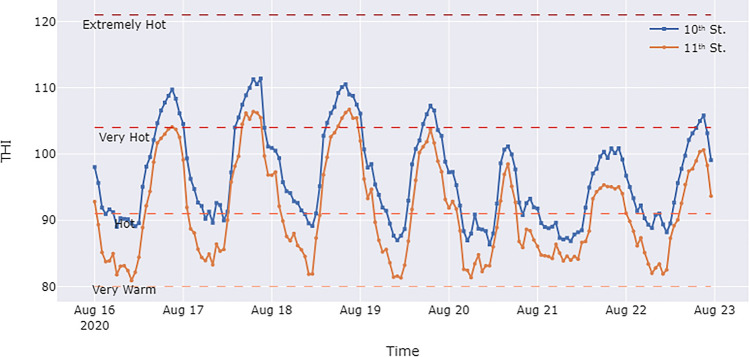
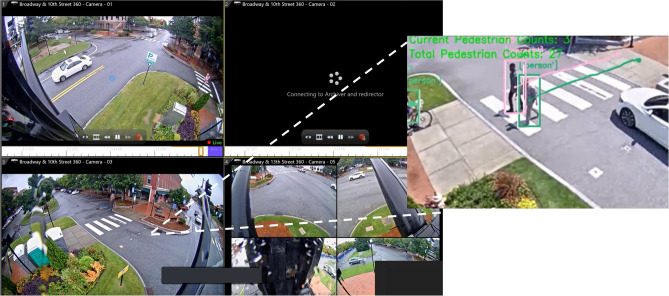
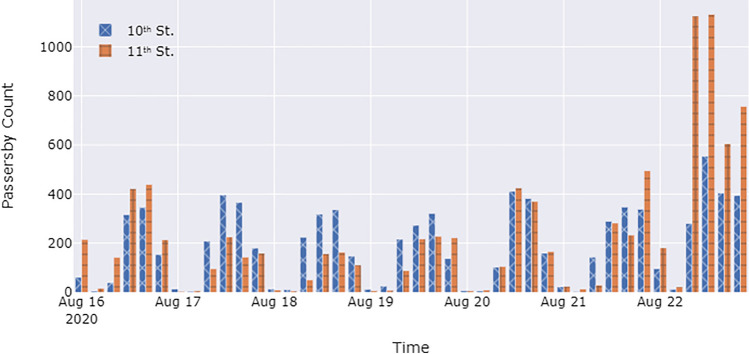
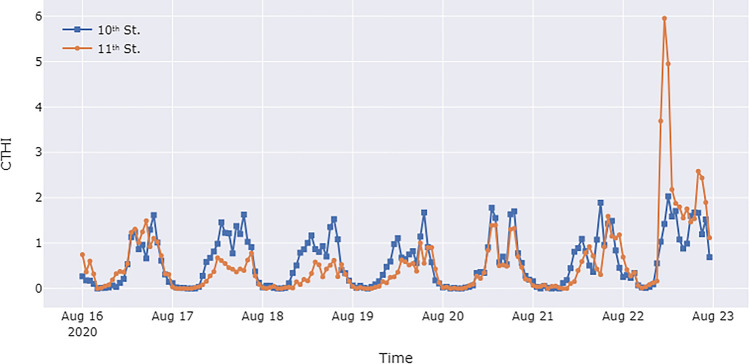
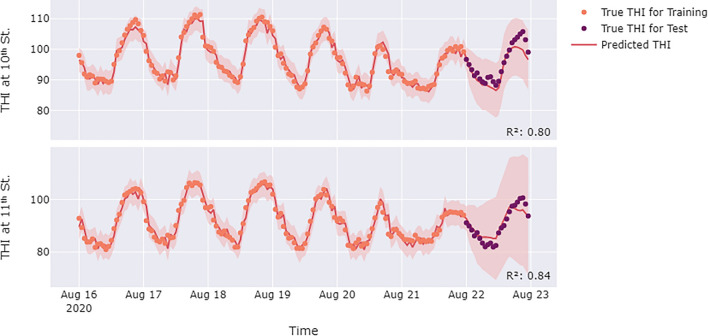
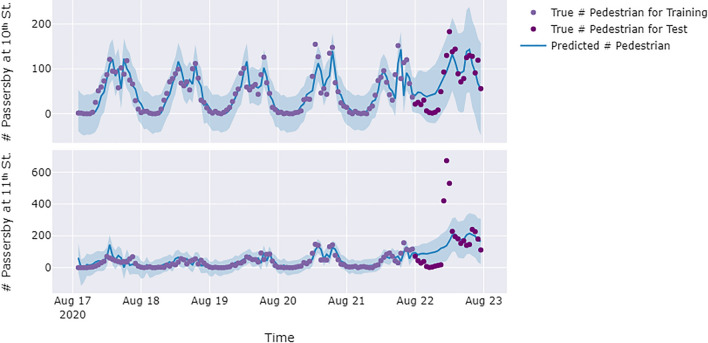
Due to population growth, climate change, and the urban heat island effect, heat exposure is becoming an important issue faced by urban built environments. Heat exposure assessment is a prerequisite for mitigation measures to reduce the impact of heat exposure. However, there is limited research on urban heat exposure assessment approaches that provides fine-scale spatiotemporal heat exposure information, integrated with meteorological status and human collective exposure as they move about in cities, to enable proactive heat exposure mitigation measures. Smart city digital twins (SCDTs) provide a new potential avenue for addressing this gap, enabling fine spatiotemporal scales, human-infrastructure interaction modeling, and predictive and decision support capabilities. This study aims to develop and test an SCDT for collective urban heat exposure assessment and forecasting. Meteorological sensors and computer vision techniques were implemented in Columbus, Georgia, to acquire temperature, humidity, and passersby count data. These data were then integrated into a collective temperature humidity index. A time-series prediction model and a crowd simulation were employed to predict future short-term heat exposures based on the data accumulated by this SCDT and to support heat exposure mitigation efforts. The results demonstrate the potential of SCDT to enhance public safety by providing city officials with a tool for discovering, predicting, and, ultimately, mitigating community exposure to extreme heat.
Overview
The claims and statistics of this paper haven’t been checked yet.
Run the check — free, no account needed. It reads the open-access text and checks the sources it cites.
Integrity signals
Registry
Cites
Statistics
Figures
Verification
Claims the paper makes
The claims and statistics of this paper haven’t been checked yet.
Run the check — free, no account needed. It reads the open-access text and checks the sources it cites.
Claims other papers make about this one
Each is checked against this paper’s own text: does it say what the citing paper says it does?
The source backs part of the claim, not all of it — or backs it for a different population, condition or comparison.
In the citing paper
“In this sense, GIS- and remote-sensing-based frameworks are often used to combine thermal indicators with environmental and demographic layers to cause urban heat vulnerability or risk maps [5, 6].”
From GPU-Accelerated Deep Learning for Heatwave Prediction and Urban Heat Risk Assessment (2026) · cites this paper as [5]
Experimental — accuracy not yet measured
Self-check
Percentages, sums and reported differences re-computed from the paper’s own numbers.
The self-check needs the paper’s full text.
Citations
Cites
You Only Look Once: Unified, Real-Time Object Detection
Redmon, J., Divvala, S., Girshick, R., & Farhadi, A. (2016) · 2016 IEEE Conference on Computer Vision and Pattern Recognition (CVPR) · doi:10.1109/cvpr.2016.91 · Cited by 53,803
Digital Twin: Mitigating Unpredictable, Undesirable Emergent Behavior in Complex Systems
Grieves, M., & Vickers, J. (2017) · Transdisciplinary Perspectives on Complex Systems · doi:10.1007/978-3-319-38756-7_4 · Cited by 3,727
The Digital Twin Paradigm for Future NASA and U.S. Air Force Vehicles
Glaessgen, E., & Stargel, D. (2012) · 53rd AIAA/ASME/ASCE/AHS/ASC Structures, Structural Dynamics and Materials Conference 20th AIAA/ASME/AHS Adaptive Structures Conference 14th AIAA · doi:10.2514/6.2012-1818 · Cited by 2,404
The burden of heat-related mortality attributable to recent human-induced climate change
Vicedo-Cabrera, A. M., Scovronick, N., Sera, F., Royé, D., Schneider, R., Tobias, A., Astrom, C., Guo, Y., Honda, Y., Hondula, D. M., et al. (2021) · Nature Climate Change · doi:10.1038/s41558-021-01058-x · Cited by 1,347
Edge-Computing Video Analytics for Real-Time Traffic Monitoring in a Smart City
Barthélemy, J., Verstaevel, N., Forehead, H., & Perez, P. (2019) · Sensors · doi:10.3390/s19092048 · Cited by 203
Research works printed but not linked: 36
- Zhang, Y. et al. Population exposure to concurrent daytime and nighttime heatwaves in Huai River Basin. China. Sustainable Cities and Society 61, 102309 (2020). · DOI
- Paravantis, J., Santamouris, M., Cartalis, C., Efthymiou, C. & Kontoulis, N. Mortality associated with high ambient temperatures, heatwaves, and the urban heat island in Athens. Greece. Sustainability 9, 606 (2017). · DOI
- Macintyre, H. L. & Heaviside, C. Potential benefits of cool roofs in reducing heat-related mortality during heatwaves in a European city. Environ. Int. 127, 430–441 (2019). · DOI
- Yin, Y. et al. DTEx: A dynamic urban thermal exposure index based on human mobility patterns. Environ. Int. 155, 106573 (2021). · DOI
- Bolitho, A. & Miller, F. Heat as emergency, heat as chronic stress: policy and institutional responses to vulnerability to extreme heat. Local Environ. 22, 682–698 (2017). · DOI
- Li, L. & Zha, Y. Population exposure to extreme heat in China: Frequency, intensity, duration and temporal trends. Sustain. Cities Soc. 60, 102282 (2020). · DOI
- Park, C. Y., Thorne, J. H., Hashimoto, S., Lee, D. K. & Takahashi, K. Differing spatial patterns of the urban heat exposure of elderly populations in two megacities identifies alternate adaptation strategies. Sci. Total Environ. 781, 146455 (2021). · DOI
- Hua, J., Zhang, X., Ren, C., Shi, Y. & Lee, T.-C. Spatiotemporal assessment of extreme heat risk for high-density cities: A case study of Hong Kong from 2006 to 2016. Sustain. Cities Soc. 64, 102507 (2021). · DOI
- Li, X. Investigating the spatial distribution of resident’s outdoor heat exposure across neighborhoods of Philadelphia, Pennsylvania using urban microclimate modeling. Sustain. Cities Soc. 72, 103066 (2021). · DOI
- Kuras, E. R., Hondula, D. M. & Brown-Saracino, J. Heterogeneity in individually experienced temperatures (IETs) within an urban neighborhood: insights from a new approach to measuring heat exposure. Int. J. Biometeorol. 59, 1363–1372 (2015). · DOI
- Mohammadi, N. & Taylor, J. E. Smart City Digital Twins. in 2017 IEEE Symposium Series on Computational Intelligence (2017). · DOI
- Mohammadi, N. & Taylor, J. E. Thinking fast and slow in disaster decision-making with smart city digital twins. Nat. Comput. Sci. 1, 771–773 (2021). · DOI
- Francisco, A., Mohammadi, N. & Taylor, J. E. Smart city digital twin-enabled energy management: toward real-time urban building energy benchmarking. J. Manag. Eng. https://doi.org/10.1061/(ASCE)ME.1943-5479.0000741 (2020). · DOI
- Lin, Y. & Cheung, W. Developing WSN/BIM-based environmental monitoring management system for parking garages in smart cities. J. Manag. Eng. 36, 04020012 (2020). · DOI
- Fan, C., Jiang, Y. & Mostafavi, A. Social sensing in disaster city digital twin: integrated textual-visual-geo framework for situational awareness during built environment disruptions. J. Manag. Eng. 36, 1–13 (2020). · DOI
- Lee, G., Choi, B., Ahn, C. R. & Lee, S. Wearable biosensor and hotspot analysis-based framework to detect stress hotspots for advancing elderly’s mobility. J. Manag. Eng. 36, 1–13 (2020). · DOI
- Ham, Y. & Kim, J. Participatory sensing and digital twin city: updating virtual city models for enhanced risk-informed decision-making. J. Manag. Eng. 36, 1–12 (2020). · DOI · Paper page
- Lu, Q., Parlikad, A. K., Woodall, P., Ranasinghe, G. D., Heaton, J. Developing a Dynamic Digital Twin at a Building Level: using Cambridge Campus as Case Study. in International Conference on Smart Infrastructure and Construction 2019 (ICSIC) vol. 36 67–75 (ICE Publishing, 2019). · DOI
- Zhang, F., Wu, L., Zhu, D. & Liu, Y. Social sensing from street-level imagery: A case study in learning spatio-temporal urban mobility patterns. ISPRS J. Photogramm. Remote. Sens. 153, 48–58 (2019). · DOI
- Naik, N., Kominers, S. D., Raskar, R., Glaeser, E. L. & Hidalgo, C. A. Computer vision uncovers predictors of physical urban change. Proc. Natl. Acad. Sci. 114, 7571–7576 (2017). · DOI
- Zaki, M. H., Sayed, T., Ismail, K. & Alrukaibi, F. Use of computer vision to identify pedestrians’ nonconforming behavior at urban intersections. Transp. Res. Record: J. Transp. Res. Board 2279, 54–64 (2012). · DOI
- Zaki, M. H., Sayed, T., Tageldin, A. & Hussein, M. Application of computer vision to diagnosis of pedestrian safety issues. Transp. Res. Record: J. Transp. Res. Board 2393, 75–84 (2013). · DOI
- Girshick, R. Fast R-CNN. in 2015 IEEE International Conference on Computer Vision (ICCV) 1440–1448 (IEEE, 2015). doi:https://doi.org/10.1109/ICCV.2015.169 · DOI · Paper page
- He, K., Gkioxari, G., Dollar, P., Girshick, R. Mask R-CNN. in 2017 IEEE International Conference on Computer Vision (ICCV) 2980–2988 (IEEE, 2017). doi:https://doi.org/10.1109/ICCV.2017.322 · DOI · Paper page
- Wojke, N., Bewley, A., Paulus, D. Simple online and realtime tracking with a deep association metric. (2017) · DOI · Paper page
- Yang, Y.-L., Gao, W.-W. A Method of Pedestrians Counting Based on Deep Learning. in 2019 3rd International Conference on Electronic Information Technology and Computer Engineering (EITCE) 2010–2013 (IEEE, 2019). doi:https://doi.org/10.1109/EITCE47263.2019.9094838. · DOI
- Wang, J. et al. Mapping the exposure and sensitivity to heat wave events in China’s megacities. Sci. Total Environ. 755, 142734 (2021). · DOI
- Runkle, J. D. et al. Evaluation of wearable sensors for physiologic monitoring of individually experienced temperatures in outdoor workers in southeastern US. Environ. Int. 129, 229–238 (2019). · DOI
- Hondula, D. M. et al. Novel metrics for relating personal heat exposure to social risk factors and outdoor ambient temperature. Environ. Int. 146, 106271 (2021). · DOI
- Willers, S. M. et al. High resolution exposure modelling of heat and air pollution and the impact on mortality. Environ. Int. 89–90, 102–109 (2016). · DOI
- Hu, L., Wilhelmi, O. V. & Uejio, C. Assessment of heat exposure in cities: Combining the dynamics of temperature and population. Sci. Total Environ. 655, 1–12 (2019). · DOI
- Taylor, J. et al. Mapping indoor overheating and air pollution risk modification across Great Britain: A modelling study. Build. Environ. 99, 1–12 (2016). · DOI
- Che Muhamed, A. M., Atkins, K., Stannard, S. R., Mündel, T. & Thompson, M. W. The effects of a systematic increase in relative humidity on thermoregulatory and circulatory responses during prolonged running exercise in the heat. Temperature 3, 455–464 (2016). · DOI
- Steadman, R. G. The assessment of sultriness. Part I: A temperature-humidity index based on human physiology and clothing science. J. Appl. Meteorol. 18, 861–873 (1979). · DOI
- Beckman, P. et al. Waggle: An open sensor platform for edge computing. in 2016 IEEE SENSORS 1–3 (IEEE, 2016). doi:https://doi.org/10.1109/ICSENS.2016.7808975. · DOI
- Wabartha, M., Durand, A., Francois-Lavet, V, Pineau, J. Handling black swan events in deep learning with diversely extrapolated neural networks. IJCAI International Joint Conference on Artificial Intelligence 2021-Janua, 2140–2147 (2020) · DOI
Cited by
Sorted by citations
GPU-Accelerated Deep Learning for Heatwave Prediction and Urban Heat Risk Assessment
Alihodžić, A. (2026) · arXiv · doi:10.48550/arxiv.2605.16435
“In this sense, GIS-and remote-sensing-based frameworks are often used to combine thermal indicators with environmental and demographic layers to cause urban heat vulnerability or risk maps [5, 6].”
Metadata
- Authors
- Pan, X., Mavrokapnidis, D., Ly, H. T., Mohammadi, N., & Taylor, J. E.
- Affiliations
- Georgia Institute of Technology (US)
- University College London (GB)
- Corresponding author
- Taylor, John E.
- Venue
- Scientific Reports
- Published
- 2024-04-26
- Volume
- 14
- Issue
- 1
- Pages
- 9653-9653
- ISSN
- 2045-2322 (ISSN-L)
- PMC
- PMC11053083
- OpenAlex
- W4395676953
- Cited by
- 33
- References
- 5
- Citations by year
- 2026: 17 · 2025: 11 · 2024: 5
- FWCI
- 1.21
- Type
- journal article
- Language
- en
- Open access
- gold
- doi.org
- Locations
- Scientific Reports (publishedVersion, cc-by)
- SSRN Electronic Journal (publishedVersion)
- PubMed Central (publishedVersion, cc-by)
- PubMed (publishedVersion)
- UCL Discovery (University College London) (submittedVersion, cc-by)
- DOAJ (DOAJ: Directory of Open Access Journals) (submittedVersion)
- Funders
- National Science Foundation (1837021)
- Topics
- Physical Sciences › Environmental Science › Environmental Engineering › Urban Heat Island Mitigation
- Physical Sciences › Environmental Science › Health, Toxicology and Mutagenesis › Climate Change and Health Impacts
- Social Sciences › Urban Studies › Smart Cities and Technologies
- Keywords
- urban heat island, crowd simulation, weather sensors, computer vision, public safety, Columbus, Georgia
About these checks
Registry, retraction, Cites and statistics results are computed, not judged, with one exception: a printed reference that no index lists is read once by a model before it counts as a citation error. Claims are extracted by a model and kept only when their quote appears verbatim in the text; each cited source is then checked, with a model’s help, for whether it says what the claim relies on. Those verdicts can be wrong — read the claim’s quote and the cited source before relying on one.
Statistics and arithmetic are recomputed, not judged.
Confidence bands are shown only for fields calibrated on our annotated test set. None is calibrated yet, so no band is shown.
What counts as a claim ›How we measure confidence ›How we check this ›
Are you an author, or do you see a problem with this page? Request a review
