

A tumor microenvironment-specific gene expression signature predicts chemotherapy resistance in colorectal cancer patients
Open accessThe DOI matches its Crossref record; 94 of the 97 references it cites were found in a registry or an index; 17 of the 31 sources its claims cite were checked for support.
Abstract
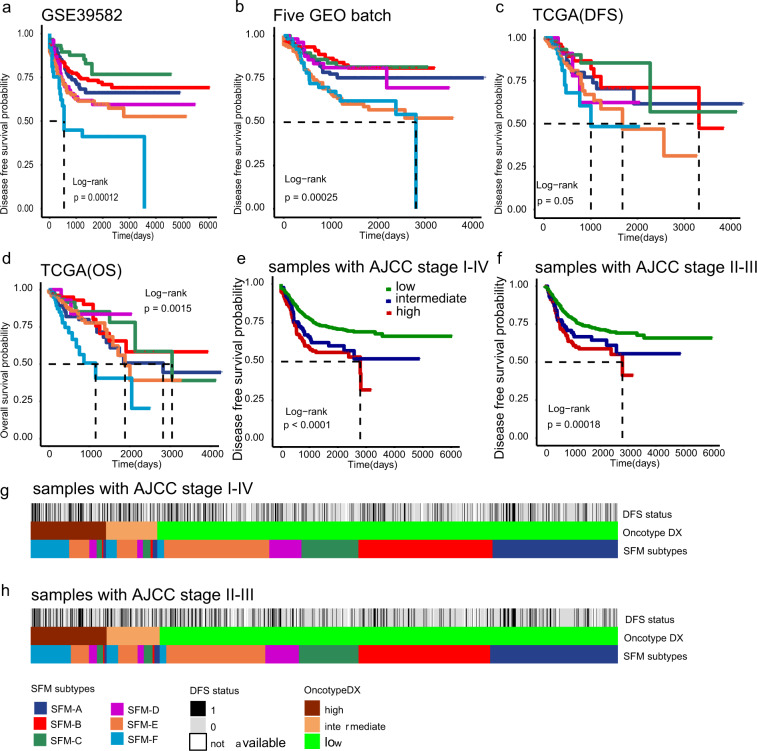
Studies have shown that tumor microenvironment (TME) might affect drug sensitivity and the classification of colorectal cancer (CRC). Using TME-specific gene signature to identify CRC subtypes with distinctive clinical relevance has not yet been tested. A total of 18 "bulk" RNA-seq datasets (total n = 2269) and four single-cell RNA-seq datasets were included in this study. We constructed a "Signature associated with FOLFIRI resistant and Microenvironment" (SFM) that could discriminate both TME and drug sensitivity. Further, SFM subtypes were identified using K-means clustering and verified in three independent cohorts. Nearest template prediction algorithm was used to predict drug response. TME estimation was performed by CIBERSORT and microenvironment cell populations-counter (MCP-counter) methods. We identified six SFM subtypes based on SFM signature that discriminated both TME and drug sensitivity. The SFM subtypes were associated with distinct clinicopathological, molecular and phenotypic characteristics, specific enrichments of gene signatures, signaling pathways, prognosis, gut microbiome patterns, and tumor lymphocytes infiltration. Among them, SFM-C and -F were immune suppressive. SFM-F had higher stromal fraction with epithelial-to-mesenchymal transition phenotype, while SFM-C was characterized as microsatellite instability phenotype which was responsive to immunotherapy. SFM-D, -E, and -F were sensitive to FOLFIRI and FOLFOX, while SFM-A, -B, and -C were responsive to EGFR inhibitors. Finally, SFM subtypes had strong prognostic value in which SFM-E and -F had worse survival than other subtypes. SFM subtypes enable the stratification of CRC with potential chemotherapy response thereby providing more precise therapeutic options for these patients.
Overview
CoChat Summary
TL;DR
The authors built a 250-gene “Signature associated with FOLFIRI resistant and Microenvironment” (SFM) from 18 bulk RNA-seq datasets (n = 2269) and 4 scRNA-seq datasets to classify colorectal cancer (CRC) by tumor microenvironment and drug-response patterns. K-means clustering yielded six CRC subtypes (SFM-A to SFM-F) that differed in TME composition, clinicopathologic features, prognosis, microbiome patterns, and predicted sensitivity to chemotherapy and EGFR-targeted therapy.
Key findings
- The final SFM signature contained 317 probes corresponding to 250 unique genes, selected from 2269 CRC gene expression profiles; in four scRNA-seq datasets, SFM separated malignant from nonmalignant/TME cell types.
- K-means clustering in the discovery cohort identified 6 subtypes (SFM-A to SFM-F); subtype proportions in the main datasets were SFM-A 23%, SFM-B 23%, SFM-E 25%, SFM-C 12%, SFM-F 10%, and SFM-D 8%.
- Chemotherapy associations were subtype-specific: SFM-E and SFM-F were enriched for FOLFIRI/FOLFOX responsiveness, while SFM-A and SFM-B were resistant; in one combined FOLFIRI dataset, 8/9 responders were classified as SFM-E or SFM-F (P = 0.0006).
- Prognosis differed by subtype: SFM-E and SFM-F had worse survival, and in multivariate Cox analysis the strongest prognostic value was CCS3 (HR = 11.32, 95% CI 3.14–40.84), followed by SFM-F (HR = 2.48, 95% CI 1.51–3.96) and SFM-E (HR = 1.89, 95% CI 1.24–2.89).
- The subtypes also showed distinct biology: SFM-C was enriched for MSI, BRAF mutation, hypermutation, and proximal colon phenotype, while SFM-F had stronger stroma/EMT features and higher checkpoint-marker expression.
Methods
- Built the SFM signature by comparing sorted cell populations from GSE39395 and GSE39396 with FOLFIRI responder/nonresponder tumors from GSE62080, using differential expression with P < 0.05 and |logFC| ≥ 1; intersected results produced the final gene set.
- Classified CRC samples into subtypes using K-means clustering on SFM expression, selecting k = 6 in the discovery dataset (GSE39582) and validating in five GEO batch, TCGA, and Renji cohort datasets.
- Assessed subtype associations with drug response (NTP on published signatures), immune/stromal infiltration (CIBERSORT, MCP-counter, estimate), survival (Kaplan–Meier and Cox models), and microbiome patterns (PathSeq), with additional validation in four scRNA-seq datasets.
Limitations
- The paper states the study is retrospective and says the subtype classification should be tested in large prospective clinical trials.
- The multivariate Cox models lacked some clinical covariates, because tumor grade and number of positive nodes were not publicly available; this limits certainty that SFM is an independent prognostic factor.
- Drug response was predicted from previously published gene signatures rather than directly measured in the included datasets, so the authors say subtype-specific drug sensitivity needs future confirmation.
- Evident from the text: some findings rely on small subgroups (for example, the Renji cohort had only four subtypes due to sample size), which may weaken stability of some subtype-specific conclusions.
Model-written summary. Check it against the paper before relying on it.
Integrity signals
Registry
Cites
Statistics
Figures




Verification
Claims the paper makes
11 Valid · 1 Not valid · 9 Not checked · 75 Own results and interpretations
Every source the paper cites for this claim was checked and supports it.
In the paper
“Moreover, although SFM-C displayed nonresponsive to FOLFIRI and FOLFOX, which was also consistent with previous studies suggesting MSI tumors barely responded to fluorouracil-based therapy42, it had better survival in this combined dataset probably because of the enrichment of MSI phenotype, which has been proofed to have relative better survival43.”
§ A tumor microenvironment-specific gene expression signature predicts chemotherapy resistance in colorectal cancer patients > Discussion
What the sources say
- Supportedcites [42] Sargent, D. J. et al. Defective mismatch repair as a predictive marker for lack of efficacy of fluorouracil-based adjuvant therapy in colon cancer. J. Clin. Oncol. 28, 3219–3226 (2010). source
The INTRODUCTION of Sargent et al. (2010) states that 'numerous retrospective studies, including a meta-analysis, have shown that patients with dMMR CRC have improved stage-independent survival relative to patients with proficient mismatch repair (pMMR)', and the Abstract opens by noting MSI-H/dMMR patients 'have improved survival'. The DISCUSSION/conclusion affirms 'dMMR colon cancers have a favorable stage-adjusted prognosis compared with the majority of colon cancers', and the results section 'MMR Status As a Prognostic Marker' reports improved DFS with dMMR in surgery-alone patients (HR 0.46; P = .03), though the effect was not significant in multivariate models. Only the prognostic-benefit part of the citing sentence is offered to this citation (the FU-nonresponsiveness is credited to reference 42), and that part is squarely stated by the source. (LLM, conf=0.85)
- Supportedcites [43] Ribic, C. M. et al. Tumor microsatellite-instability status as a predictor of benefit from fluorouracil-based adjuvant chemotherapy for colon cancer. N. Engl. J. Med. 349, 247–257 (2003). source
Ribic et al. (2003) states the prognostic point the citation is offered for: the introduction (Abstract/intro, p.1) records that 'Patients with colorectal cancers that exhibit high-frequency microsatellite instability have longer survival than stage-matched patients with cancers exhibiting microsatellite stability,' and the Results section 'relation between microsatellite-instability status and survival' (p.5-6) reports significantly longer overall survival for MSI-H tumors in patients not receiving adjuvant chemotherapy (HR 0.31, 95% CI 0.14-0.72; P=0.004), higher five-year DFS in the pooled analysis (75.3% vs 64.1%, P=0.04) and a significant multivariate association with overall survival (HR 0.61, 0.38-0.96; P=0.03). The one qualifier the citing sentence drops is that this relative survival advantage was confined to patients who did not receive fluorouracil-based adjuvant therapy (HR 1.07, NS among those treated); the FOLFIRI/FOLFOX non-response part of the sentence is credited to reference 42, not to this paper. (LLM, conf=0.85)
hedgedstates a possible cause- Asserted: passes — The authors put it forward as true.
- Checkable: passes — It can be checked against evidence.
- Load-bearing: passes — The paper’s conclusions depend on it.
- Based: passes — The paper gives a reason why it holds.
- Supported
The cited sources support only part of this claim — read each source’s verdict below.
In the paper
“Given that TME also makes great contribution to chemotherapy and immunotherapy sensitivity7,19,20”
§ A tumor microenvironment-specific gene expression signature predicts chemotherapy resistance in colorectal cancer patients > Introduction Colorectal cancer (CRC) is a disease with great heterogeneity characterized as distinctive molecular pathogenesis, histogenesis, and drug sensitivity1,2. The heterogeneity of CRC has been revealed by using whole-genome sequencing (WGS), epigenetic analysis, and gene expression profiles. For instance, at the genetic level, some DNA markers have been recognized including microsatellite instability (MSI), CpG island methylator phenotype (CIMP), chromosomal instability (CIN), BRAF, and KRAS mutations. Further, tumor microenvironment (TME) components consist of distinctive and interacting cell populations, including tumor epithelial cells, immune cells, and cancer-associated fibroblasts (CAFs)3,4. The diversity of TME has made it possible to perform immune classification of cancers regarding prognosis5, chemotherapy6, and immunotherapy7 response prediction. For example, MSI tumor displays higher densities of type 1 T helper, effector memory T cells8, and has good prognosis. It has also shown significant benefit from immune checkpoint blockade therapy, anti-PD1/PDL1 (refs. 9,10). Besides, increasing evidence indicated that the dysbiosis of gut microbiota can lead to the development and progression of CRC by inducting chronic inflammatory state and immune response, regulating stem cell dynamics, producing toxic and genotoxic metabolites, and affecting the host metabolism11. Microbial communities also varied in different parts of gut, including distal colon and proximal ileum, both of which admittedly have distinctive prognosis and treatment strategies12. Gene expression-based classifying has shown high efficiency for cancer classification. Several molecular classifiers in CRC have been built using global gene expression analysis, including colon cancer subtypes (CCS)13, the Colorectal Cancer Assigner14, colon cancer molecular subtype systems, and colorectal cancer subtyping consortium (CRCSC)15. Most of them were constructed directly based on global expression profiles using unsupervised consensus-based clustering algorithms. However, these transcriptome signals derived from both cancer cells and noncancerous components. And these approaches can’t distinguish these signals automatically when applied to classification. Recent studies have consistently suggested that TME components played important roles in defining CRC with poor prognosis and immune escape16–18. Given that TME also makes great contribution to chemotherapy and immunotherapy sensitivity7,19,20, and FOLFIRI (combination of folinic acid, fluorouracil, and irinotecan) and FOLFOX (combination of 5-fluorououracil, leukovorin, and oxaliplatin) are two of the most common first-line treatment strategies for metastatic CRC (mCRC), we proposed that using gene expression profiles that could discriminate both TME and drug sensitivity might be an effective way to define CRC molecular subtypes. To test this hypothesis, a total of 2269 gene expression profiles from 18 datasets and another four single-cell RNA-sequencing (scRNA-seq) datasets were analyzed in this study to (i) construct a gene signature consisted of genes that could discriminate both TME and drug sensitivity; (ii) further identify a robust molecular classification using this gene signature; and (iii) evaluate the associations between CRC subtypes and clinicopathological factors, common oncogenic mutations, genetic changes, signaling pathways, drug sensitivity, immune infiltration, prognosis, and gut microbiota patterns.
What the sources say
- Partly supportedcites [7] Taube, J. M. et al. Association of PD-1, PD-1 ligands, and other features of the tumor immune microenvironment with response to anti-PD-1 therapy. Clin. Cancer Res. 20, 5064–5074 (2014). sourceExperimental — accuracy not yet measured
The Results report that tumor-cell PD-L1 expression correlated with response to anti-PD-1 therapy, supporting a role for a tumor-microenvironment feature in immunotherapy response. The Discussion also notes improved benefit from certain chemotherapy regimens among HER2-positive breast cancer patients with tumor-infiltrating lymphocytes. These specific associations do not establish the broader claim that the tumor microenvironment makes a major contribution to sensitivity to chemotherapy and immunotherapy generally; several other microenvironmental features did not independently correlate with anti-PD-1 response. (LLM, conf=0.85)
- Not checked — no full text of the sourcecites [19] Tredan, O., Galmarini, C. M., Patel, K. & Tannock, I. F. Drug resistance and the solid tumor microenvironment. J. Natl Cancer Inst. 99, 1441–1454 (2007). source
- Partly supportedcites [20] Wang, L. et al. EMT- and stroma-related gene expression and resistance to PD-1 blockade in urothelial cancer. Nat. Commun. 9, 3503 (2018). sourceExperimental — accuracy not yet measured
The Results section reports that T-cell infiltration and EMT/stroma-related gene expression were associated with response to nivolumab in urothelial cancer, supporting the immunotherapy part of the claim. The paper does not establish that the tumor microenvironment determines chemotherapy sensitivity, and its Discussion cautions that the biomarker findings may be prognostic rather than predictive. No page numbers are available in our copy. (LLM, conf=0.86)
plainstates a cause- Asserted: passes — The authors put it forward as true.
- Checkable: passes — It can be checked against evidence.
- Load-bearing: passes — The paper’s conclusions depend on it.
- Based: passes — The paper gives a reason why it holds.
- Partly supported
Every source the paper cites for this claim was checked and supports it.
In the paper
“Although FOLFIRI or FOLFOX can significantly extend the median OS to >15 months, there are nearly 50% patients are not responsive38.”
§ A tumor microenvironment-specific gene expression signature predicts chemotherapy resistance in colorectal cancer patients > Discussion
What the sources say
- Supportedcites [38] Goldberg, R. M. Therapy for metastatic colorectal cancer. Oncologist 11, 981–987 (2006). source
Our copy does not print a non-response percentage in words, but it reports the objective response rates that fix it: the www.TheOncologist.com section gives FOLFOX RRs of 54% (Tournigand) and 45% (N9741), and Table 3 (Discussion) lists FOLFIRI 56%, FOLFOX 54% (Tournigand) and FOLFOX 45% vs IFL 31% (N9741). The complement of these rates is 44%-55%, i.e. roughly half of patients failing to respond, which is what the citing sentence attributes. The same passages also carry the companion point that these doublets extend median OS beyond the 15 months seen with IFL (19.5-21.5 months). (LLM, conf=0.80)
plain- Asserted: passes — The authors put it forward as true.
- Checkable: passes — It can be checked against evidence.
- Load-bearing: passes — The paper’s conclusions depend on it.
- Based: passes — The paper gives a reason why it holds.
- Supported
Every source the paper cites for this claim was checked and supports it.
In the paper
“Sadanandam et al. have reported that stem-like subtype tumors responded to FOLFIRI14.”
§ A tumor microenvironment-specific gene expression signature predicts chemotherapy resistance in colorectal cancer patients > Discussion
What the sources say
- Supportedcites [14] Sadanandam, A. et al. A colorectal cancer classification system that associates cellular phenotype and responses to therapy. Nat. Med. 19, 619–625 (2013). source
The passage labeled Abstract reports that 71% of stem-like–subtype tumors in a metastatic colorectal cancer dataset were associated with clinical benefit from FOLFIRI, compared with 29% of tumors from other subtypes. This supports the citing sentence’s summary that stem-like tumors responded to FOLFIRI. (LLM, conf=0.93)
plainstates an association- Asserted: passes — The authors put it forward as true.
- Checkable: passes — It can be checked against evidence.
- Load-bearing: passes — The paper’s conclusions depend on it.
- Based: passes — The paper gives a reason why it holds.
- Supported
The cited sources support only part of this claim — read each source’s verdict below.
In the paper
“Our results were also in line with previous reports that F. nucleatum was associated with CIMP+, MSI CRC subtype47, both of which were features of SFM-C.”
§ A tumor microenvironment-specific gene expression signature predicts chemotherapy resistance in colorectal cancer patients > Discussion
What the sources say
- Partly supportedcites [47] Lennard, K. S., Goosen, R. W. & Blackburn, J. M. Bacterially-associated transcriptional remodelling in a distinct genomic subtype of colorectal cancer provides a plausible molecular basis for disease development. PloS ONE 11, e0166282 (2016). sourceExperimental — accuracy not yet measured
The Results sections on B-group CRCs report enrichment for CIMP+ and MSI+ tumours and greater high-level colonisation by Fusobacterium spp. in a related inflammatory/goblet-like cluster (page not supplied). This supports an association at the genus level, but the copy does not establish that F. nucleatum specifically was associated with the CIMP+, MSI subtype. (LLM, conf=0.85)
plainstates an association- Asserted: passes — The authors put it forward as true.
- Checkable: passes — It can be checked against evidence.
- Load-bearing: unclear — It is unclear whether the paper’s conclusions depend on it.
- Based: passes — The paper gives a reason why it holds.
- Partly supported
52 more claims
Create a free account to see all 96 claims and to verify the 5 references still open.
- Probably not a substantial claim. 23
- It may state two separate claims as one. 21
Citations
Cites
limma powers differential expression analyses for RNA-sequencing and microarray studies
Ritchie, M. E., Phipson, B., Wu, D., Hu, Y., Law, C. W., Shi, W., & Smyth, G. K. (2015) · Nucleic Acids Research · doi:10.1093/nar/gkv007 · Cited by 40,458
Self-citationfeatureCounts: an efficient general purpose program for assigning sequence reads to genomic features
Liao, Y., Smyth, G. K., & Shi, W. (2014) · Bioinformatics · doi:10.1093/bioinformatics/btt656 · Cited by 27,219
HISAT: a fast spliced aligner with low memory requirements
Kim, D., Langmead, B., & Salzberg, S. L. (2015) · Nature Methods · doi:10.1038/nmeth.3317 · Cited by 24,112
Siegel, R. L., Miller, K. D., & Jemal, A. (2018) · CA: A Cancer Journal for Clinicians · doi:10.3322/caac.21442 · Cited by 16,579
GSVA: gene set variation analysis for microarray and RNA-Seq data
Hänzelmann, S., Castelo, R., & Guinney, J. (2013) · BMC Bioinformatics · doi:10.1186/1471-2105-14-7 · Cited by 15,440
Robust enumeration of cell subsets from tissue expression profiles
Newman, A. M., Liu, C. L., Green, M. R., Gentles, A. J., Feng, W., Xu, Y., Hoang, C. D., Diehn, M., & Alizadeh, A. A. (2015) · Nature Methods · doi:10.1038/nmeth.3337 · Cited by 13,224
Adjusting batch effects in microarray expression data using empirical Bayes methods
Johnson, W. E., Li, C., & Rabinovic, A. (2007) · Biostatistics · doi:10.1093/biostatistics/kxj037 · Cited by 8,658
Comprehensive molecular characterization of human colon and rectal cancer
The Cancer Genome Atlas Network (2012) · Nature · doi:10.1038/nature11252 · Cited by 8,499
Mismatch repair deficiency predicts response of solid tumors to PD-1 blockade
Le, D. T., Durham, J. N., Smith, K. N., Wang, H., Bartlett, B. R., Aulakh, L. K., Lu, S., Kemberling, H., Wilt, C., Luber, B. S., et al. (2017) · Science · doi:10.1126/science.aan6733 · Cited by 6,645
Bindea, G., Mlecnik, B., Hackl, H., Charoentong, P., Tosolini, M., Kirilovsky, A., Fridman, W.-H., Pagès, F., Trajanoski, Z., & Galon, J. (2009) · Bioinformatics · doi:10.1093/bioinformatics/btp101 · Cited by 6,280
Cited by
Genetic Heterogeneity, Tumor Microenvironment and Immunotherapy in Triple-Negative Breast Cancer
Kúdelová, E., Smolár, M., Holubeková, V., Horňáková, A., Dvorská, D., Lučanský, V., Koklesová, L., Kúdela, E., & Kubatka, P. (2022) · International Journal of Molecular Sciences · doi:10.3390/ijms232314937 · Cited by 136
The Role of Gut Microbiota in Tumor Immunotherapy
Wu, M., Bai, J., Ma, C., Wei, J., & Du, X. (2021) · Journal of Immunology Research · doi:10.1155/2021/5061570 · Cited by 39
Colorectal cancer and therapy response: a focus on the main mechanisms involved
Tirendi, S., Marengo, B., Domenicotti, C., Bassi, A. M., Almonti, V., & Vernazza, S. (2023) · Frontiers in Oncology · doi:10.3389/fonc.2023.1208140 · Cited by 42
Artificial Intelligence in Bulk and Single-Cell RNA-Sequencing Data to Foster Precision Oncology
Giudice, M. D., Peirone, S., Perrone, S., Priante, F., Varese, F., Tirtei, E., Fagioli, F., & Cereda, M. (2021) · International Journal of Molecular Sciences · doi:10.3390/ijms22094563 · Cited by 38
A Perspective on the Role of Microbiome for Colorectal Cancer Treatment
Kalasabail, S., Engelman, J., Zhang, L. Y., El-Omar, E. M., & Yim, H. C. H. (2021) · Cancers · doi:10.3390/cancers13184623 · Cited by 41
Metadata
- Authors
- Zhu, X., Tian, X., Ji, L., Zhang, X., Cao, Y., Shen, C., Hu, Y., Wong, J. W. H., Fang, J.-Y., Hong, J., & Chen, H.
- Affiliations
- Shanghai Jiao Tong University (CN)
- Cedars-Sinai Medical Center (US)
- University of Hong Kong (HK)
- Corresponding author
- Fang, Jing-Yuan
- Hong, Jie
- Chen, Haoyan
- ORCID
- Venue
- npj Precision Oncology
- Published
- 2021-02-12
- Volume
- 5
- Issue
- 1
- Pages
- 7-7
- ISSN
- 2397-768X (ISSN-L)
- PMC
- PMC7881244
- OpenAlex
- W3128209586
- Cited by
- 41
- References
- 97
- Citations by year
- 2026: 2 · 2025: 5 · 2024: 6 · 2023: 10 · 2022: 9 · 2021: 9
- FWCI
- 3.10
- Type
- journal article
- Language
- en
- Open access
- gold
- doi.org
- Licence
- cc-by
- creativecommons.org/licenses/by/4.0 (tdm)
- creativecommons.org/licenses/by/4.0 (vor)
- Locations
- npj Precision Oncology (publishedVersion, cc-by)
- PubMed Central (publishedVersion, cc-by)
- PubMed (publishedVersion)
- DOAJ (DOAJ: Directory of Open Access Journals) (submittedVersion, cc-by-sa)
- Funders
- National Natural Science Foundation of China (201268, 81602518, 82073115, 31371273, 81874159, 81871901)
- Shanghai Municipal Education Commission (20161309, 20152512)
- Shanghai Jiao Tong University
- Topics
- Health Sciences › Medicine › Oncology › Colorectal Cancer Treatments and Studies
- Life Sciences › Biochemistry, Genetics and Molecular Biology › Molecular Biology › Gene expression and cancer classification
- Health Sciences › Medicine › Oncology › Cancer Immunotherapy and Biomarkers
- Keywords
- colorectal cancer, tumor microenvironment, chemoresistance, gene expression signatures, FOLFIRI, FOLFOX, EGFR inhibitors, tumor subtypes, drug response prediction, immune cell infiltration, microsatellite instability, epithelial-mesenchymal transition, gut microbiota, prognosis, single-cell RNA sequencing, bulk RNA-seq
About these checks
Registry, retraction, Cites and statistics results are computed, not judged, with one exception: a printed reference that no index lists is read once by a model before it counts as a citation error. Claims are extracted by a model and kept only when their quote appears verbatim in the text; each cited source is then checked, with a model’s help, for whether it says what the claim relies on. Those verdicts can be wrong — read the claim’s quote and the cited source before relying on one.
The claim verdicts this report counts are experimental: their accuracy is not yet measured.
A language model drew the claims from the paper on 2026-10-10, under version 3 of the claim definition (model deepseek-v4.1-flash, prompt extract-v3).
A second model labelled each claim on 2026-10-10 (model jev-1.13-20260917, definition revision gold-guideline-v0.2).
Cited sources are checked with a language model’s help (qwen3.8-omni-flash and gpt-6-sol).
Statistics and arithmetic are recomputed, not judged.
Confidence bands are shown only for fields calibrated on our annotated test set. None is calibrated yet, so no band is shown.
What counts as a claim ›How we measure confidence ›How we check this ›
Are you an author, or do you see a problem with this page? Request a review
How to cite
Cite CoChat for the checks on this page, and the paper for its own findings.
- This page
- CoChat. (2026). Citation check: A tumor microenvironment-specific gene expression signature predicts chemotherapy resistance in colorectal cancer patients. https://app.cochat.ai/papers/10.1038/s41698-021-00142-x
- The paper
- Zhu, X., Tian, X., Ji, L., Zhang, X., Cao, Y., Shen, C., Hu, Y., Wong, J. W. H., Fang, J.-Y., Hong, J., & Chen, H. (2021). A tumor microenvironment-specific gene expression signature predicts chemotherapy resistance in colorectal cancer patients. npj Precision Oncology. https://doi.org/10.1038/s41698-021-00142-x
Data sources
Bibliographic data: Semantic Scholar, OpenAlex, Crossref.
Contains information from the Semantic Scholar Academic Graph Datasets, made available under the ODC Attribution License (ODC-BY 1.0).
Semantic Scholar’s data is described in: Kinney, R., et al. (2023). The Semantic Scholar Open Data Platform. arXiv:2301.10140.
