

The DOI matches its Crossref record; 39 of the 39 references it cites were found in a registry or an index.
Prostate cancer therapy personalization via multi-modal deep learning on randomized phase III clinical trials
Open accessPublished version of a preprint
Abstract
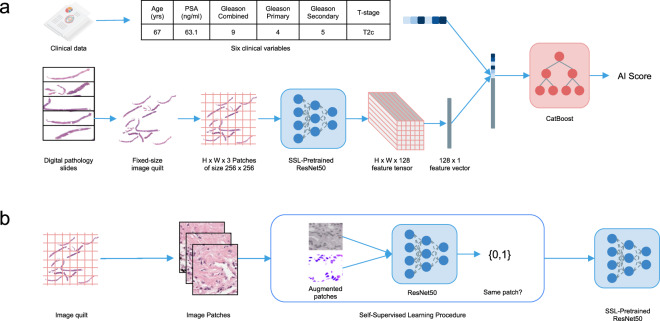
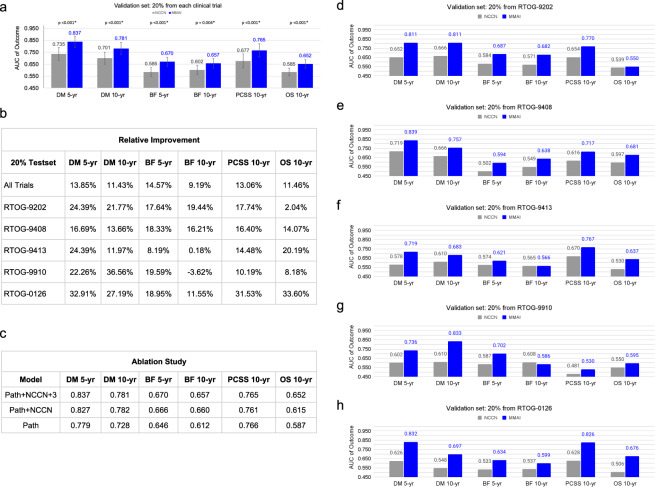
Prostate cancer is the most frequent cancer in men and a leading cause of cancer death. Determining a patient's optimal therapy is a challenge, where oncologists must select a therapy with the highest likelihood of success and the lowest likelihood of toxicity. International standards for prognostication rely on non-specific and semi-quantitative tools, commonly leading to over- and under-treatment. Tissue-based molecular biomarkers have attempted to address this, but most have limited validation in prospective randomized trials and expensive processing costs, posing substantial barriers to widespread adoption. There remains a significant need for accurate and scalable tools to support therapy personalization. Here we demonstrate prostate cancer therapy personalization by predicting long-term, clinically relevant outcomes using a multimodal deep learning architecture and train models using clinical data and digital histopathology from prostate biopsies. We train and validate models using five phase III randomized trials conducted across hundreds of clinical centers. Histopathological data was available for 5654 of 7764 randomized patients (71%) with a median follow-up of 11.4 years. Compared to the most common risk-stratification tool-risk groups developed by the National Cancer Center Network (NCCN)-our models have superior discriminatory performance across all endpoints, ranging from 9.2% to 14.6% relative improvement in a held-out validation set. This artificial intelligence-based tool improves prognostication over standard tools and allows oncologists to computationally predict the likeliest outcomes of specific patients to determine optimal treatment. Outfitted with digital scanners and internet access, any clinic could offer such capabilities, enabling global access to therapy personalization.
Overview
The claims and statistics of this paper haven’t been checked yet.
Run the check — free, no account needed. It reads the open-access text and checks the sources it cites.
Integrity signals
Registry
Cites
Statistics
Figures
Verification
Claims the paper makes
The claims and statistics of this paper haven’t been checked yet.
Run the check — free, no account needed. It reads the open-access text and checks the sources it cites.
Claims other papers make about this one
Each is checked against this paper’s own text: does it say what the citing paper says it does?
The source backs part of the claim, not all of it — or backs it for a different population, condition or comparison.
In the citing paper
“Compared to the unimodal imaging model, the multimodal obtained a notably higher AUC of 0.837 vs. 0.779 for predicting distant metastasis after 5 years.”
From Navigating the landscape of multimodal AI in medicine: A scoping review on technical challenges and clinical applications (2025) · cites this paper as Esteva et al., 2022
Experimental — accuracy not yet measuredThe cited source says what the claim attributes to it.
In the citing paper
“First, Esteva et al. (2022) describes a multimodal model that integrates digital pathology slides and clinical variables for risk stratification in prostate cancer.”
From Navigating the landscape of multimodal AI in medicine: A scoping review on technical challenges and clinical applications (2025) · cites this paper as Esteva et al., 2022
The cited source says what the claim attributes to it.
In the citing paper
“Specifically, the model employs a ResNet50 pretrained in a self-supervised manner to extract a feature vector from the pathology slides and subsequently concatenates this image feature vector with a clinical variable vector for the final prediction.”
From Navigating the landscape of multimodal AI in medicine: A scoping review on technical challenges and clinical applications (2025) · cites this paper as Esteva et al., 2022
In the citing paper
“AI company ArteraAI has developed and tested a multimodal AI approach (113, 114) that uses histology images and clinical data to predict prostate cancer prognosis.”
From Artificial Intelligence in Oncology: Current Landscape, Challenges, and Future Directions (2024) · cites this paper as [113]
Self-check
Percentages, sums and reported differences re-computed from the paper’s own numbers.
The self-check needs the paper’s full text.
Citations
Cites
Deep Residual Learning for Image Recognition
He, K., Zhang, X., Ren, S., & Sun, J. (2016) · 2016 IEEE Conference on Computer Vision and Pattern Recognition (CVPR) · doi:10.1109/cvpr.2016.90 · Cited by 235,474
Sung, H., Ferlay, J., Siegel, R. L., Laversanne, M., Soerjomataram, I., Jemal, A., & Bray, F. (2021) · CA: A Cancer Journal for Clinicians · doi:10.3322/caac.21660 · Cited by 108,699
Dermatologist-level classification of skin cancer with deep neural networks
Esteva, A., Kuprel, B., Novoa, R. A., Ko, J., Swetter, S. M., Blau, H. M., & Thrun, S. (2017) · Nature · doi:10.1038/nature21056 · Cited by 14,362
Momentum Contrast for Unsupervised Visual Representation Learning
He, K., Fan, H., Wu, Y., Xie, S., & Girshick, R. (2020) · 2020 IEEE/CVF Conference on Computer Vision and Pattern Recognition (CVPR) · doi:10.1109/cvpr42600.2020.00975 · Cited by 13,347
UMAP: Uniform Manifold Approximation and Projection for Dimension Reduction
McInnes, L., Healy, J., & Melville, J. (2018) · arXiv · doi:10.48550/arxiv.1802.03426 · Cited by 7,101
Improved Baselines with Momentum Contrastive LearningPreprint
Chen, X., Fan, H., Girshick, R., & He, K. (2020) · arXiv (Cornell University) · doi:10.48550/arxiv.2003.04297 · Cited by 3,497
CatBoost: unbiased boosting with categorical featuresPreprint
Prokhorenkova, L., Gusev, G., Vorobev, A., Dorogush, A. V., & Gulin, A. (2017) · arXiv (Cornell University) · doi:10.48550/arxiv.1706.09516 · Cited by 3,041
Djavan, B., Waldert, M., Zlotta, A. R., Dobroński, P., Seitz, C., Mesut Remzi, A., BORKOWSKI, A., Schulman, C., & Marberger, M. (2001) · The Journal of Urology · doi:10.1016/s0022-5347(05)65851-x · Cited by 2,048
Self-Supervised Visual Feature Learning With Deep Neural Networks: A Survey
Jing, L., & Tian, Y. (2021) · IEEE Transactions on Pattern Analysis and Machine Intelligence · doi:10.1109/tpami.2020.2992393 · Cited by 2,036
Blanche, P., Dartigues, J., & Jacqmin‐Gadda, H. (2013) · Statistics in Medicine · doi:10.1002/sim.5958 · Cited by 1,917
Deep learning in histopathology: the path to the clinic
van der Laak, J., Litjens, G., & Ciompi, F. (2021) · Nature Medicine · doi:10.1038/s41591-021-01343-4 · Cited by 902
Bulten, W., Pinckaers, H., van Boven, H., Vink, R., de Bel, T., van Ginneken, B., van der Laak, J., Hulsbergen-van de Kaa, C., & Litjens, G. (2020) · The Lancet Oncology · doi:10.1016/s1470-2045(19)30739-9 · Cited by 705
Radiotherapy and Short-Term Androgen Deprivation for Localized Prostate Cancer
Jones, C. U., Hunt, D. L., McGowan, D. G., Amin, M. B., CHETNER, M. P., Bruner, D. W., Leibenhaut, M. H., Husain, S. M., Rotman, M. Z., Souhami, L., et al. (2011) · New England Journal of Medicine · doi:10.1056/nejmoa1012348 · Cited by 696
Horwitz, E. M., Bae, K., Hanks, G. E., Porter, A. T., Grignon, D. J., Brereton, H. D., Venkatesan, V., Lawton, C. A., Rosenthal, S. A., Sandler, H. M., et al. (2008) · Journal of Clinical Oncology · doi:10.1200/jco.2007.14.9021 · Cited by 687
Roach, M., DeSilvio, M., Lawton, C. A., Uhl, V., Machtay, M. X., Seider, M. J., Rotman, M., Jones, C. U., Asbell, S. O., Valicenti, R. K., et al. (2003) · Journal of Clinical Oncology · doi:10.1200/jco.2003.05.004 · Cited by 634
Beede, E., Baylor, E., Hersch, F., Iurchenko, A., Wilcox, L., Ruamviboonsuk, P., & Vardoulakis, L. M. (2020) · Proceedings of the 2020 CHI Conference on Human Factors in Computing Systems · doi:10.1145/3313831.3376718 · Cited by 614
NCCN Guidelines Insights: Prostate Cancer, Version 1.2021
Schaeffer, E. M., Srinivas, S., Antonarakis, E. S., Armstrong, A. J., Bekelman, J. E., Cheng, H. H., D'Amico, A. V., Davis, B. J., Desai, N. B., Dorff, T. B., et al. (2021) · Journal of the National Comprehensive Cancer Network · doi:10.6004/jnccn.2021.0008 · Cited by 529
Artificial intelligence for clinical oncology
Kann, B. H., Hosny, A., & Aerts, H. J. W. L. (2021) · Cancer Cell · doi:10.1016/j.ccell.2021.04.002 · Cited by 404
Interobserver reproducibility of Gleason grading of prostatic carcinoma: General pathologist
Allsbrook, W. C., Mangold, K. A., Johnson, M. H., Lane, R. B., Lane, C. G., & Epstein, J. I. (2001) · Human Pathology · doi:10.1053/hupa.2001.21135 · Cited by 380
Michalski, J. M., Moughan, J., Purdy, J. A., Bosch, W. R., Bruner, D. W., Bahary, J.-P., Lau, H., Duclos, M., Parliament, M. B., Morton, G., et al. (2018) · JAMA Oncology · doi:10.1001/jamaoncol.2018.0039 · Cited by 357
Interobserver reproducibility of Gleason grading of prostatic carcinoma: Urologic pathologists
Allsbrook, W. C., Mangold, K. A., Johnson, M. H., Lane, R. B., Lane, C. G., Amin, M. B., Bostwick, D. G., Humphrey, P. A., Jones, E. C., Reuter, V. E., et al. (2001) · Human Pathology · doi:10.1053/hupa.2001.21134 · Cited by 334
Ward, E., Sherman, R., Henley, S. J., Jemal, A., Siegel, D. A., Feuer, E. J., Firth, A. U., Kohler, B., Scott, S., Ma, J., et al. (2019) · JNCI Journal of the National Cancer Institute · doi:10.1093/jnci/djz106 · Cited by 324
NCCN Guidelines Updates: Prostate Cancer and Prostate Cancer Early Detection
Carroll, P. R., & Mohler, J. L. (2018) · Journal of the National Comprehensive Cancer Network · doi:10.6004/jnccn.2018.0036 · Cited by 282
Naik, N., Madani, A., Esteva, A., Keskar, N. S., Press, M. F., Ruderman, D., Agus, D. B., & Socher, R. (2020) · Nature Communications · doi:10.1038/s41467-020-19334-3 · Cited by 262
Interpretable survival prediction for colorectal cancer using deep learning
Wulczyn, E., Steiner, D. F., Moran, M., Plass, M., Reihs, R., Tan, F., Flament-Auvigne, I., Brown, T., Regitnig, P., Chen, P.-H. C., et al. (2021) · npj Digital Medicine · doi:10.1038/s41746-021-00427-2 · Cited by 231
Nagpal, K., Foote, D., Tan, F. E., Liu, Y., Chen, P.-H. C., Steiner, D. F., Manoj, N. S., Olson, N. H., Smith, J. L., Mohtashamian, A., et al. (2020) · JAMA Oncology · doi:10.1001/jamaoncol.2020.2485 · Cited by 226
Spratt, D. E., Zhang, J., Santiago‐Jiménez, M., Dess, R. T., Davis, J. W., Den, R. B., Dicker, A. P., Kane, C. J., Pollack, A. S., Stoyanova, R. S., et al. (2017) · Journal of Clinical Oncology · doi:10.1200/jco.2017.74.2940 · Cited by 211
Decipher Genomic Classifier Measured on Prostate Biopsy Predicts Metastasis Risk
Klein, E. A., Haddad, Z., Yousefi, K., Lam, L. L. C., Wang, Q., Choeurng, V., Palmer-Aronsten, B., Buerki, C., Davicioni, E., Li, J., et al. (2016) · Urology · doi:10.1016/j.urology.2016.01.012 · Cited by 165
Artificial intelligence in cancer therapy
Ho, D. (2020) · Science · doi:10.1126/science.aaz3023 · Cited by 164
Pisansky, T. M., Hunt, D. L., Gomella, L. G., Amin, M. B., Balogh, A. G., Chinn, D. M., Seider, M. J., Duclos, M., Rosenthal, S. A., Bauman, G. S., et al. (2014) · Journal of Clinical Oncology · doi:10.1200/jco.2014.58.0662 · Cited by 140
The evolving Gleason grading system.
Chen, N., & Zhou, Q. (2016) · PubMed · doi:10.3978/j.issn.1000-9604.2016.02.04 · Cited by 120
Analysing differences between algorithm configurations through ablation
Fawcett, C., & Hoos, H. H. (2015) · Journal of Heuristics · doi:10.1007/s10732-014-9275-9 · Cited by 114
Gaudreau, P.-O., Stagg, J., Soulières, D., & Fred Saad, C. (2016) · Biomarkers in Cancer · doi:10.4137/bic.s31802 · Cited by 98
Chen, X., Ye, G., Zhang, C., Li, X., & Shen, K. (2016) · Chinese Journal of Cancer Research · doi:10.21147/j.issn.1000-9604.2016.06.02 · Cited by 66
Predicting prostate cancer specific-mortality with artificial intelligence-based Gleason grading
Wulczyn, E., Nagpal, K., Symonds, M., Moran, M., Plass, M., Reihs, R., Nader, F., Tan, F., Cai, Y., Brown, T., et al. (2021) · Communications Medicine · doi:10.1038/s43856-021-00005-3 · Cited by 56
Genomic biomarkers in prostate cancer
Kornberg, Z., Cooperberg, M. R., Spratt, D. E., & Feng, F. Y.-C. (2018) · Translational Andrology and Urology · doi:10.21037/tau.2018.06.02 · Cited by 42
Daskivich, T. J., Wood, L. N., Skarecky, D. W., Ahlering, T. E., & Freedland, S. J. (2016) · The Journal of Urology · doi:10.1016/j.juro.2016.08.096 · Cited by 16
Cancer Treatment by Caryophyllaceae-Type Cyclopeptides
Tehrani, M. H. H., Gholibeikian, M., Bamoniri, A., & Mirjalili, B. B. F. (2021) · Frontiers in Endocrinology · doi:10.3389/fendo.2020.600856 · Cited by 15
Molecular Biomarkers in Localized Prostate Cancer: ASCO Guideline Summary
Eggener, S. E., Rumble, R. B., & Beltran, H. (2020) · JCO Oncology Practice · doi:10.1200/jop.19.00752 · Cited by 11
Cited by
Sorted by citations
Swanson, K., Wu, E., Zhang, A., Alizadeh, A. A., & Zou, J. (2023) · Cell · doi:10.1016/j.cell.2023.01.035 · Cited by 597
Huang, S.-C., Pareek, A., Jensen, M., Lungren, M. P., Yeung, S., & Chaudhari, A. S. (2023) · npj Digital Medicine · doi:10.1038/s41746-023-00811-0 · Cited by 479
“In recent years, deep learning models have demonstrated diagnostic accuracy comparable to that of human experts in narrow clinical tasks for several medical domains and imaging modalities, including chest and extremity X-rays 8 – 10 , computed tomography (CT) 11 , magnetic resonance imaging (MRI) 12 , whole slide imag…”
BackgroundMethodProstate Cancer, Version 3.2024
Schaeffer, E. M., Srinivas, S., Adra, N., An, Y., Bitting, R. L., Chapin, B. F., Cheng, H. H., D'Amico, A. V., Desai, N. B., Dorff, T. B., et al. (2024) · Journal of the National Comprehensive Cancer Network · doi:10.6004/jnccn.2024.0019 · Cited by 318
Artificial Intelligence in Oncology: Current Landscape, Challenges, and Future Directions
Lotter, W., Hassett, M. J., Schultz, N., Kehl, K. L., Van Allen, E. M., & Cerami, E. (2024) · Cancer Discovery · doi:10.1158/2159-8290.cd-23-1199 · Cited by 196
Fountzilas, E., Pearce, T. E., Baysal, M. A., Chakraborty, A., & Tsimberidou, A. M. (2025) · npj Digital Medicine · doi:10.1038/s41746-025-01471-y · Cited by 233
Metadata
- Authors
- Esteva, A., Feng, J., van der Wal, D., Huang, S.-C., Simko, J. P., DeVries, S., Chen, E., Schaeffer, E. M., Morgan, T. M., Sun, Y., Ghorbani, A., Naik, N., Nathawani, D., Socher, R., Michalski, J. M., Roach, M., Pisansky, T. M., Monson, J. M., Naz, F., Wallace, J., Ferguson, M. J., Bahary, J.-P., Zou, J., Lungren, M., Yeung, S., Ross, A. E., NRG Prostate Cancer AI Consortium, Kucharczyk, M., Souhami, L., Ballas, L., Peters, C. A., Liu, S., Balogh, A. G., Randolph-Jackson, P. D., Schwartz, D. L., Girvigian, M. R., Saito, N. G., Raben, A., Rabinovitch, R. A., Katato, K., Sandler, H. M., Tran, P. T., Spratt, D. E., Pugh, S., Feng, F. Y., & Mohamad, O.
- Affiliations
- University of California, San Francisco (US)
- Stanford University (US)
- NRG Oncology (US)
- Northwestern University (US)
- University of Michigan (US)
- Case Western Reserve University (US)
- Salesforce (United States) (US)
- Washington University in St. Louis (US)
- Mayo Clinic (US)
- California Cancer Associates for Research and Excellence (US)
- Saint John Regional Hospital (CA)
- Ingalls Memorial Hospital (US)
- Centre Hospitalier de l’Université de Montréal (CA)
- Nova Scotia Cancer Centre (CA)
- University of Southern California (US)
- Northeast Radiation Oncology Center (US)
- Ronald Reagan UCLA Medical Center (US)
- VA NY Harbor Healthcare System (US)
- Kaiser Permanente (US)
- Indiana University School of Medicine (US)
- Christiana Care Health System (US)
- University of Colorado Hospital (US)
- Hurley Medical Center (US)
- Cedars-Sinai Medical Center (US)
- University of Maryland, Baltimore (US)
- University Hospitals Seidman Cancer Center (US)
- Corresponding author
- Esteva, Andre
- ORCID
- Esteva, Andre
- Feng, Jean
- Huang, Shih-Cheng
- Chen, Emmalyn
- Schaeffer, Edward M.
- Morgan, Todd M.
- Sun, Yilun
- Ghorbani, Amirata
- Naik, Nikhil
- Nathawani, Dhruv
- Socher, Richard
- Michalski, Jeff M.
- Roach, Mack
- Pisansky, Thomas M.
- Naz, Farah
- Wallace, James
- Bahary, Jean-Paul
- Zou, James
- Lungren, Matthew
- Yeung, Serena
- Ross, Ashley E.
- Kucharczyk, Michael
- Ballas, Leslie
- Liu, Sandy
- Schwartz, David L.
- Girvigian, Michael R.
- Saito, Naoyuki G.
- Raben, Adam
- Rabinovitch, Rachel A.
- Sandler, Howard M.
- Tran, Phuoc T.
- Spratt, Daniel E.
- Pugh, Stephanie
- Feng, Felix Y.
- Mohamad, Osama
- Venue
- npj Digital Medicine
- Published
- 2022-06-08
- Volume
- 5
- Issue
- 1
- Pages
- 71-71
- ISSN
- 2398-6352 (ISSN-L)
- PMC
- PMC9177850
- OpenAlex
- W4282942659
- Cited by
- 217
- References
- 39
- Citations by year
- 2026: 58 · 2025: 85 · 2024: 44 · 2023: 26 · 2022: 4
- FWCI
- 22.55
- Type
- journal article
- Language
- en
- Update notices
- correction (2023-02-22)
- Open access
- gold
- doi.org
- Locations
- npj Digital Medicine (publishedVersion, cc-by)
- Research Square (acceptedVersion, cc-by)
- PubMed Central (publishedVersion, cc-by)
- PubMed (publishedVersion)
- Digital Commons@Becker (Washington University School of Medicine) (submittedVersion, cc-by)
- DOAJ (DOAJ: Directory of Open Access Journals) (submittedVersion)
- eScholarship (California Digital Library) (submittedVersion, cc-by)
- Funders
- NRG Oncology (U24CA196067, U10 CA180822, UG1CA189867, U10CA180868)
- National Cancer Institute (UG1CA189867, U10CA180868, U24CA196067, U10CA180822)
- Topics
- Health Sciences › Medicine › Radiology, Nuclear Medicine and Imaging › Radiomics and Machine Learning in Medical Imaging
- Physical Sciences › Computer Science › Artificial Intelligence › AI in cancer detection
- Health Sciences › Medicine › Urology › Prostate Cancer Diagnosis and Treatment
- Keywords
- prostate cancer, multimodal deep learning, digital histopathology, prostate biopsy, outcome prediction, risk stratification, NCCN risk classification, long-term clinical outcomes, treatment selection
About these checks
Registry, retraction, Cites and statistics results are computed, not judged, with one exception: a printed reference that no index lists is read once by a model before it counts as a citation error. Claims are extracted by a model and kept only when their quote appears verbatim in the text; each cited source is then checked, with a model’s help, for whether it says what the claim relies on. Those verdicts can be wrong — read the claim’s quote and the cited source before relying on one.
Statistics and arithmetic are recomputed, not judged.
Confidence bands are shown only for fields calibrated on our annotated test set. None is calibrated yet, so no band is shown.
What counts as a claim ›How we measure confidence ›How we check this ›
Are you an author, or do you see a problem with this page? Request a review
