

The DOI matches its Crossref record; 84 of the 84 references it cites were found in a registry or an index; 3 of the 33 sources its claims cite were checked for support.
Digital health technologies and machine learning augment patient reported outcomes to remotely characterise rheumatoid arthritis
Open accessPublished version of a preprint
Abstract
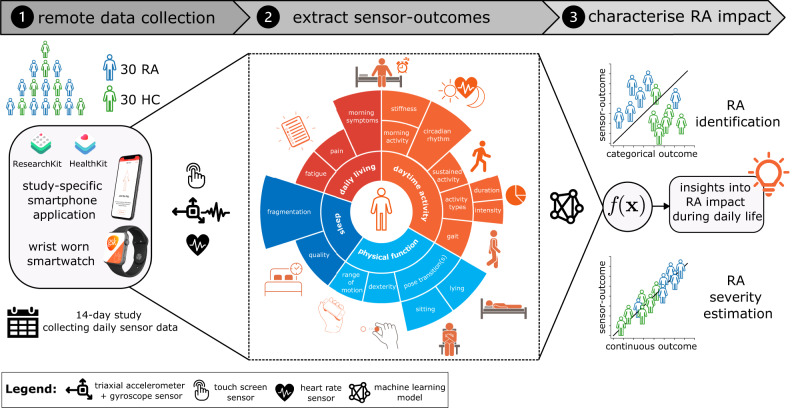
Digital measures of health status captured during daily life could greatly augment current in-clinic assessments for rheumatoid arthritis (RA), to enable better assessment of disease progression and impact. This work presents results from weaRAble-PRO, a 14-day observational study, which aimed to investigate how digital health technologies (DHT), such as smartphones and wearables, could augment patient reported outcomes (PRO) to determine RA status and severity in a study of 30 moderate-to-severe RA patients, compared to 30 matched healthy controls (HC). Sensor-based measures of health status, mobility, dexterity, fatigue, and other RA specific symptoms were extracted from daily iPhone guided tests (GT), as well as actigraphy and heart rate sensor data, which was passively recorded from patients’ Apple smartwatch continuously over the study duration. We subsequently developed a machine learning (ML) framework to distinguish RA status and to estimate RA severity. It was found that daily wearable sensor-outcomes robustly distinguished RA from HC participants (F1, 0.807). Furthermore, by day 7 of the study (half-way), a sufficient volume of data had been collected to reliably capture the characteristics of RA participants. In addition, we observed that the detection of RA severity levels could be improved by augmenting standard patient reported outcomes with sensor-based features (F1, 0.833) in comparison to using PRO assessments alone (F1, 0.759), and that the combination of modalities could reliability measure continuous RA severity, as determined by the clinician-assessed RAPID-3 score at baseline ( r 2 , 0.692; RMSE, 1.33). The ability to measure the impact of the disease during daily life—through objective and remote digital outcomes—paves the way forward to enable the development of more patient-centric and personalised measurements for use in RA clinical trials.
Overview
CoChat Summary
TL;DR
In a 14-day observational study, smartphone guided tests and smartwatch passive monitoring distinguished rheumatoid arthritis (RA) participants from healthy controls and augmented patient-reported outcomes to estimate RA severity. Combining active and passive sensor features improved RA identification and severity estimation, with sufficient data by day 7.
Key findings
- Combined active + passive wearable sensor features best distinguished RA from healthy controls (F1, 0.807), compared with passive-only (F1, 0.786) or active-only (F1, 0.778) features.
- RA severity level estimation improved when PROs were augmented with both active and passive sensor outcomes (F1, 0.833) versus PRO assessments alone (F1, 0.759).
- PRO + sensor-based features estimated continuous clinician-assessed RAPID-3 scores with r² = 0.692 and RMSE = 1.33, improving on PRO measures alone (r² = 0.63; RMSE = 1.45).
- By day 7 of the 14-day study, enough data had been collected to reliably capture RA characteristics; model performance and feature reliability stabilised after more than 7 days.
Methods
- Design: 14-day observational study (weaRAble-PRO) with 30 moderate-to-severe RA patients and 30 matched healthy controls; after two RA withdrawals, 28 RA participants, 28 matched HCs, and 2 unmatched HCs remained (total 58).
- Data: daily iPhone guided tests (wrist range of motion, 30-second walking, nine-hole peg test, sit-to-stand, lie-to-stand), continuous Apple Watch actigraphy, and PROs recorded on days 1, 7, and 14.
- Analysis: machine learning framework using a DCNN pretrained with self-supervised learning on UK Biobank data and fine-tuned on Capture-24, plus an HMM; regularised logistic regression, random forest, and XGBoost compared with stratified subject-wise 5-fold cross-validation; metrics included F1, AUROC, Cohen’s kappa, r², MAE, RMSE, and ICC.
Limitations
- The paper states a relatively small sample size (HC, n = 30; RA, n = 30), causing variability and uncertainty in cross-validated models; extrapolation to general RA populations requires larger cohorts and further external validation.
- The paper states that only moderate-to-severe RA patients were recruited, so lower disease activity or remission was not characterised.
- The paper notes that RAPID-3 was assessed at baseline with recall of the prior week, while PRO and sensor features were averaged over the subsequent 14 days, and that PRO predictors are subjective; evident from the text, the study is a single cohort without external validation beyond the internal JMAP inspection.
Model-written summary. Check it against the paper before relying on it.
Integrity signals
Registry
Cites
Statistics
Figures


Verification
Claims the paper makes
2 Valid · 1 Not valid · 20 Not checked · 58 Own results and interpretations
The cited sources support only part of this claim — read each source’s verdict below.
In the paper
“It was found that the “DCNN (SSL) + HMM” improved broad activity estimation in Capture-24 (κ, 0.862 ± 0.088; F1, 0.815 ± 0.103) as compared to a baseline random forest (RF) + HMM approach (κ, 0.813 ± 0.108; F1, 0.775 ± 0.117)28.”
§ Digital health technologies and machine learning augment patient reported outcomes to remotely characterise rheumatoid arthritis > Results > Assessing smartwatch-based daily physical activity patterns
What the sources say
- Partly supportedcites [28] Willetts, M., Hollowell, S., Aslett, L., Holmes, C. & Doherty, A. Statistical machine learning of sleep and physical activity phenotypes from sensor data in 96,220 uk biobank participants. Scientific reports 8, 1–10 (2018). sourceExperimental — accuracy not yet measured
Our copy of Willetts et al. (2018) reports only a balanced random forest with HMM time smoothing evaluated on the 132 Capture-24 participants, achieving mean accuracy 87% and kappa = 0.81 (Results, para. 1; Discussion, 'The overall classification score of kappa = 0.81 for our method'), with base RF kappa 0.69 rising to 0.81 with the HMM (Results/Table S1). That covers the RF + HMM baseline side of the claim (kappa ~0.813), but the paper contains no deep convolutional neural network, no semi-supervised learning, no F1 scores and no per-subject SDs, so the attributed improvement of 'DCNN (SSL) + HMM' over the RF baseline (kappa 0.862, F1 0.815) is not in this source. Searches for 'DCNN', 'deep neural network', 'semi-supervised' and 'F1' returned only random-forest/HMM passages. (LLM, conf=0.72)
plainstates a causen = 150- Asserted: passes — The authors put it forward as true.
- Checkable: passes — It can be checked against evidence.
- Load-bearing: passes — The paper’s conclusions depend on it.
- Based: passes — The paper gives a reason why it holds.
- Partly supported
A result the paper reports from its own data — it cites no other source for it, so there is none to check. The quote shows it is in the paper.
In the paper
“However, it was observed that model performance using weekly-averaged features was often similar to fortnightly averaged (we also refer the reader to Supplementary Table 4).”
§ Digital health technologies and machine learning augment patient reported outcomes to remotely characterise rheumatoid arthritis > Results > Estimating the volume of days and number of sensor-outcomes required to remotely distinguish RA status
hedged- Asserted: passes — The authors put it forward as true.
- Checkable: passes — It can be checked against evidence.
- Load-bearing: unclear — It is unclear whether the paper’s conclusions depend on it.
- Based: passes — The paper gives a reason why it holds.
A result the paper reports from its own data — it cites no other source for it, so there is none to check. The quote shows it is in the paper.
In the paper
“It was observed that the linear combination of PRO assessments could accurately stratify RA symptom severity (F1, 0.759).”
§ Digital health technologies and machine learning augment patient reported outcomes to remotely characterise rheumatoid arthritis > Results > Analysis of sensor-outcomes to distinguish RA status and severity levels
hedgedstates an association- Asserted: passes — The authors put it forward as true.
- Checkable: passes — It can be checked against evidence.
- Load-bearing: passes — The paper’s conclusions depend on it.
- Based: passes — The paper gives a reason why it holds.
A result the paper reports from its own data — it cites no other source for it, so there is none to check. The quote shows it is in the paper.
In the paper
“A further 47 (34%) passive features, compared to 6 (24%) active features, were also significantly different (Mann-Whitney U test, p < 0.05) between healthy and RA participants.”
§ Digital health technologies and machine learning augment patient reported outcomes to remotely characterise rheumatoid arthritis > Results > Analysis of sensor-outcomes to distinguish RA status and severity levels
plainstates an association- Asserted: passes — The authors put it forward as true.
- Checkable: passes — It can be checked against evidence.
- Load-bearing: passes — The paper’s conclusions depend on it.
- Based: passes — The paper gives a reason why it holds.
A result the paper reports from its own data — it cites no other source for it, so there is none to check. The quote shows it is in the paper.
In the paper
“Furthermore, we found that averaging daily feature values over weekly and fortnightly periods improved model performance.”
§ Digital health technologies and machine learning augment patient reported outcomes to remotely characterise rheumatoid arthritis > Results > Estimating the volume of days and number of sensor-outcomes required to remotely distinguish RA status
plainstates a cause- Asserted: passes — The authors put it forward as true.
- Checkable: passes — It can be checked against evidence.
- Load-bearing: passes — The paper’s conclusions depend on it.
- Based: passes — The paper gives a reason why it holds.
43 more claims
Create a free account to see all 81 claims and to verify the 30 references still open.
- Probably not a substantial claim. 22
- It may state two separate claims as one. 18
- The quote only partly states this claim. 1
Claims other papers make about this one
Each is checked against this paper’s own text: does it say what the citing paper says it does?
In the citing paper
“Self-supervised pre-training has been shown to help classify human activity recognition not just in healthy but clinical populations35.”
From Self-supervised learning of accelerometer data provides new insights for sleep and its association with mortality (2024) · cites this paper as [35]
Self-check
Percentages, sums and reported differences re-computed from the paper’s own numbers.
Each contradiction between two passages listed here was confirmed by an independent check.
Rated major: it would touch a result — a value a result rests on, reported and recomputed p-values on opposite sides of the significance level, two passages that conflict with no sign which is right, or a cited work retracted before this paper was published.
In the paper
“Through multivariate modelling, using LR elastic-net, it was determined that PRO and sensor-based features could accurately estimate RAPID-3 scores to within 1 point (r2, 0.69; MAE, 0.94; RMSE, 1.33)”
§ Digital health technologies and machine learning augment patient reported outcomes to remotely characterise rheumatoid arthritis > Results > Estimating in-clinic RA severity scores from PRO and sensor-based outcomes
Reported 0.69 · recomputed 0.36
Rated minor: it would not touch a result — a value no result rests on, a p-value that stays on the same side of the significance level, or a conflict that is clerical, resolved elsewhere in the paper, or outside its own findings.
In the paper
§ Digital health technologies and machine learning augment patient reported outcomes to remotely characterise rheumatoid arthritis > Methods > Dataset
“| RAPID-3 | 0 ± 0 | 3.2 ± 0.7 | 5.3 ± 1.1 | < 0.001 |”
§ Digital health technologies and machine learning augment patient reported outcomes to remotely characterise rheumatoid arthritis > Methods > Dataset
“bRA participants with baseline RAPID-3: 6.1–12. cRA participants with baseline RAPID-3: > 12;”
Rated minor: it would not touch a result — a value no result rests on, a p-value that stays on the same side of the significance level, or a conflict that is clerical, resolved elsewhere in the paper, or outside its own findings.
In the paper
§ Digital health technologies and machine learning augment patient reported outcomes to remotely characterise rheumatoid arthritis > Results > Estimating the volume of days and number of sensor-outcomes required to remotely distinguish RA status
“Intra-rater reliability analyses suggest that feature reliability stabilises to good (ICC=0.75–0.9) and excellent (ICC > 0.9) once more than 7 contiguous days of data were used per participant.”
§ Digital health technologies and machine learning augment patient reported outcomes to remotely characterise rheumatoid arthritis > Results > Estimating the volume of days and number of sensor-outcomes required to remotely distinguish RA status
“ICC’s for HCs ranged from 0.582 to 0.854, while those for RA participants ranged from 0.424 to 0.897.”
Rated minor: it would not touch a result — a value no result rests on, a p-value that stays on the same side of the significance level, or a conflict that is clerical, resolved elsewhere in the paper, or outside its own findings.
In the paper
§ Digital health technologies and machine learning augment patient reported outcomes to remotely characterise rheumatoid arthritis > Results > Analysis of sensor-outcomes to distinguish RA status and severity levels
“The fusion of PRO data and sensor-based outcomes improved RA severity level estimation further with the addition of active (F1, 0.750) or passive (F1, 0.786) sources.”
§ Digital health technologies and machine learning augment patient reported outcomes to remotely characterise rheumatoid arthritis > Results > Analysis of sensor-outcomes to distinguish RA status and severity levels
“It was observed that the linear combination of PRO assessments could accurately stratify RA symptom severity (F1, 0.759).”
Citations
Cites
Breiman, L. (2001) · Machine Learning · doi:10.1023/a:1010933404324 · Cited by 133,538
Controlling the False Discovery Rate: A Practical and Powerful Approach to Multiple Testing
Benjamini, Y., & Hochberg, Y. (1995) · Journal of the Royal Statistical Society Series B: Statistical Methodology · doi:10.1111/j.2517-6161.1995.tb02031.x · Cited by 109,482
XGBoost: A Scalable Tree Boosting System
Chen, T., & Guestrin, C. (2016) · Proceedings of the 22nd ACM SIGKDD International Conference on Knowledge Discovery and Data Mining · doi:10.1145/2939672.2939785 · Cited by 54,569
Regression shrinkage and selection via the lasso
Tibshirani, R. (1996) · Journal of the Royal Statistical Society Series B: Statistical Methodology · doi:10.1111/j.2517-6161.1996.tb02080.x · Cited by 51,482
A Coefficient of Agreement for Nominal Scales
Cohen, J. (1960) · Educational and Psychological Measurement · doi:10.1177/001316446002000104 · Cited by 42,398 · cited 1×
“Multi-class classi fi cation metrics were reported as the observation-wise median and interquartile (IQR) range over one CV, as well as the subject-wise outcome for that CV, using: auroc, area under the receiver operating characteristic curve; k , Cohen ’ s kappa statistic 54,55 ; F 1 , F1-score.”
MethodA guideline of selecting and reporting intraclass correlation coefficients for reliability research
Koo, T. K., & Li, M. Y. (2016) · Journal of Chiropractic Medicine · doi:10.1016/j.jcm.2016.02.012 · Cited by 31,709 · cited 1×
“Reliability was categorised as either poor (ICC < 0.5), moderate (ICC = 0.5 – 0.75), good (ICC = 0.75 – 0.9), or excellent (ICC > 0.9) 46 .”
InfluentialThe Elements of Statistical Learning
Hastie, T., Tibshirani, R., & Friedman, J. (2009) · Springer Series in Statistics · doi:10.1007/978-0-387-84858-7 · Cited by 25,970
Intraclass correlations: Uses in assessing rater reliability.
Shrout, P. E., & Fleiss, J. L. (1979) · Psychological Bulletin · doi:10.1037/0033-2909.86.2.420 · Cited by 24,532 · cited 1×
“In this work, the ICC (3, k ) was calculated 45 – which considers the two-way random average measures with k repeated measurements — for the 14-day session across subjects, where the raters k are the study days.”
MethodOn a Test of Whether one of Two Random Variables is Stochastically Larger than the Other
Mann, H. B., & Whitney, D. R. (1947) · The Annals of Mathematical Statistics · doi:10.1214/aoms/1177730491 · Cited by 14,320
Use of Ranks in One-Criterion Variance Analysis
Kruskal, W. H., & Wallis, W. A. (1952) · Journal of the American Statistical Association · doi:10.1080/01621459.1952.10483441 · Cited by 13,912 · cited 1×
“One-way analysis of variance (ANOVA) tests were also used to assess differences between medians of multiple groups, for example HC vs. RA (mod) vs. RA (sev) were assessed using the Kruskal-Wallis (KWt) test by ranks 41 .”
Method
Research works printed but not linked: 3
- Hollander, M., Wolfe, D. A. & Chicken, E. Nonparametric statistical methods, Vol. 751 (John Wiley & Sons, 2013).
- Gibbons, J. D. & Chakraborti, S. Nonparametric Statistical Inference: Revised and Expanded (CRC press, 2014).
- Portney, L. G. & Watkins, M. P. Foundations of clinical research: applications to practice, vol. 892 (Pearson/Prentice Hall Upper Saddle River, NJ, 2009).
Cited by
Self-supervised learning for human activity recognition using 700,000 person-days of wearable data
Yuan, H., Chan, S., Creagh, A. P., Tong, C., Acquah, A., Clifton, D. A., & Doherty, A. (2024) · npj Digital Medicine · doi:10.1038/s41746-024-01062-3 · Cited by 166
“The test performance for the AoT stayed at the random chance level, and the test performance for permutation dropped roughly 10 percentage points without weighted sampling.”
Self-citationArtificial intelligence for personalized nanomedicine; from material selection to patient outcomes
Mazumdar, H., Khondakar, K. R., Das, S., Halder, A., & Kaushik, A. (2025) · Expert Opinion on Drug Delivery · doi:10.1080/17425247.2024.2440618 · Cited by 159
Immune digital twins for complex human pathologies: applications, limitations, and challenges
Niarakis, A., Laubenbacher, R., An, G. C., Ilan, Y., Fisher, J., Flobak, Å., Reiche, K., Martínez, M. R., Geris, L., Ladeira, L., et al. (2024) · npj Systems Biology and Applications · doi:10.1038/s41540-024-00450-5 · Cited by 126
“Biosensors that can measure matrix degradation and bone erosion along with patient-reported outcomes and scores, could be used to assess the patient ’ s joint and bone health and monitor changes over time 84 .”
Olawade, D. B., Fidelis, S. C., Marinze, S., Egbon, E., Osunmakinde, A., & Osborne, A. (2025) · International Journal of Medical Informatics · doi:10.1016/j.ijmedinf.2025.106141 · Cited by 94
Chan, S., Hang, Y., Tong, C., Acquah, A., Schonfeldt, A., Gershuny, J., & Doherty, A. (2024) · Scientific Data · doi:10.1038/s41597-024-03960-3 · Cited by 61
“…convenient, allow us to efficiently obtain an objective and high-resolution picture of a user’s daily activities, enabling new opportunities for real-time precision medicine, digital phenotyping for routine care and clinical trials 1–3 , and large-scale population and epidemiological studies 4–6 .”
Self-citation
Metadata
- Authors
- Creagh, A. P., Hamy, V., Yuan, H., Mertes, G., Tomlinson, R., Chen, W.-H., Williams, R., Llop, C., Yee, C., Duh, M. S., Doherty, A., Garcia-Gancedo, L., & Clifton, D. A.
- Affiliations
- University of Oxford (GB)
- Analysis Group (United States) (US)
- Corresponding author
- Creagh, Andrew P.
- ORCID
- Venue
- npj Digital Medicine
- Published
- 2024-02-12
- Volume
- 7
- Issue
- 1
- Pages
- 33-33
- ISSN
- 2398-6352 (ISSN-L)
- PMC
- PMC10861520
- OpenAlex
- W4391751277
- Cited by
- 64
- References
- 82
- Citations by year
- 2026: 23 · 2025: 23 · 2024: 15
- FWCI
- 19.75
- Type
- journal article
- Language
- en
- Open access
- gold
- doi.org
- Licence
- cc-by
- creativecommons.org/licenses/by/4.0 (tdm)
- creativecommons.org/licenses/by/4.0 (vor)
- Locations
- npj Digital Medicine (publishedVersion, cc-by)
- medRxiv (acceptedVersion, cc-by-nd)
- PubMed Central (publishedVersion, cc-by)
- PubMed (publishedVersion)
- DOAJ (DOAJ: Directory of Open Access Journals) (submittedVersion, cc-by-sa)
- Funders
- GlaxoSmithKline
- Wellcome Trust (223100/Z/21/Z)
- National Institute for Health and Care Research
- Topics
- Health Sciences › Medicine › Rheumatology › Rheumatoid Arthritis Research and Therapies
- Health Sciences › Health Professions › General Health Professions › Mobile Health and mHealth Applications
- Physical Sciences › Computer Science › Computer Vision and Pattern Recognition › Context-Aware Activity Recognition Systems
- Keywords
- rheumatoid arthritis, patient-reported outcomes, digital health technologies, wearable sensors, smartphone health monitoring, actigraphy, heart rate monitoring, remote patient monitoring, fatigue, clinical trial outcome measures
About these checks
Registry, retraction, Cites and statistics results are computed, not judged, with one exception: a printed reference that no index lists is read once by a model before it counts as a citation error. Claims are extracted by a model and kept only when their quote appears verbatim in the text; each cited source is then checked, with a model’s help, for whether it says what the claim relies on. Those verdicts can be wrong — read the claim’s quote and the cited source before relying on one.
The claim verdicts this report counts are experimental: their accuracy is not yet measured.
A language model drew the claims from the paper on 2026-10-05, under version 3 of the claim definition (model deepseek-v4.1-flash, prompt extract-v3).
A second model labelled each claim on 2026-10-05 (model jev-1.13-20260917, definition revision gold-guideline-v0.2).
Cited sources are checked with a language model’s help (qwen3.8-omni-flash).
Statistics and arithmetic are recomputed, not judged.
Confidence bands are shown only for fields calibrated on our annotated test set. None is calibrated yet, so no band is shown.
What counts as a claim ›How we measure confidence ›How we check this ›
Are you an author, or do you see a problem with this page? Request a review
How to cite
Cite CoChat for the checks on this page, and the paper for its own findings.
- This page
- CoChat. (2026). Citation check: Digital health technologies and machine learning augment patient reported outcomes to remotely characterise rheumatoid arthritis. https://app.cochat.ai/papers/10.1038/s41746-024-01013-y
- The paper
- Creagh, A. P., Hamy, V., Yuan, H., Mertes, G., Tomlinson, R., Chen, W.-H., Williams, R., Llop, C., Yee, C., Duh, M. S., Doherty, A., Garcia-Gancedo, L., & Clifton, D. A. (2024). Digital health technologies and machine learning augment patient reported outcomes to remotely characterise rheumatoid arthritis. npj Digital Medicine. https://doi.org/10.1038/s41746-024-01013-y
Data sources
Bibliographic data: Semantic Scholar, OpenAlex, Crossref.
Contains information from the Semantic Scholar Academic Graph Datasets, made available under the ODC Attribution License (ODC-BY 1.0).
Semantic Scholar’s data is described in: Kinney, R., et al. (2023). The Semantic Scholar Open Data Platform. arXiv:2301.10140.
