

The DOI matches its Crossref record; 52 of the 54 references it cites were found in a registry or an index; 3 of the 7 sources its claims cite were checked for support.
Statistical machine learning of sleep and physical activity phenotypes from sensor data in 96,220 UK Biobank participants
Open accessPublished version of a preprint
Abstract
Current public health guidelines on physical activity and sleep duration are limited by a reliance on subjective self-reported evidence. Using data from simple wrist-worn activity monitors, we developed a tailored machine learning model, using balanced random forests with Hidden Markov Models, to reliably detect a number of activity modes. We show that physical activity and sleep behaviours can be classified with 87% accuracy in 159,504 minutes of recorded free-living behaviours from 132 adults. These trained models can be used to infer fine resolution activity patterns at the population scale in 96,220 participants. For example, we find that men spend more time in both low- and high- intensity behaviours, while women spend more time in mixed behaviours. Walking time is highest in spring and sleep time lowest during the summer. This work opens the possibility of future public health guidelines informed by the health consequences associated with specific, objectively measured, physical activity and sleep behaviours.
Overview
CoChat Summary
TL;DR
The paper develops a wrist-accelerometer machine-learning pipeline, trained on free-living ground truth from 132 adults, to classify six behaviors and estimate METs. Applied to 96,220 UK Biobank participants, it showed behavior patterns that aligned with self-reported traits such as chronotype, transport mode, occupation, age, and season.
Key findings
- In leave-one-subject-out validation on 132 participants, the activity model achieved a mean accuracy of 87% and kappa = 0.81 over 30-second windows; sleep/wake classification was the most robust.
- Adding hidden Markov model time smoothing improved overall classification from kappa = 0.69 to 0.81.
- For energy expenditure prediction, the model achieved RMSE = 1.75 MET hours/day with r = 0.85, outperforming random forests for regression on the same dataset (RMSE = 2.16, r = 0.81).
- In UK Biobank, several associations were reported, including: evening types were more likely to be sleeping at 8am on weekends (55% vs. 22%, p < 10^-100), car users were more likely to be classified as driving at 8am on weekdays (9.1% vs. 5.5%, p < 10^-100), and older adults (65+) were more likely to be walking at 11am on weekdays than those <55 (14% vs. 9%, p = 3 × 10^-18).
Methods
- Development/evaluation used the CAPTURE-24 study: 143 Oxford-region adults aged 18–91 recruited in 2014–2015; after removing 11 with missing or misaligned data, 132 participants remained for classifier development.
- Participants wore an Axivity AX3 wrist accelerometer at 100 Hz and a Vicon Autographer wearable camera; sleep was additionally labeled from a sleep diary and, when needed, a HETUS time-use diary.
- The analysis used balanced random forests on 126-dimensional features from non-overlapping 30-second windows, followed by a hidden Markov model and Viterbi decoding for temporal smoothing; performance was assessed with leave-one-subject-out cross-validation and kappa.
- The trained model was then applied to 103,712 UK Biobank participants; after exclusions for insufficient wear time and device errors, 96,220 participants were analyzed.
Limitations
- The paper states that the free-living training participants were not a random subsample of UK Biobank, so descriptive findings were not generalized to the UK population because UK Biobank was designed as an etiological study, not population surveillance.
- The paper notes that direct comparison across studies is difficult because of heterogeneity in populations, devices, and behavior definitions.
- Evident from the text: sleep and energy expenditure ground truth were not collected with traditional gold-standard methods; instead, the study relied on proxy reference methods (wearable camera, diaries) for free-living assessment at scale.
Model-written summary. Check it against the paper before relying on it.
Integrity signals
Registry
Cites
Statistics
Figures

Verification
Claims the paper makes
2 Valid · 1 Not valid · 3 Not checked · 30 Own results and interpretations
The cited sources support only part of this claim — read each source’s verdict below.
In the paper
“Our study shows that bicycling can be reliably detected from accelerometer data, an activity previously difficult to classify in laboratory studies 15 , 19 .”
What the sources say
- Supportedcites [15] Mannini, A., Intille, S. S., Rosenberger, M., Sabatini, A. M. & Haskell, W. Activity recognition using a single accelerometer placed at the wrist or ankle. Med. Sci. Sports Exerc. 45, 2193–203 (2013). source
The citation supports the background point that bicycling was difficult to classify: the Discussion says cycling was harder to detect than other activity classes from wrist accelerometer data in this laboratory-based study. The statement that bicycling can be reliably detected is framed as the citing authors’ own finding, not a finding attributed to this source. (LLM, conf=0.88)
- Partly supportedcites [19] Staudenmayer, J., Pober, D., Crouter, S., Bassett, D. & Freedson, P. An artificial neural network to estimate physical activity energy expenditure and identify physical activity type from an accelerometer. J. Appl. Physiol. 107, 1300–1307 (2009). sourceExperimental — accuracy not yet measured
The Discussion (page unavailable) describes stationary cycling as producing little body movement and says the method was not reliably accurate at identifying specific activity modes. That supports the cited point that cycling was challenging, but the paper does not report cycling-specific classification accuracy. The citing authors’ claim that their own study reliably detected bicycling is not a finding attributed to this source. (LLM, conf=0.76)
plainstates an association- Asserted: passes — The authors put it forward as true.
- Checkable: passes — It can be checked against evidence.
- Load-bearing: unclear — It is unclear whether the paper’s conclusions depend on it.
- Based: passes — The paper gives a reason why it holds.
- Supported
The cited sources support only part of this claim — read each source’s verdict below.
In the paper
“However, our data and that from Ellis et al 30 . shows that walking is challenging to classify in free-living conditions (sensitivity = 0.71, specificity = 0.96), probably due to it being part of many everyday activities.”
What the sources say
- Partly supportedcites [30] Ellis, K., Kerr, J., Godbole, S., Staudenmayer, J. & Lanckriet, G. Hip and Wrist Accelerometer Algorithms for Free-Living Behavior Classification. Med. Sci. Sports Exerc. 48, 933–40 (2016). sourceExperimental — accuracy not yet measured
Our copy does address walking classification in free-living conditions and its difficulty — the Discussion (p. n/a) states that 'observational protocol data can be classified with higher accuracy than free-living data' and that 'classifiers trained on both laboratory and observational protocol data perform poorly when applied to free-living data', and the Results (ML behavior classification) note walking/standing confusion ('Standing was most commonly confused for sitting by the hip classifier and most commonly confused for walking by the wrist classifier') and that cut-point/GGIR methods underestimated walking by 10–16 min/day. However, the specific figures the claim attributes (sensitivity = 0.71, specificity = 0.96) are not stated anywhere in our copy: the text only refers the reader to Table 1 for per-activity sensitivity/specificity, and the table values are not reproduced. Our copy also frames walking performance positively at the group level ('both classifiers correctly estimated minutes in sedentary behaviors and walking time'; hip classifier 'showed no significant difference in minutes of walking predicted'), and it is limited to 40 overweight/obese women with walking and running merged into one class, so the unqualified generalisation 'walking is challenging to classify' overstates what the source asserts. (LLM, conf=0.62)
hedged- Asserted: passes — The authors put it forward as true.
- Checkable: passes — It can be checked against evidence.
- Load-bearing: passes — The paper’s conclusions depend on it.
- Based: passes — The paper gives a reason why it holds.
- Partly supported
A result the paper reports from its own data — it cites no other source for it, so there is none to check. The quote shows it is in the paper.
In the paper
“Apart from mixed-activity and METs (r = 0.75), the different activity types are weakly correlated (absolute overall mean r = 0.37), indicating their utility as new sources of information (Fig. S 5 ).”
plainstates an associationn = 96,220- Asserted: passes — The authors put it forward as true.
- Checkable: passes — It can be checked against evidence.
- Load-bearing: passes — The paper’s conclusions depend on it.
- Based: passes — The paper gives a reason why it holds.
A result the paper reports from its own data — it cites no other source for it, so there is none to check. The quote shows it is in the paper.
In the paper
“Women spent more time engaged in mixed activity behaviours than men (18.9% vs. 14.5%, p < 10 −100 ).”
plainstates an association- Asserted: passes — The authors put it forward as true.
- Checkable: passes — It can be checked against evidence.
- Load-bearing: unclear — It is unclear whether the paper’s conclusions depend on it.
- Based: passes — The paper gives a reason why it holds.
A result the paper reports from its own data — it cites no other source for it, so there is none to check. The quote shows it is in the paper.
In the paper
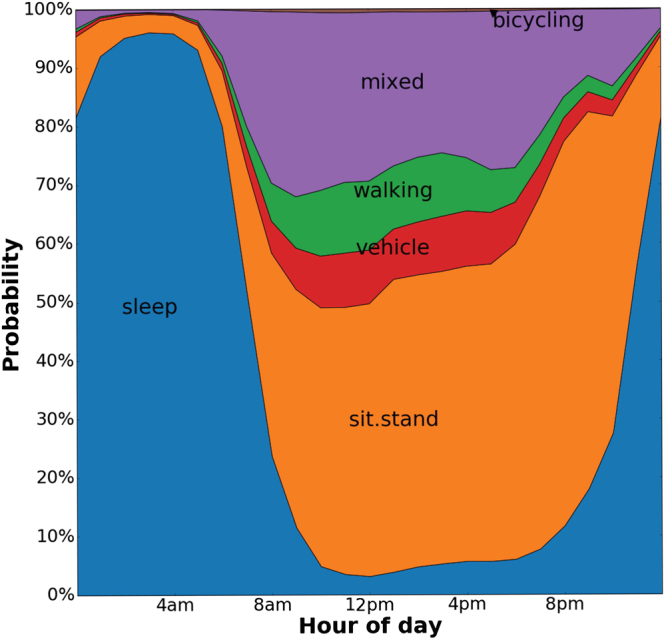
“Self-reported car users were more likely to be classified as driving at 8am on weekdays (9.1% vs. 5.5%, p < 10 −100 after adjustment for other factors) (see Fig. 1b ).”
plainstates an association- Asserted: passes — The authors put it forward as true.
- Checkable: passes — It can be checked against evidence.
- Load-bearing: unclear — It is unclear whether the paper’s conclusions depend on it.
- Based: passes — The paper gives a reason why it holds.
- Rests on an assumption not shown here.
16 more claims
Create a free account to see all 36 claims and to verify the 4 references still open.
- It may state two separate claims as one. 10
- Probably not a substantial claim. 11
Claims other papers make about this one
Each is checked against this paper’s own text: does it say what the citing paper says it does?
The cited source doesn’t support the claim as written.
In the citing paper
“This allowed us to train a model using all free-living ground truth data, achieving 79% accuracy (kappa = 0.68) across classes of interest14 (Supplementary Table 1).”
From GWAS identifies 14 loci for device-measured physical activity and sleep duration (2018) · cites this paper as [14]
Checked by a reasoning model — may be wrong.
Experimental — accuracy not yet measuredThe source backs part of the claim, not all of it — or backs it for a different population, condition or comparison.
In the citing paper
“This protocol was, for example, utilized in the UK Biobank study, which recorded accelerometer data from approx.90𝑘 participants, resulting in around 20TB of sensor data [46,198].”
From Past, Present, and Future of Sensor-based Human Activity Recognition Using Wearables: A Surveying Tutorial on a Still Challenging Task (2025) · cites this paper as [198]
Experimental — accuracy not yet measuredThe source backs part of the claim, not all of it — or backs it for a different population, condition or comparison.
In the citing paper
“a strong random forest model with tried-and-tested time series features, which has often been neglected in baseline model comparisons8,48–50.”
From Self-supervised learning for human activity recognition using 700,000 person-days of wearable data (2024) · cites this paper as [8]
Experimental — accuracy not yet measuredThe source backs part of the claim, not all of it — or backs it for a different population, condition or comparison.
In the citing paper
“the machine-learned phenotypes demonstrated face validity14 with clear and expected differences in sleep duration by self-reported chronotype status (Supplementary Fig. 1).”
From GWAS identifies 14 loci for device-measured physical activity and sleep duration (2018) · cites this paper as [14]
Experimental — accuracy not yet measuredThe source backs part of the claim, not all of it — or backs it for a different population, condition or comparison.
In the citing paper
“As detailed in a previous publication14 this model was considered suitable for population inference in UK Biobank as the performance was not materially affected by age and sex characteristics (difference in kappa score: sex < 0.0001; age < 0.05).”
From GWAS identifies 14 loci for device-measured physical activity and sleep duration (2018) · cites this paper as [14]
Experimental — accuracy not yet measured
15 more claims about this paper
Create a free account to see every claim other papers make about this one.
Citations
Cites
Breiman, L. (2001) · Machine Learning · doi:10.1023/a:1010933404324 · Cited by 133,538
The Measurement of Observer Agreement for Categorical Data
Landis, J. R., & Koch, G. G. (1977) · Biometrics · doi:10.2307/2529310 · Cited by 81,148
Sudlow, C., Gallacher, J., Allen, N., Beral, V., Burton, P., Danesh, J., Downey, P., Elliott, P., Green, J., Landray, M., et al. (2015) · PLOS Medicine · doi:10.1371/journal.pmed.1001779 · Cited by 12,728 · cited 2×
“We firstly assessed its performance in free-living scenarios using a dataset of 132 adults, 84 of which are female, aged 18–91 who wore an accelerometer and wearable camera (a method comparable to direct-observation 21 ).”
BackgroundMethodLee, I.-M., Shiroma, E. J., Lobelo, F., Puska, P., Blair, S. N., & Katzmarzyk, P. T. (2012) · The Lancet · doi:10.1016/s0140-6736(12)61031-9 · Cited by 8,215
(2005) · PubMed · Cited by 7,011
2011 Compendium of Physical Activities: A Second Update of Codes and MET Values
AINSWORTH, B. E., HASKELL, W. L., HERRMANN, S. D., MECKES, N., BASSETT, D. R., TUDOR-LOCKE, C., GREER, J. L., VEZINA, J., WHITT-GLOVER, M. C., & LEON, A. S. (2011) · Medicine & Science in Sports & Exercise · doi:10.1249/mss.0b013e31821ece12 · Cited by 6,317 · cited 1×
“Images were annotated by human annotators using codes from the compendium of physical activities 25 , using specific wearable camera browsing software 45 (Doc S1).”
MethodForney, G. D. (1973) · Proceedings of the IEEE · doi:10.1109/proc.1973.9030 · Cited by 5,647 · cited 1×
“Finally, the predicted MET score for each 30-second chunk is calculated as the assigned MET scores for each of the 11 states, weighted by the marginal probabilities of being in each of those states.”
MethodAn introduction to hidden Markov models
Rabiner, L., & Juang, B. (1986) · IEEE ASSP Magazine · doi:10.1109/massp.1986.1165342 · Cited by 4,775 · cited 1×
“To predict the MET score we follow the same process of feature extraction, random forest training and HMM definition, but for the eleven-class MET-relevant behaviour labels.”
MethodFit Yourself and Take Your Lungs to Heart
Palange, P., & Bonini, M. (2013) · Respiration · doi:10.1159/000350831 · Cited by 2,779
Wilmot, E. G., Edwardson, C. L., Achana, F. A., Davies, M. J., Gorely, T., Gray, L. J., Khunti, K., Yates, T., & Biddle, S. J. H. (2012) · Diabetologia · doi:10.1007/s00125-012-2677-z · Cited by 1,789 · cited 1×
“learning methods have not been assessed in large scale health sensor datasets for face validity or investigated to evaluate if they offer behavioural insight.”
Background
Research works printed but not linked: 3
- Ladha, C., Ladha, K., Jackson, D. & Olivier, P. Shaker Table Validation Of Openmovement Ax3 Accelerometer. in 3rd International Conference on Ambulatory Monitoring of Physical Activity and Movement 69–70 (2013).
- Doherty, A. R. et al. Using wearable cameras to categorise type and context of accelerometer-identified episodes of physical activity. Int. J. Behav. Nutr. Phys. Act. 10 (2013). · DOI
- Fernández-Delgado, M., Cernadas, E., Barro, S. & Amorim, D. Do we Need Hundreds of Classifiers to Solve Real World Classification Problems? J. Mach. Learn. Res. 15, 3133–3181 (2014).
Cited by
Migueles, J. H., Rowlands, A. V., Huber, F., Sabia, S., & van Hees, V. T. (2019) · Journal for the Measurement of Physical Behaviour · doi:10.1123/jmpb.2018-0063 · Cited by 955
The promise of machine learning in predicting treatment outcomes in psychiatry
Chekroud, A. M., Bondar, J., Delgadillo, J., Doherty, G., Wasil, A., Fokkema, M., Cohen, Z., Belgrave, D., DeRubeis, R., Iniesta, R., et al. (2021) · World Psychiatry · doi:10.1002/wps.20882 · Cited by 531
“Ma chine learning methods are indispensable for dealing with com plex patterns in these sensor data 105 .”
MethodVollmer, S., Mateen, B. A., Bohner, G., Király, F. J., Ghani, R., Jonsson, P., Cumbers, S., Jonas, A., McAllister, K. S. L., Myles, P., et al. (2020) · BMJ · doi:10.1136/bmj.l6927 · Cited by 497
Self-citationGWAS identifies 14 loci for device-measured physical activity and sleep duration
Doherty, A., Smith-Byrne, K., Ferreira, T., Holmes, M. V., Holmes, C., Pulit, S. L., & Lindgren, C. M. (2018) · Nature Communications · doi:10.1038/s41467-018-07743-4 · Cited by 408
Self-citationStamatakis, E., Ahmadi, M. N., Gill, J. M. R., Thøgersen-Ntoumani, C., Gibala, M. J., Doherty, A., & Hamer, M. (2022) · Nature Medicine · doi:10.1038/s41591-022-02100-x · Cited by 336
“The picture-based activity coding scheme has been previously described 34 .”
Self-citation
Metadata
- Authors
- Willetts, M., Hollowell, S., Aslett, L., Holmes, C., & Doherty, A.
- Affiliations
- University of Oxford (GB)
- Durham University (GB)
- Corresponding author
- Doherty, Aiden
- Venue
- Scientific Reports
- Published
- 2018-05-21
- Volume
- 8
- Issue
- 1
- Pages
- 7961-7961
- ISSN
- 2045-2322 (ISSN-L)
- PMC
- PMC5962537
- OpenAlex
- W2756121211
- Semantic Scholar
- 2150fe696e6d755f8685e6734824ea528ac78f46
- Cited by
- 250
- References
- 54
- Citations by year
- 2026: 30 · 2025: 38 · 2024: 40 · 2023: 32 · 2022: 22 · 2021: 40 · 2020: 28 · 2019: 15 · 2018: 5
- FWCI
- 11.00
- Type
- journal article
- Language
- en
- Update notices
- correction (2022-04-11)
- Open access
- gold
- doi.org
- Licence
- cc-by
- creativecommons.org/licenses/by/4.0 (tdm)
- creativecommons.org/licenses/by/4.0 (vor)
- Locations
- Scientific Reports (publishedVersion, cc-by)
- Europe PMC (PubMed Central) (publishedVersion, other-oa)
- PubMed Central (publishedVersion, cc-by)
- PubMed (publishedVersion)
- Durham Research Online (Durham University) (acceptedVersion, other-oa)
- Durham Research Online (Durham University) (submittedVersion, cc-by)
- DOAJ (DOAJ: Directory of Open Access Journals) (submittedVersion)
- Funders
- Wellcome Trust
- Alan Turing Institute (TU/B/000062)
- Medical Research Council (MC_PC_17228)
- Economic and Social Research Council (ES/L011662/1)
- Topics
- Physical Sciences › Computer Science › Computer Vision and Pattern Recognition › Context-Aware Activity Recognition Systems
- Health Sciences › Medicine › Public Health, Environmental and Occupational Health › Physical Activity and Health
- Social Sciences › Transportation › Human Mobility and Location-Based Analysis
- Keywords
- physical activity, sleep duration, wearable activity trackers, balanced random forest, hidden Markov models, sex differences, seasonal variation, walking time, UK Biobank, public health recommendations
- MeSH terms
- Machine Learning, Activities of Daily Living, Adolescent, Adult, Aged, Aged, 80 and over, Female, United Kingdom, Humans, Male, Middle Aged, Phenotype, Sleep, Exercise, Biological Specimen Banks, Young Adult, Sedentary Behavior, Self Report, Accelerometry
About these checks
Registry, retraction, Cites and statistics results are computed, not judged, with one exception: a printed reference that no index lists is read once by a model before it counts as a citation error. Claims are extracted by a model and kept only when their quote appears verbatim in the text; each cited source is then checked, with a model’s help, for whether it says what the claim relies on. Those verdicts can be wrong — read the claim’s quote and the cited source before relying on one.
The claim verdicts this report counts are experimental: their accuracy is not yet measured.
A language model drew the claims from the paper on 2026-10-11, under version 3 of the claim definition (model deepseek-v4.1-flash, prompt extract-v3).
A second model labelled each claim on 2026-10-11 (model jev-1.13-20260917, definition revision gold-guideline-v0.2).
Cited sources are checked with a language model’s help (gpt-6-sol and qwen3.8-omni-flash).
Statistics and arithmetic are recomputed, not judged.
Confidence bands are shown only for fields calibrated on our annotated test set. None is calibrated yet, so no band is shown.
What counts as a claim ›How we measure confidence ›How we check this ›
Are you an author, or do you see a problem with this page? Request a review
How to cite
Cite CoChat for the checks on this page, and the paper for its own findings.
- This page
- CoChat. (2026). Citation check: Statistical machine learning of sleep and physical activity phenotypes from sensor data in 96,220 UK Biobank participants. https://app.cochat.ai/papers/10.1038/s41598-018-26174-1
- The paper
- Willetts, M., Hollowell, S., Aslett, L., Holmes, C., & Doherty, A. (2018). Statistical machine learning of sleep and physical activity phenotypes from sensor data in 96,220 UK Biobank participants. Scientific Reports. https://doi.org/10.1038/s41598-018-26174-1
Data sources
Bibliographic data: Semantic Scholar, OpenAlex, Crossref.
Contains information from the Semantic Scholar Academic Graph Datasets, made available under the ODC Attribution License (ODC-BY 1.0).
Semantic Scholar’s data is described in: Kinney, R., et al. (2023). The Semantic Scholar Open Data Platform. arXiv:2301.10140.
