

The DOI matches its Crossref record.
A native IgE in complex with profilin provides insights into allergen recognition and cross-reactivity
Abstract
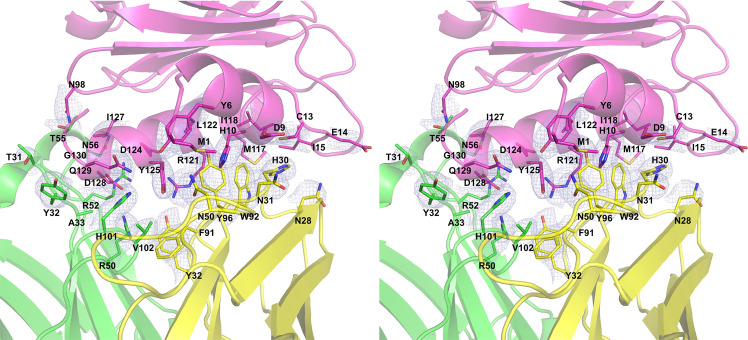
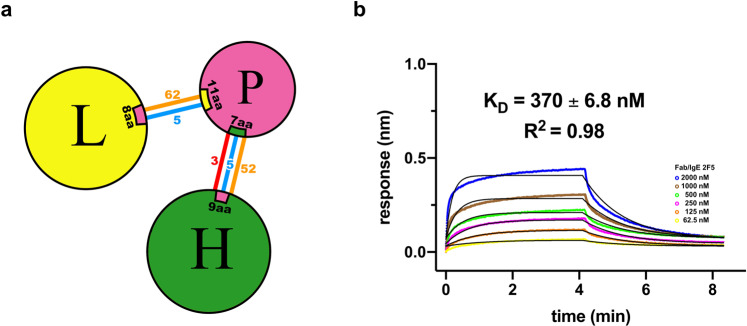
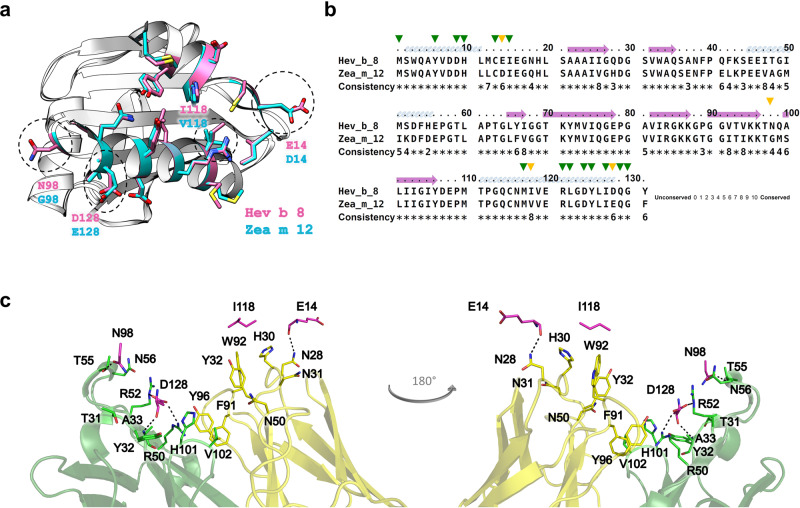
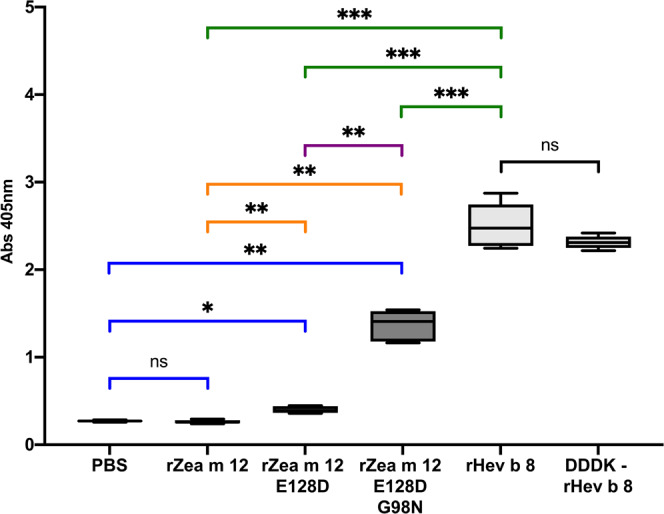
Allergies have become a rising health problem, where plentiful substances can trigger IgE-mediated allergies in humans. While profilins are considered minor allergens, these ubiquitous proteins are primary molecules involved in cross-reactivity and pollen-food allergy syndrome. Here we report the first crystal structures of murine Fab/IgE, with its chains naturally paired, in complex with the allergen profilin from Hevea brasiliensis(Hev b 8). The crystallographic models revealed that the IgE’s six complementarity-determining regions (CDRs) interact with the allergen, comprising a rigid paratope-epitope surface of 926 Å 2, which includes an extensive network of interactions. Interestingly, we also observed previously unreported flexibility at Fab/IgE’s elbow angle, which did not influence the shape of the paratope. The Fab/IgE exhibits a high affinity for Hev b 8, even when using 1 M NaCl in BLI experiments. Finally, based on the encouraging cross-reactivity assays using two mutants of the maize profilin (Zea m 12), this antibody could be a promising tool in IgE engineering for diagnosis and research applications.
Overview
The claims and statistics of this paper haven’t been checked yet.
Run the check — free, no account needed. It reads the open-access text and checks the sources it cites.
Integrity signals
Registry
Cites
Statistics
Figures
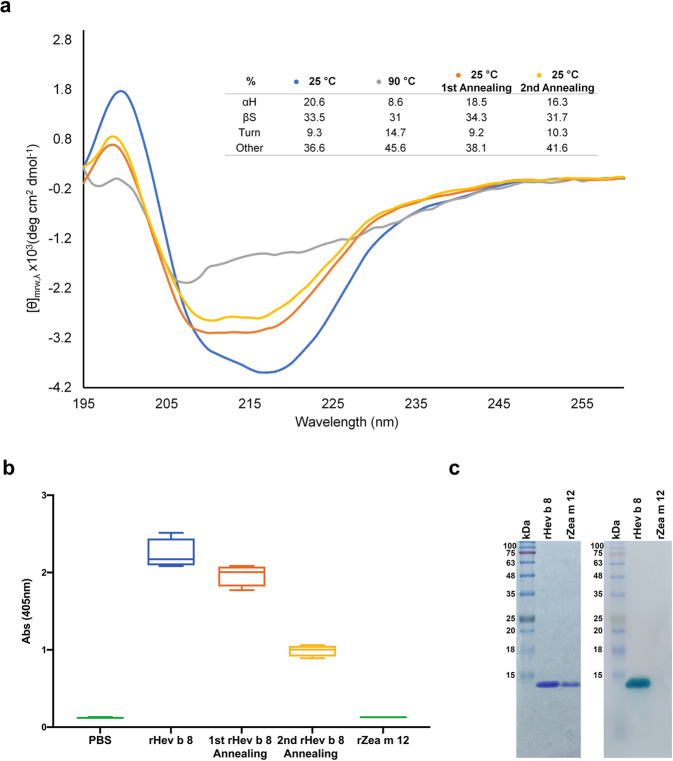
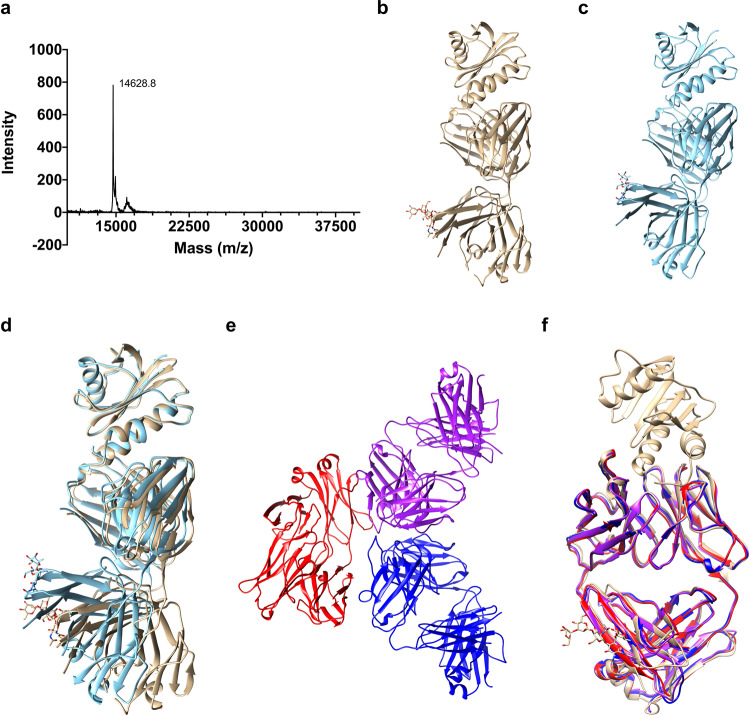
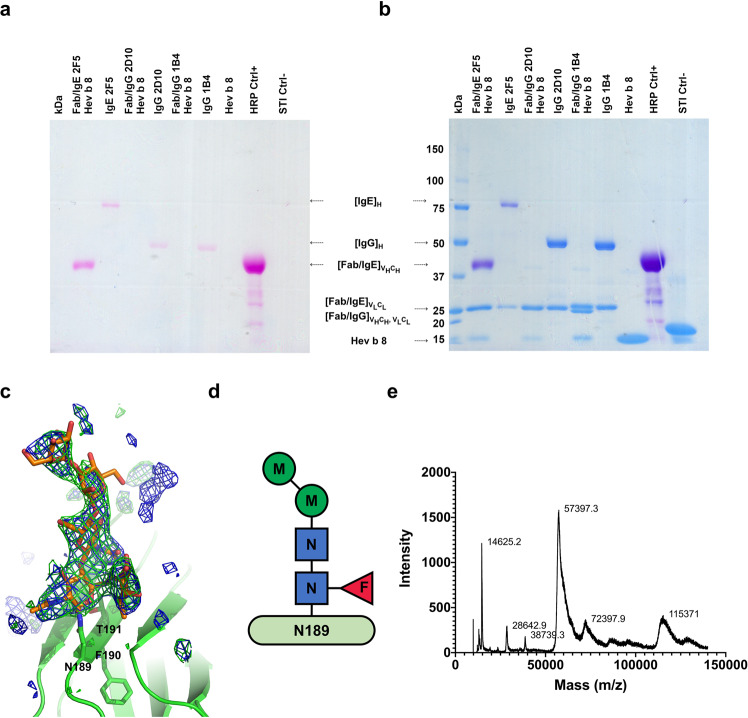
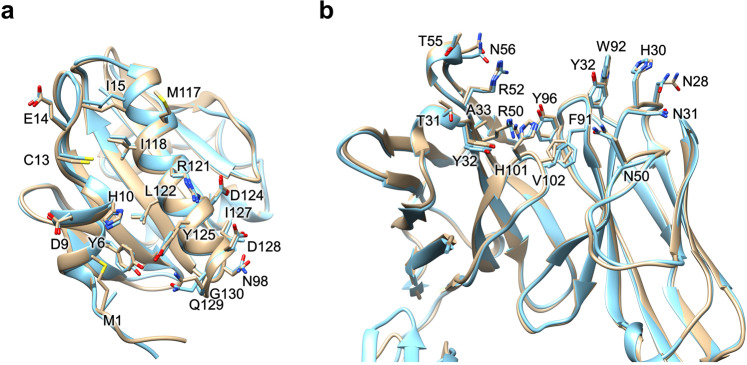
Verification
Claims the paper makes
The claims and statistics of this paper haven’t been checked yet.
Run the check — free, no account needed. It reads the open-access text and checks the sources it cites.
Claims other papers make about this one
Each is checked against this paper’s own text: does it say what the citing paper says it does?
In the citing paper
“They interact with actin monomers (G-actin) and polyproline sequences, regulating the assembly of actin filaments [132].”
From Pollen–Food Allergy Syndrome: Allergens, Clinical Insights, Diagnostic and Therapeutic Challenges (2024) · cites this paper as [132]
Self-check
Percentages, sums and reported differences re-computed from the paper’s own numbers.
The self-check needs the paper’s full text.
Citations
Cites
No references could be resolved yet.
Research works printed but not linked: 53
- Golembiewski, J. A. Allergic reactions to drugs: implications for perioperative care. J. Perianesth. Nurs. 17, 393–398 (2002). · DOI
- Tarlo, S. M. & Lemiere, C. Occupational asthma. N. Engl. J. Med. 370, 640–649 (2014). · DOI · Paper page
- Sudharson, S., Kalic, T., Hafner, C. & Breiteneder, H. Newly defined allergens in the WHO/IUIS Allergen Nomenclature Database during 01/2019-03/2021. Allergy 76, 3359–3373 (2021). · DOI
- Huby, R. D., Dearman, R. J. & Kimber, I. Why are some proteins allergens? Toxicol. Sci. 55, 235–246 (2000). · DOI
- Akıl, C. & Robinson, R. C. Genomes of Asgard archaea encode profilins that regulate actin. Nature 562, 439–443 (2018). · DOI
- Offermann, L. R. et al. Structural, functional, and immunological characterization of profilin panallergens Amb a 8, Art v 4, and Bet v 2. J. Biol. Chem. 291, 15447–15459 (2016). · DOI
- Santos, A. & Van Ree, R. Profilins: mimickers of allergy or relevant allergens. Int. Arch. Allergy Immunol. 155, 191–204 (2011). · DOI
- Popescu, F. D. Cross-reactivity between aeroallergens and food allergens. World J. Methodol. 5, 31–50 (2015). · DOI · Paper page
- Landa-Pineda, C. M. et al. [Profilins: allergens with clinical relevance]. Rev. Alerg. Mex. 60, 129–143 (2013).
- Jensen, R. K. et al. Structure of intact IgE and the mechanism of ligelizumab revealed by electron microscopy. Allergy 75, 1956–1965 (2020). · DOI
- Sutton, B. J. & Davies, A. M. Structure and dynamics of IgE-receptor interactions: FcεRI and CD23/FcεRII. Immunol. Rev. 268, 222–235 (2015). · DOI
- Shin, J. S. & Greer, A. M. The role of FcεRI expressed in dendritic cells and monocytes. Cell. Mol. Life Sci. 72, 2349–2360 (2015). · DOI
- von Bubnoff, D., Novak, N., Kraft, S. & Bieber, T. The central role of FcepsilonRI in allergy. Clin. Exp. Dermatol 28, 184–187 (2003). · DOI
- Kraft, S. & Kinet, J. P. New developments in FcepsilonRI regulation, function and inhibition. Nat. Rev. Immunol. 7, 365–378 (2007). · DOI
- Bowles, S. L. et al. Comparative binding of soluble fragments (derCD23, sCD23, and exCD23) of recombinant human CD23 to CD21 (SCR 1-2) and native IgE, and their effect on IgE regulation. Cell Immunol. 271, 371–378 (2011). · DOI
- Niemi, M. et al. Molecular interactions between a recombinant IgE antibody and the beta-lactoglobulin allergen. Structure 15, 1413–1421 (2007). · DOI
- Padavattan, S. et al. High-affinity IgE recognition of a conformational epitope of the major respiratory allergen Phl p 2 as revealed by X-ray crystallography. J. Immunol. 182, 2141–2151 (2009). · DOI
- Mitropoulou, A. N. et al. Structure of a patient-derived antibody in complex with allergen reveals simultaneous conventional and superantigen-like recognition. Proc. Natl Acad. Sci. USA 115, E8707–e8716 (2018). · DOI
- Brünger, A. T., Leahy, D. J., Hynes, T. R. & Fox, R. O. 2.9 A resolution structure of an anti-dinitrophenyl-spin-label monoclonal antibody Fab fragment with bound hapten. J. Mol. Biol. 221, 239–256 (1991).
- Mares-Mejía, I. et al. Structural insights into the IgE mediated responses induced by the allergens Hev b 8 and Zea m 12 in their dimeric forms. Sci. Rep. 6, 32552 (2016). · DOI
- Ganglberger, E. et al. Hev b 8, the Hevea brasiliensis latex profilin, is a cross-reactive allergen of latex, plant foods and pollen. Int Arch. Allergy Immunol. 125, 216–227 (2001). · DOI
- Islam, M. M. et al. Analysis and control of protein crystallization using short peptide tags that change solubility without affecting structure, thermal stability, and function. Cryst. Growth Des. 15, 2703–2711 (2015). · DOI
- Stanfield, R. L., Zemla, A., Wilson, I. A. & Rupp, B. Antibody elbow angles are influenced by their light chain class. J. Mol. Biol. 357, 1566–1574 (2006). · DOI
- Sotriffer, C. A., Rode, B. M., Varga, J. M. & Liedl, K. R. Elbow flexibility and ligand-induced domain rearrangements in antibody Fab NC6.8: large effects of a small hapten. Biophys. J. 79, 614–628 (2000). · DOI
- Mares-Mejía, I. et al. Novel murine mAbs define specific and cross-reactive epitopes on the latex profilin panallergen Hev b 8. Mol. Immunol. 128, 10–21 (2020). · DOI
- Emsley, P. & Crispin, M. Structural analysis of glycoproteins: building N-linked glycans with Coot. Acta Crystallogr D. Struct. Biol. 74, 256–263 (2018). · DOI
- Shade, K. T. et al. A single glycan on IgE is indispensable for initiation of anaphylaxis. J. Exp. Med. 212, 457–467 (2015). · DOI
- Laskowski, R. A. PDBsum new things. Nucleic Acids Res. 37, D355–359 (2009). · DOI
- Tordesillas, L. et al. Characterization of IgE epitopes of Cuc m 2, the major melon allergen, and their role in cross-reactivity with pollen profilins. Clin. Exp. Allergy 40, 174–181 (2010). · DOI
- López-Torrejón, G. et al. An experimental and modeling-based approach to locate IgE epitopes of plant profilin allergens. J. Allergy Clin. Immunol. 119, 1481–1488 (2007). · DOI
- Tina, K. G., Bhadra, R. & Srinivasan, N. PIC: protein interactions calculator. Nucleic Acids Res. 35, W473–476 (2007). · DOI
- Barrows, J. K. & Van Dyke, M. W. Biolayer interferometry for DNA-protein interactions. PLoS ONE 17, e0263322 (2022). · DOI
- Wu, N. C. et al. An alternative binding mode of IGHV3-53 antibodies to the SARS-CoV-2 receptor binding domain. Cell Rep. 33, 108274 (2020). · DOI
- Hauser, M., Roulias, A., Ferreira, F. & Egger, M. Panallergens and their impact on the allergic patient. Allergy Asthma Clin. Immunol. 6, 1 (2010). · DOI · Paper page
- Lu, J. & Pollard, T. D. Profilin binding to poly-L-proline and actin monomers along with ability to catalyze actin nucleotide exchange is required for viability of fission yeast. Mol. Biol. Cell 12, 1161–1175 (2001). · DOI
- Shade, K. T., Conroy, M. E. & Anthony, R. M. IgE glycosylation in health and disease. Curr. Top. Microbiol Immunol. 423, 77–93 (2019).
- Hunt, J. et al. A fluorescent biosensor reveals conformational changes in human immunoglobulin E Fc: implications for mechanisms of receptor binding, inhibition, and allergen recognition. J. Biol. Chem. 287, 17459–17470 (2012). · DOI
- Roux, K. H., Strelets, L., Brekke, O. H., Sandlie, I. & Michaelsen, T. E. Comparisons of the ability of human IgG3 hinge mutants, IgM, IgE, and IgA2, to form small immune complexes: a role for flexibility and geometry. J. Immunol. 161, 4083–4090 (1998). · DOI
- Sirvent, S., Palomares, O., Cuesta-Herranz, J., Villalba, M. & Rodríguez, R. Analysis of the structural and immunological stability of 2S albumin, nonspecific lipid transfer protein, and profilin allergens from mustard seeds. J. Agric Food Chem. 60, 6011–6018 (2012). · DOI
- Pekar, J., Ret, D. & Untersmayr, E. Stability of allergens. Mol. Immunol. 100, 14–20 (2018). · DOI · Paper page
- Haba, S. & Nisonoff, A. Proteolytic digestion of mouse IgE. J. Immunol. Methods 138, 15–23 (1991). · DOI
- Micsonai, A. et al. BeStSel: a web server for accurate protein secondary structure prediction and fold recognition from the circular dichroism spectra. Nucleic Acids Res. 46, W315–w322 (2018). · DOI
- Micsonai, A. et al. Accurate secondary structure prediction and fold recognition for circular dichroism spectroscopy. Proc. Natl Acad. Sci. USA 112, E3095–3103 (2015). · DOI
- Kabsch, W. XDS. Acta Crystallogr D. Biol. Crystallogr. 66, 125–132 (2010). · DOI · Paper page
- Kabsch, W. Integration, scaling, space-group assignment and post-refinement. Acta Crystallogr. D. Biol. Crystallogr. 66, 133–144 (2010). · DOI
- Minor, W., Cymborowski, M., Otwinowski, Z. & Chruszcz, M. HKL-3000: the integration of data reduction and structure solution–from diffraction images to an initial model in minutes. Acta Crystallogr D. Biol. Crystallogr 62, 859–866 (2006). · DOI
- McCoy, A. J. et al. Phaser crystallographic software. J. Appl Crystallogr 40, 658–674 (2007). · DOI · Paper page
- Afonine, P. V. et al. Towards automated crystallographic structure refinement with phenix.refine. Acta Crystallogr D. Biol. Crystallogr 68, 352–367 (2012). · DOI · Paper page
- Emsley, P., Lohkamp, B., Scott, W. G. & Cowtan, K. Features and development of Coot. Acta Crystallogr. D. Biol. Crystallogr. 66, 486–501 (2010). · DOI · Paper page
- Evans, P. R. & Murshudov, G. N. How good are my data and what is the resolution. Acta Crystallogr. D. Biol. Crystallogr. 69, 1204–1214 (2013). · DOI
- Pettersen, E. F. et al. UCSF Chimera–a visualization system for exploratory research and analysis. J. Comput Chem. 25, 1605–1612 (2004). · DOI
- DeLano, W. L. In CCP4 Newsletter on Protein Crystallography, Vol. 40, 82–92 (The PyMOL Molecular Graphics System, Version 2.0 Schrödinger, LLC, 2002).
- Simossis, V. A. & Heringa, J. PRALINE: a multiple sequence alignment toolbox that integrates homology-extended and secondary structure information. Nucleic Acids Res. 33, W289–294 (2005). · DOI
Cited by
Sorted by citations
Pollen–Food Allergy Syndrome: Allergens, Clinical Insights, Diagnostic and Therapeutic Challenges
Haidar, L., Bănărescu, C. F., Uța, C., Moldovan, S. I., Zimbru, E.-L., Zimbru, R.-I., Ciurariu, E., Georgescu, M., & Panaitescu, C. (2024) · Applied Sciences · doi:10.3390/app15010066 · Cited by 21
Metadata
- Authors
- García-Ramírez, B., Mares-Mejía, I., Rodríguez-Hernández, A., Cano-Sánchez, P., Torres-Larios, A., Ortega, E., & Rodríguez-Romero, A.
- Venue
- Communications Biology
- Published
- 2022-07-27
- Volume
- 5
- Issue
- 1
- ISSN
- 2399-3642
- PMC
- PMC9334453
- Cited by
- 16
- References
- 0
- Language
- en
About these checks
Registry, retraction, Cites and statistics results are computed, not judged, with one exception: a printed reference that no index lists is read once by a model before it counts as a citation error. Claims are extracted by a model and kept only when their quote appears verbatim in the text; each cited source is then checked, with a model’s help, for whether it says what the claim relies on. Those verdicts can be wrong — read the claim’s quote and the cited source before relying on one.
Statistics and arithmetic are recomputed, not judged.
Confidence bands are shown only for fields calibrated on our annotated test set. None is calibrated yet, so no band is shown.
What counts as a claim ›How we measure confidence ›How we check this ›
Are you an author, or do you see a problem with this page? Request a review
