Cited by 19

The DOI matches its Crossref record; 17 of the 17 references it cites were found in a registry or an index.

Novel microglial transcriptional signatures promote social and cognitive deficits following repeated social defeat

Goodman, Ethan J., DiSabato, Damon J., Sheridan, John F., Godbout, Jonathan P.·2024·Communications Biology

Overview

The claims and statistics of this paper haven’t been checked yet.

Run the check — free, no account needed. It reads the open-access text and checks the sources it cites.

A few free checks a day · papers already verified open instantly · results are public

Integrity signals

Registry

Crossref · 10.1038/s42003-024-06898-9

Cites

17 of 17 references verified0 citation errors · 0 not checkable

Statistics

Figures

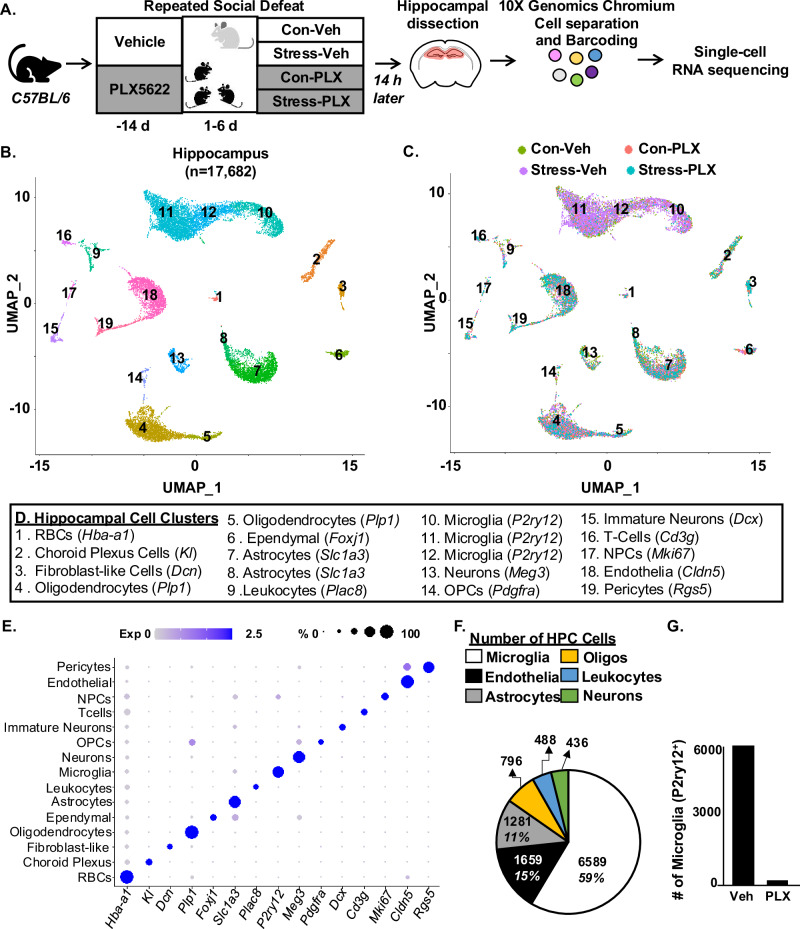
Fig. 1 Single-cell RNA sequencing of the hippocampus after RSD. A Male C57BL/6 mice were administered diets supplemented with Vehicle (Veh) or PLX5622 (PLX) for 14 days. Next, mice were subjected to RSD (stress) or left undisturbed (control). Mice were on diets for the duration of the experiment. Fourteen hours after RSD, mice were perfused, the hippocampus was dissected, pooled (3 mice per group), and processed for scRNAseq. Single cells were separated using a 10X Genomics Chromium controller, RNA was barcoded, and cDNA libraries were generated, sequenced, and aligned to the mouse genome. B UMAP clustering of 17,682 cells from the hippocampus resolved 19 distinct cell clusters. C The distribution of cells with UMAP clustering based on the four experimental groups (Con-Veh, Stress-Veh, Con-PLX, and Stress-PLX). D Annotation of the hippocampal cell clusters identified by cell-specific markers detected by the Conserved Marker function of Seurat. E Dot plot of relative and proportional expression of cell-specific RNA in the 19 cell clusters, including microglia (P2yr12), astrocytes (Slc1a3), endothelia (Cldn5), leukocytes (Plac8), and oligodendrocytes (Plp1). F Pie chart shows the percentage of cell-specific clusters captured and sequenced using scRNAseq. G The number of P2yr12+ microglia in PLX groups compared to vehicle groups. Clustering and differential expression were determined using Seurat in R. Pooled samples for 3 replicates and data represent two independent experiments (n = 6 mice, per group).
Fig. 1 Single-cell RNA sequencing of the hippocampus after RSD. A Male C57BL/6 mice were administered diets supplemented with Vehicle (Veh) or PLX5622 (PLX) for 14 days. Next, mice were subjected to RSD (stress) or left undisturbed (control). Mice were on diets for the duration of the experiment. Fourteen hours after RSD, mice were perfused, the hippocampus was dissected, pooled (3 mice per group), and processed for scRNAseq. Single cells were separated using a 10X Genomics Chromium controller, RNA was barcoded, and cDNA libraries were generated, sequenced, and aligned to the mouse genome. B UMAP clustering of 17,682 cells from the hippocampus resolved 19 distinct cell clusters. C The distribution of cells with UMAP clustering based on the four experimental groups (Con-Veh, Stress-Veh, Con-PLX, and Stress-PLX). D Annotation of the hippocampal cell clusters identified by cell-specific markers detected by the Conserved Marker function of Seurat. E Dot plot of relative and proportional expression of cell-specific RNA in the 19 cell clusters, including microglia (P2yr12), astrocytes (Slc1a3), endothelia (Cldn5), leukocytes (Plac8), and oligodendrocytes (Plp1). F Pie chart shows the percentage of cell-specific clusters captured and sequenced using scRNAseq. G The number of P2yr12+ microglia in PLX groups compared to vehicle groups. Clustering and differential expression were determined using Seurat in R. Pooled samples for 3 replicates and data represent two independent experiments (n = 6 mice, per group).CC BY-NC-ND · PubMed Central
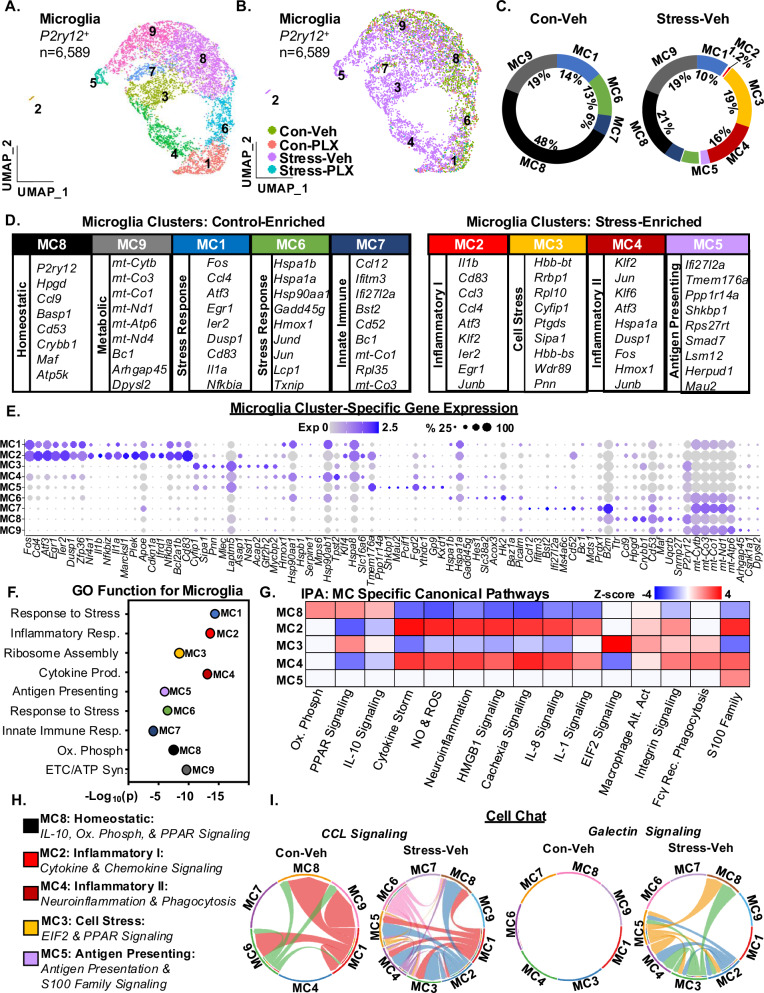
Fig. 2 Single-cell RNA sequencing identifies unique stress-associated microglial RNA profiles after RSD. Continuing with the scRNAseq analysis in Fig. 1, A UMAP subclustering of P2y12+ microglia (6589 cells) revealed nine distinct clusters. B The distribution of microglia with UMAP clustering based on the four experimental groups (Con-Veh, Stress-Veh, Con-PLX, and Stress-PLX). C Circle charts represent the proportion of each microglial cluster in Con-Veh and Stress-Veh groups. D The top genes expressed (Log2FC, p-adj < 0.05) in each microglia cluster. E Dot plot shows relative and proportional expression of the top genes (Log2FC, p-adj < 0.05) differentially expressed across the microglial (MC) clusters (MC1-9). F GO Function pathways for differentially expressed genes (DEG) in each MC (p-adj < 0.05) G IPA of canonical pathways of differentially expressed genes (DEG) across clusters MC2-5 and MC8 (p-adj < 0.05, z-score ≥ ±1.5). H Classification of plausible function of selected microglia clusters based on IPA and GO analyses. I CellChat analyses of CCL and galectin signaling in the microglia clusters.
Fig. 2 Single-cell RNA sequencing identifies unique stress-associated microglial RNA profiles after RSD. Continuing with the scRNAseq analysis in Fig. 1, A UMAP subclustering of P2y12+ microglia (6589 cells) revealed nine distinct clusters. B The distribution of microglia with UMAP clustering based on the four experimental groups (Con-Veh, Stress-Veh, Con-PLX, and Stress-PLX). C Circle charts represent the proportion of each microglial cluster in Con-Veh and Stress-Veh groups. D The top genes expressed (Log2FC, p-adj < 0.05) in each microglia cluster. E Dot plot shows relative and proportional expression of the top genes (Log2FC, p-adj < 0.05) differentially expressed across the microglial (MC) clusters (MC1-9). F GO Function pathways for differentially expressed genes (DEG) in each MC (p-adj < 0.05) G IPA of canonical pathways of differentially expressed genes (DEG) across clusters MC2-5 and MC8 (p-adj < 0.05, z-score ≥ ±1.5). H Classification of plausible function of selected microglia clusters based on IPA and GO analyses. I CellChat analyses of CCL and galectin signaling in the microglia clusters.CC BY-NC-ND · PubMed Central
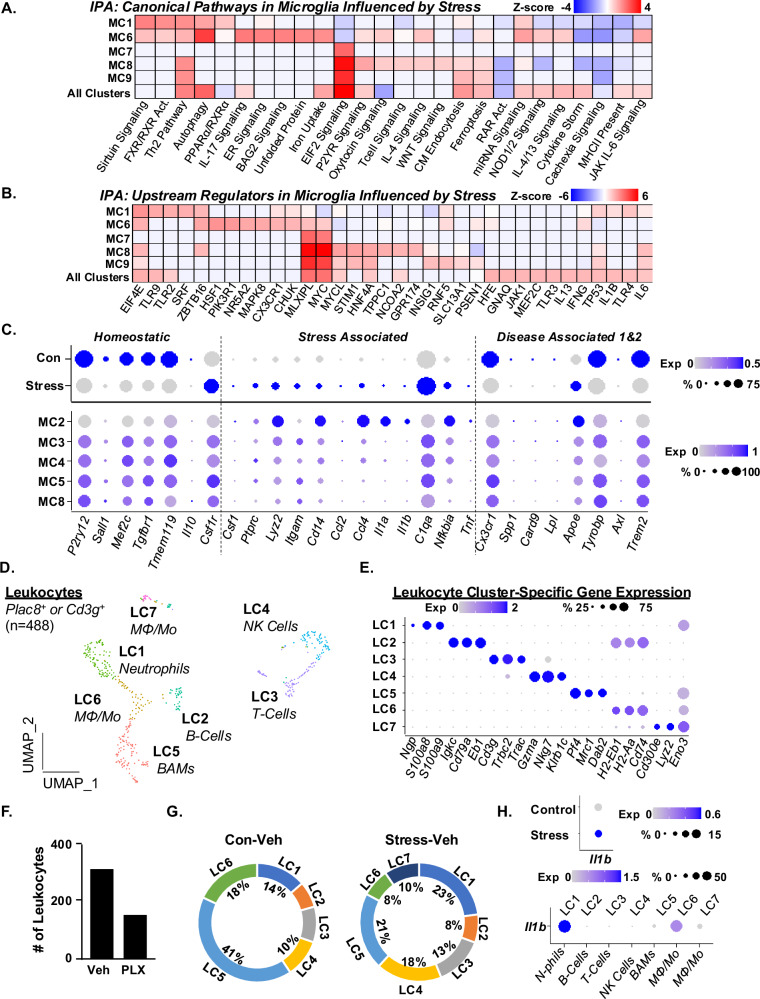
Fig. 3 Microglial RNA profiles after RSD are associated with the accumulation of IL-1β+ leukocytes in the hippocampus. Continuing with the P2y12+ microglia (6589 cells) analysis in Fig. 2, A IPA of canonical pathways influenced by stress in MC1, 6–9 and all clusters (MC1-9). B IPA of upstream regulators influenced by stress in MC1, 6–9 and all clusters (MC1-9). C Dot plots of relative and proportional expression of DEGs associated with homeostatic genes, stress-associated microglia, and disease-associated microglia (DAM) across all microglia clusters and selected clusters as a function of stress. D Continuing with the scRNAseq analysis in Fig. 1, UMAP subclustering of Plac8+ or CD3g+ leukocytes (488 total cells) resolved seven distinct clusters. E Dot plot of relative and proportional expression of leukocyte-related genes in each cluster (LC1-9). F Number of Plac8+ and CD3g+ leukocytes between vehicle and PLX5622 groups combined. G Circle charts represent the proportion of each leukocyte cluster (LC) in Con-Veh and Stress-Veh groups. H Dot plots of relative and proportional expression of Il1b in leukocyte clusters as a function of stress (top) and cluster (bottom).
Fig. 3 Microglial RNA profiles after RSD are associated with the accumulation of IL-1β+ leukocytes in the hippocampus. Continuing with the P2y12+ microglia (6589 cells) analysis in Fig. 2, A IPA of canonical pathways influenced by stress in MC1, 6–9 and all clusters (MC1-9). B IPA of upstream regulators influenced by stress in MC1, 6–9 and all clusters (MC1-9). C Dot plots of relative and proportional expression of DEGs associated with homeostatic genes, stress-associated microglia, and disease-associated microglia (DAM) across all microglia clusters and selected clusters as a function of stress. D Continuing with the scRNAseq analysis in Fig. 1, UMAP subclustering of Plac8+ or CD3g+ leukocytes (488 total cells) resolved seven distinct clusters. E Dot plot of relative and proportional expression of leukocyte-related genes in each cluster (LC1-9). F Number of Plac8+ and CD3g+ leukocytes between vehicle and PLX5622 groups combined. G Circle charts represent the proportion of each leukocyte cluster (LC) in Con-Veh and Stress-Veh groups. H Dot plots of relative and proportional expression of Il1b in leukocyte clusters as a function of stress (top) and cluster (bottom).CC BY-NC-ND · PubMed Central
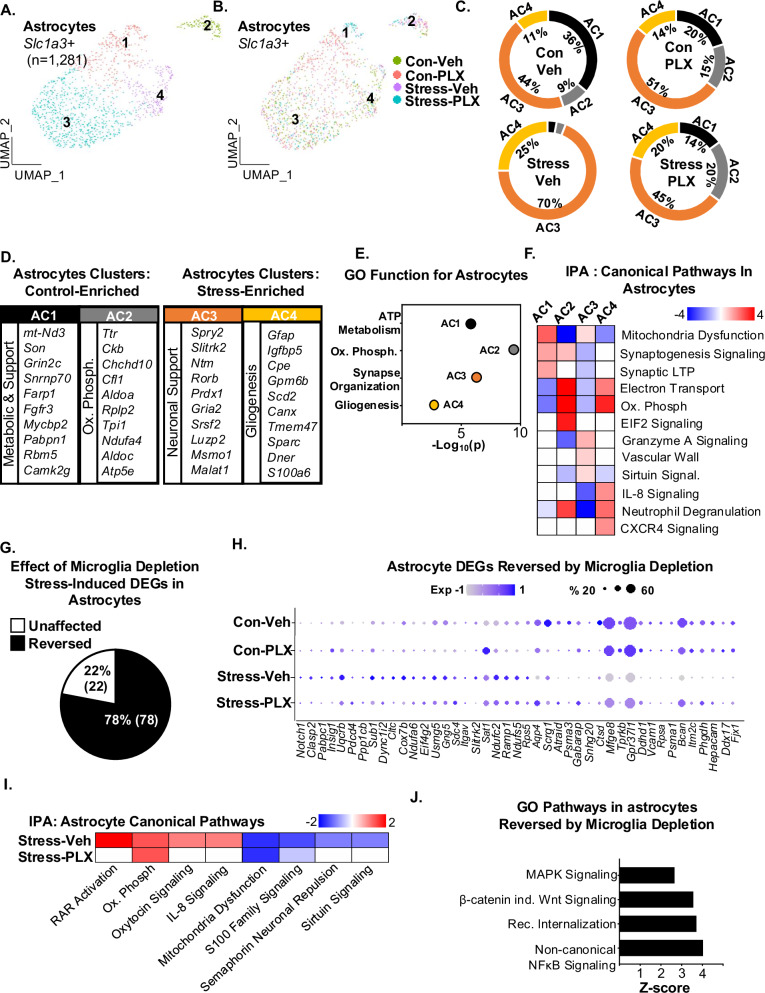
Fig. 4 RNA profiles of astrocytes after RSD were dependent on microglia. Continuing with the scRNAseq analysis in Fig. 1, A UMAP subclustering of Slc1a3+ astrocytes (1281 cells) shows four distinct clusters of astrocytes. B Distribution of the four astrocyte clusters within the four groups: Con-Veh, Stress-Veh, Con-PLX, and Stress-PLX. C Pie charts reflect the proportion of each astrocyte cluster of the total within the four groups. D The top genes expressed (Log2FC) in each astrocyte cluster are shown (p-adj < 0.05). E GO function for each AC. F IPA of canonical pathways of differentially expressed genes between clusters AC1-4. G Percentage of stress-induced DEG in astrocytes reversed by microglia depletion. H Dot plot shows relative and proportional expression of the top genes differentially expressed between the four groups across all astrocytes. I IPA of canonical pathways of differentially expressed genes between Stress-Veh and Stress-PLX. J GO pathways of genes influenced by stress and reversed by microglia.
Fig. 4 RNA profiles of astrocytes after RSD were dependent on microglia. Continuing with the scRNAseq analysis in Fig. 1, A UMAP subclustering of Slc1a3+ astrocytes (1281 cells) shows four distinct clusters of astrocytes. B Distribution of the four astrocyte clusters within the four groups: Con-Veh, Stress-Veh, Con-PLX, and Stress-PLX. C Pie charts reflect the proportion of each astrocyte cluster of the total within the four groups. D The top genes expressed (Log2FC) in each astrocyte cluster are shown (p-adj < 0.05). E GO function for each AC. F IPA of canonical pathways of differentially expressed genes between clusters AC1-4. G Percentage of stress-induced DEG in astrocytes reversed by microglia depletion. H Dot plot shows relative and proportional expression of the top genes differentially expressed between the four groups across all astrocytes. I IPA of canonical pathways of differentially expressed genes between Stress-Veh and Stress-PLX. J GO pathways of genes influenced by stress and reversed by microglia.CC BY-NC-ND · PubMed Central
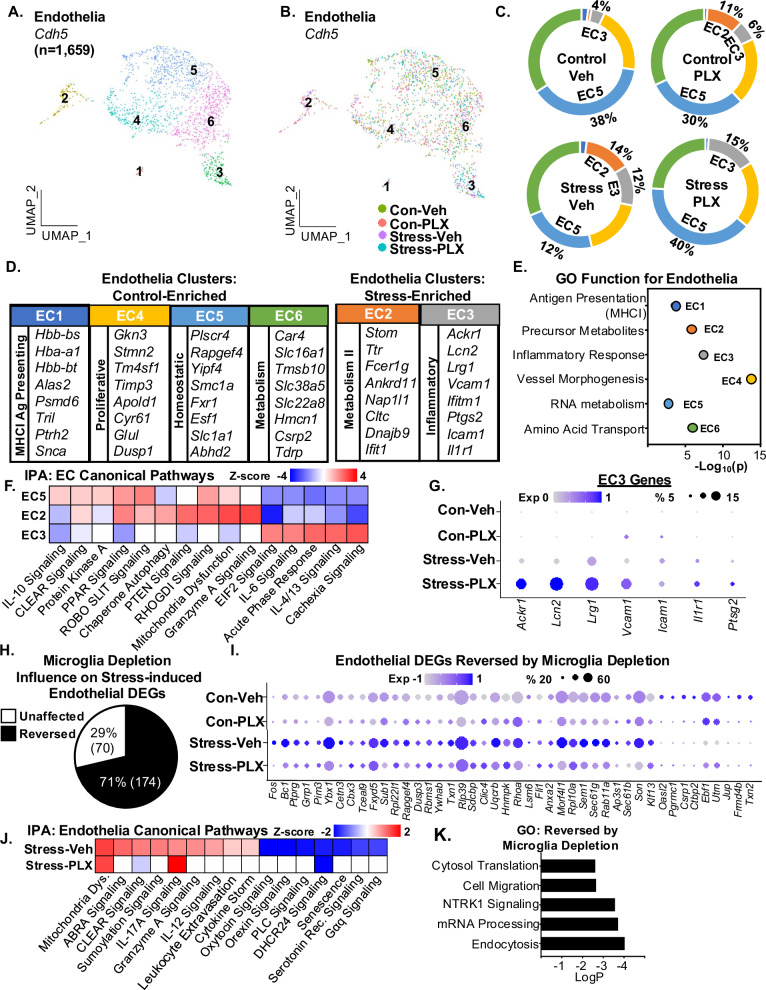
Fig. 5 RNA profiles of endothelia after RSD were dependent on microglia. A Continuing with the scRNAseq analysis in Fig. 1, UMAP subclustering of Cdh5+ endothelia (1659 cells) shows six distinct clusters. B Distribution of the Cdh5+ endothelia clusters within the four groups: Con-Veh, Stress-Veh, Con-PLX, and Stress-PLX. C Pie charts reflect the proportion of each endothelia cluster of the total within the four groups. D The top genes expressed (Log2FC) in each endothelia cluster are shown (p-adj < 0.05). E GO function for each AC. F IPA of canonical pathways of differentially expressed genes between clusters EC 2,3, and 5. G Dot plot of selected genes from EC3 across all four groups. H Percentage of stress-induced DEGs in endothelial reversed by microglia depletion. I Dot plot shows relative and proportional expression of the top genes differentially expressed between the four groups across the endothelia clusters (EC1-6). J IPA of canonical pathways of differentially expressed genes between Stress-Veh and Stress-PLX in endothelia clusters. K GO pathways of differentially expressed genes between Stress-Veh and Stress-PLX.
Fig. 5 RNA profiles of endothelia after RSD were dependent on microglia. A Continuing with the scRNAseq analysis in Fig. 1, UMAP subclustering of Cdh5+ endothelia (1659 cells) shows six distinct clusters. B Distribution of the Cdh5+ endothelia clusters within the four groups: Con-Veh, Stress-Veh, Con-PLX, and Stress-PLX. C Pie charts reflect the proportion of each endothelia cluster of the total within the four groups. D The top genes expressed (Log2FC) in each endothelia cluster are shown (p-adj < 0.05). E GO function for each AC. F IPA of canonical pathways of differentially expressed genes between clusters EC 2,3, and 5. G Dot plot of selected genes from EC3 across all four groups. H Percentage of stress-induced DEGs in endothelial reversed by microglia depletion. I Dot plot shows relative and proportional expression of the top genes differentially expressed between the four groups across the endothelia clusters (EC1-6). J IPA of canonical pathways of differentially expressed genes between Stress-Veh and Stress-PLX in endothelia clusters. K GO pathways of differentially expressed genes between Stress-Veh and Stress-PLX.CC BY-NC-ND · PubMed Central
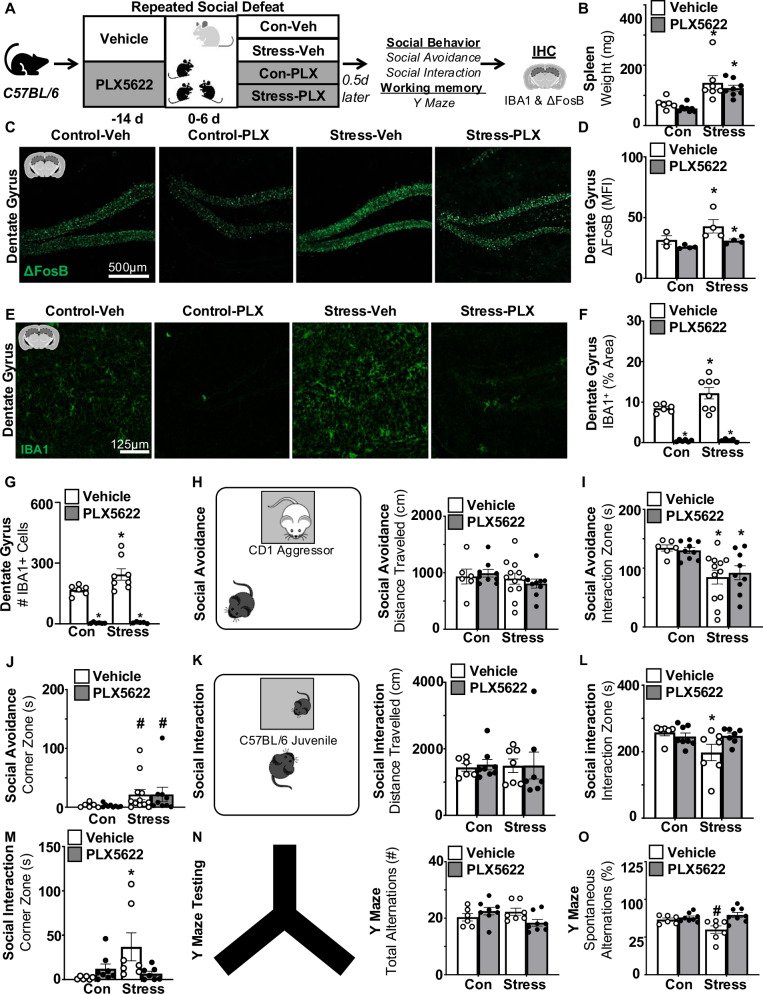
Fig. 6 Stress-induced social withdrawal and impaired spatial memory were microglia-dependent. A Male C57BL/6 mice were administered diets supplemented with Vehicle (Veh) or PLX5622 (PLX) for 14 d. Next, mice were subjected to RSD (stress) or left undisturbed (control). Mice were on diets for the duration of the experiment. Fourteen hours after RSD, social avoidance of a CD1 aggressor, social interaction with a novel juvenile, and working memory (Y-Maze) were assessed. After testing, samples were collected. B Spleen weight 14 h after RSD (n = 6–10). C Representative images and D mean fluorescence intensity (MFI) of ΔFosB labeling in the hippocampus (n = 4). E Representative images, F percent area and G count of IBA1+ cells in the hippocampus (n = 6–8). H Social avoidance of a CD1 aggressor mouse and total distance (cm) traveled during testing (n = 6–8). I Time spent in the interaction zone with the CD1 aggressor mouse during social avoidance testing. J Time spent in the corner zone during social avoidance testing. In a separate experiment, social interaction with a novel juvenile and Y-Maze were determined. K Social interaction with a novel C57BL/6 juvenile mouse and distance total distance (cm) traveled during testing (n = 8–10). L Time spent in the interaction zone with the C57BL/6 juvenile mouse. M Time spent in the corner zone during social interaction testing. In the same mice, working memory in the Y-Maze was also determined (n = 6–10). N Y-Maze assessment and total arm alternation during testing. O The percentage of successful spontaneous alternations during Y-Maze testing. Graphs represent the mean ± SEM, and individual data points are provided. Means with (*) are significantly different from controls (p < 0.05). Means with (#) tended to be different from controls (p = 0.06).
Fig. 6 Stress-induced social withdrawal and impaired spatial memory were microglia-dependent. A Male C57BL/6 mice were administered diets supplemented with Vehicle (Veh) or PLX5622 (PLX) for 14 d. Next, mice were subjected to RSD (stress) or left undisturbed (control). Mice were on diets for the duration of the experiment. Fourteen hours after RSD, social avoidance of a CD1 aggressor, social interaction with a novel juvenile, and working memory (Y-Maze) were assessed. After testing, samples were collected. B Spleen weight 14 h after RSD (n = 6–10). C Representative images and D mean fluorescence intensity (MFI) of ΔFosB labeling in the hippocampus (n = 4). E Representative images, F percent area and G count of IBA1+ cells in the hippocampus (n = 6–8). H Social avoidance of a CD1 aggressor mouse and total distance (cm) traveled during testing (n = 6–8). I Time spent in the interaction zone with the CD1 aggressor mouse during social avoidance testing. J Time spent in the corner zone during social avoidance testing. In a separate experiment, social interaction with a novel juvenile and Y-Maze were determined. K Social interaction with a novel C57BL/6 juvenile mouse and distance total distance (cm) traveled during testing (n = 8–10). L Time spent in the interaction zone with the C57BL/6 juvenile mouse. M Time spent in the corner zone during social interaction testing. In the same mice, working memory in the Y-Maze was also determined (n = 6–10). N Y-Maze assessment and total arm alternation during testing. O The percentage of successful spontaneous alternations during Y-Maze testing. Graphs represent the mean ± SEM, and individual data points are provided. Means with (*) are significantly different from controls (p < 0.05). Means with (#) tended to be different from controls (p = 0.06).CC BY-NC-ND · PubMed Central
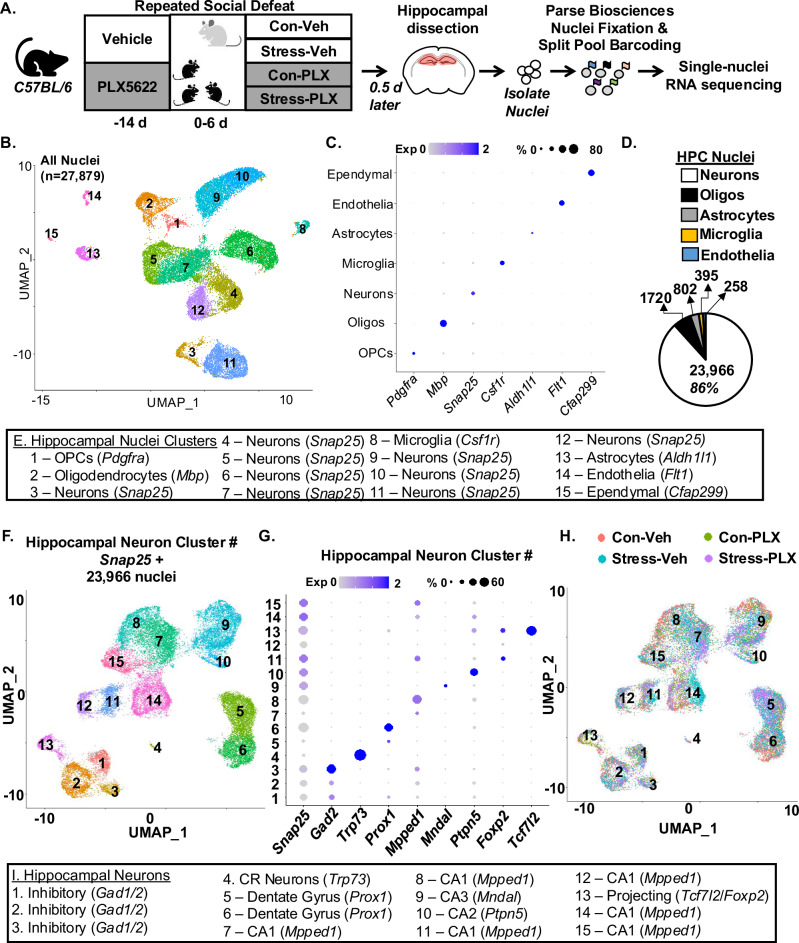
Fig. 7 Single-nuclei RNA sequencing in the hippocampus after RSD. A Male C57BL/6 mice were administered diets supplemented with Vehicle (Veh) or PLX5622 (PLX) for 14 d. Next, mice were subjected to RSD (stress) or left undisturbed (control). Mice were on diets for the duration of the experiment. Fourteen hours after RSD, the hippocampus was dissected and pooled (3 mice per group). Nuclei were collected, fixed, barcoded and nucleus RNA profiles were determined by snRNAseq. B UMAP clustering from a total of 27,897 nuclei identified 15 unique cell clusters. C Dot plot shows the expression of cell-specific markers in the 15 cell clusters. D Pie chart showing the distribution of nuclei identities across all sequenced nuclei. E Annotation of each cell cluster based on markers detected within the ConservedMarkers function. F UMAP clustering from a total of 23,966 Snap25+ neuronal nuclei identified 15 unique neuronal clusters. G Expression of neuronal-specific markers found within the ConservedMarkers function: neuron (Snap25), inhibitory (Gad2), Cajal-Retzius (Trp73), dentate gyrus (Prox1), CA1 (Mpped1), CA3 (Mndal), CA2 (Ptpn5), projecting (Foxp2 and Tcfl2). H Neuronal cluster distribution for each group: Con-Veh, Stress-Veh, Con-PLX, and Stress-PLX. I Annotation of neuronal subtype based on the ConservedMarkers function. Clustering and differential expression were determined using uniform manifold approximation and projections (UMAP) clustering command in Seurat. Pooled samples for 3 replicates.
Fig. 7 Single-nuclei RNA sequencing in the hippocampus after RSD. A Male C57BL/6 mice were administered diets supplemented with Vehicle (Veh) or PLX5622 (PLX) for 14 d. Next, mice were subjected to RSD (stress) or left undisturbed (control). Mice were on diets for the duration of the experiment. Fourteen hours after RSD, the hippocampus was dissected and pooled (3 mice per group). Nuclei were collected, fixed, barcoded and nucleus RNA profiles were determined by snRNAseq. B UMAP clustering from a total of 27,897 nuclei identified 15 unique cell clusters. C Dot plot shows the expression of cell-specific markers in the 15 cell clusters. D Pie chart showing the distribution of nuclei identities across all sequenced nuclei. E Annotation of each cell cluster based on markers detected within the ConservedMarkers function. F UMAP clustering from a total of 23,966 Snap25+ neuronal nuclei identified 15 unique neuronal clusters. G Expression of neuronal-specific markers found within the ConservedMarkers function: neuron (Snap25), inhibitory (Gad2), Cajal-Retzius (Trp73), dentate gyrus (Prox1), CA1 (Mpped1), CA3 (Mndal), CA2 (Ptpn5), projecting (Foxp2 and Tcfl2). H Neuronal cluster distribution for each group: Con-Veh, Stress-Veh, Con-PLX, and Stress-PLX. I Annotation of neuronal subtype based on the ConservedMarkers function. Clustering and differential expression were determined using uniform manifold approximation and projections (UMAP) clustering command in Seurat. Pooled samples for 3 replicates.CC BY-NC-ND · PubMed Central
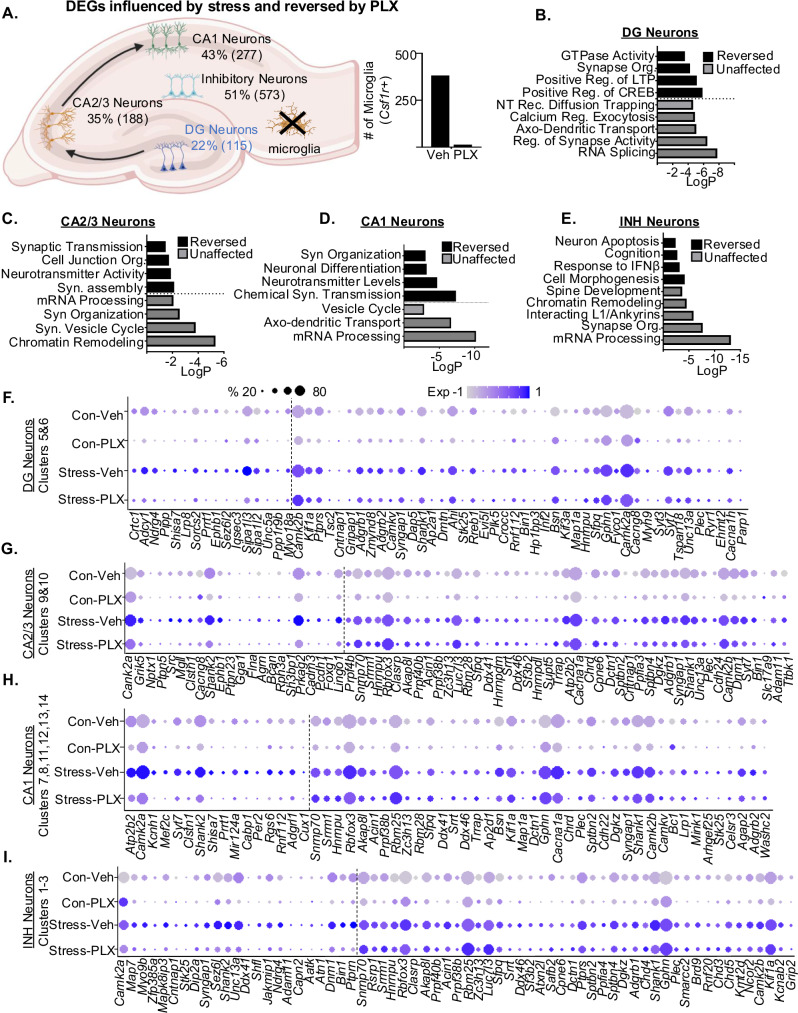
Fig. 8 Both microglia-dependent and independent profiles of hippocampal neurons were evident after stress. Continuing with the snRNAseq of Snap25+ neurons, differentially expressed genes (DEG) were assessed. A Hippocampal diagram with the number of (DEG) influenced by RSD and dependent on microglia in DG, CA2/3, CA1 and INH neurons. Number of microglia nuclei in snRNAseq data set for the control and PLX5622 groups are shown. B Gene Ontology (GO) function analysis for stress-induced DEGs (p-adj < 0.05) in DG neurons reversed or unaffected by microglia depletion (PLX). C GO function analysis for stress-induced DEGs (p-adj < 0.05) in CA2/3 neurons reversed or unaffected by microglia depletion (PLX). D GO function for stress-induced DEGs (p-adj < 0.05) in CA1 neurons reversed or unaffected by microglia depletion (PLX). E GO function analysis for stress-induced DEGs (p-adj < 0.05) in INH neurons reversed or unaffected by microglia depletion (PLX). Dot plot shows relative and proportional expression of stress-induced DEGs (p-adj < 0.05) that were reversed or unaffected by microglia depletion (PLX) in F DG neurons, G CA2/3 neurons, H CA1 neurons, and I INH neurons.
Fig. 8 Both microglia-dependent and independent profiles of hippocampal neurons were evident after stress. Continuing with the snRNAseq of Snap25+ neurons, differentially expressed genes (DEG) were assessed. A Hippocampal diagram with the number of (DEG) influenced by RSD and dependent on microglia in DG, CA2/3, CA1 and INH neurons. Number of microglia nuclei in snRNAseq data set for the control and PLX5622 groups are shown. B Gene Ontology (GO) function analysis for stress-induced DEGs (p-adj < 0.05) in DG neurons reversed or unaffected by microglia depletion (PLX). C GO function analysis for stress-induced DEGs (p-adj < 0.05) in CA2/3 neurons reversed or unaffected by microglia depletion (PLX). D GO function for stress-induced DEGs (p-adj < 0.05) in CA1 neurons reversed or unaffected by microglia depletion (PLX). E GO function analysis for stress-induced DEGs (p-adj < 0.05) in INH neurons reversed or unaffected by microglia depletion (PLX). Dot plot shows relative and proportional expression of stress-induced DEGs (p-adj < 0.05) that were reversed or unaffected by microglia depletion (PLX) in F DG neurons, G CA2/3 neurons, H CA1 neurons, and I INH neurons.CC BY-NC-ND · PubMed Central
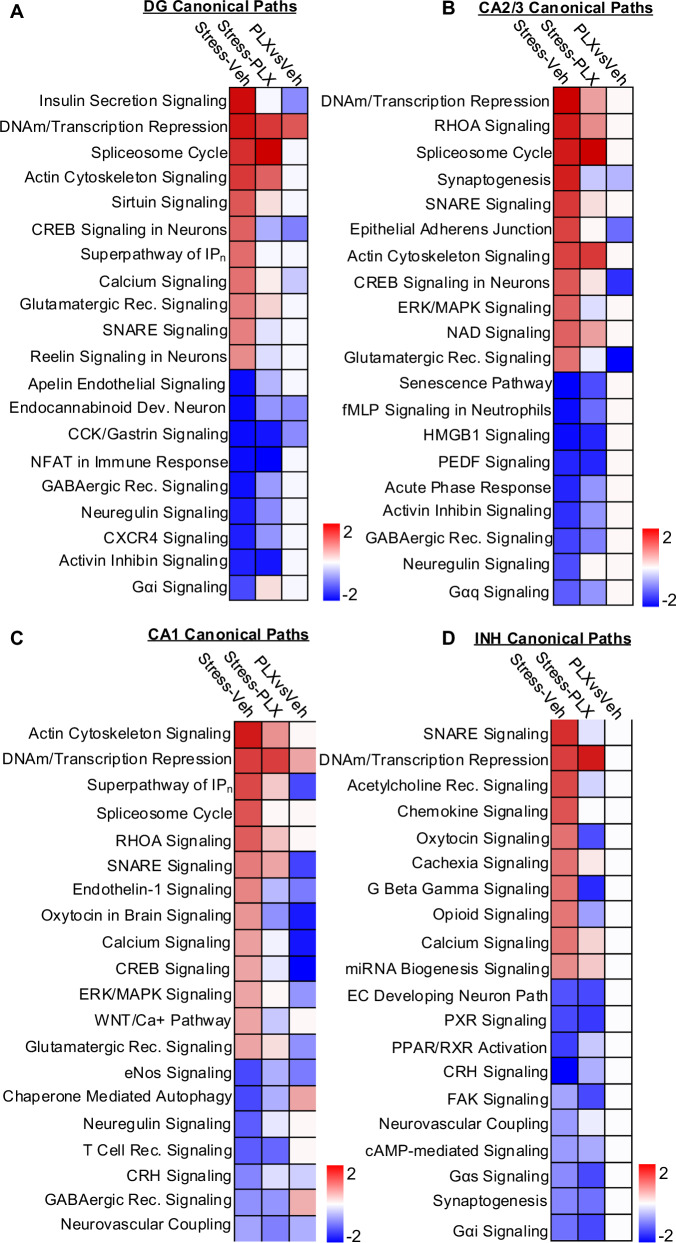
Fig. 9 Canonical pathways enriched in hippocampal neurons after stress were both microglia-dependent and independent. Continuing of the snRNAseq of Snap25+ neurons, DEGs (p-adj < 0.05) were used in IPA to determine significant (z-score ≥ ±1.5) canonical pathways in DG, CA2/3, CA1 and INH neurons with Stress-Veh, Stress-PLX, and Stress-PLX vs Stress-Veh comparisons. A Heatmap of significant (z-score ≥ ±1.5) canonical pathways for Stress-Veh, Stress-PLX, and Stress-PLX vs Stress-Veh in hippocampal dentate gyrus (Prox1) neurons. B Heatmap of significant (z-score ≥ ±1.5) canonical pathways for Stress-Veh, Stress-PLX, and Stress-PLX vs Stress-Veh in hippocampal CA2/3 (Ptpn5 or Mndal), neurons. C Heatmap of significant (z-score ≥ ±1.5) canonical pathways for Stress-Veh, Stress-PLX, and Stress-PLX vs Stress-Veh in hippocampal CA1 (Mpped1) neurons. D Heatmap of significant (z-score ≥ ±1.5) canonical pathways for Stress-Veh, Stress-PLX, and Stress-PLX vs Stress-Veh in hippocampal inhibitory (Gad1/2) neurons.
Fig. 9 Canonical pathways enriched in hippocampal neurons after stress were both microglia-dependent and independent. Continuing of the snRNAseq of Snap25+ neurons, DEGs (p-adj < 0.05) were used in IPA to determine significant (z-score ≥ ±1.5) canonical pathways in DG, CA2/3, CA1 and INH neurons with Stress-Veh, Stress-PLX, and Stress-PLX vs Stress-Veh comparisons. A Heatmap of significant (z-score ≥ ±1.5) canonical pathways for Stress-Veh, Stress-PLX, and Stress-PLX vs Stress-Veh in hippocampal dentate gyrus (Prox1) neurons. B Heatmap of significant (z-score ≥ ±1.5) canonical pathways for Stress-Veh, Stress-PLX, and Stress-PLX vs Stress-Veh in hippocampal CA2/3 (Ptpn5 or Mndal), neurons. C Heatmap of significant (z-score ≥ ±1.5) canonical pathways for Stress-Veh, Stress-PLX, and Stress-PLX vs Stress-Veh in hippocampal CA1 (Mpped1) neurons. D Heatmap of significant (z-score ≥ ±1.5) canonical pathways for Stress-Veh, Stress-PLX, and Stress-PLX vs Stress-Veh in hippocampal inhibitory (Gad1/2) neurons.CC BY-NC-ND · PubMed Central

Verification

Claims the paper makes

The claims and statistics of this paper haven’t been checked yet.

Run the check — free, no account needed. It reads the open-access text and checks the sources it cites.

A few free checks a day · papers already verified open instantly · results are public

Claims other papers make about this one

Each is checked against this paper’s own text: does it say what the citing paper says it does?

Self-check

Percentages, sums and reported differences re-computed from the paper’s own numbers.

The self-check needs the paper’s full text.

Citations

Cites

Show all 17 references

Research works printed but not linked: 68

  1. Miller, G. E. et al. Greater inflammatory activity and blunted glucocorticoid signaling in monocytes of chronically stressed caregivers. Brain Behav. Immun. 41, 191–199 (2014). · DOI · Paper page
  2. Weber, M. D. et al. The influence of microglial elimination and repopulation on stress sensitization induced by repeated social defeat. Biol. Psychiatry 85, 667–678 (2019). · DOI
  3. McKim, D. B. et al. Social stress mobilizes hematopoietic stem cells to establish persistent splenic myelopoiesis. Cell Rep. 25, 2552–2562.e3 (2018). · DOI · Paper page
  4. Biltz, R. G., Sawicki, C. M., Sheridan, J. F. & Godbout, J. P. The neuroimmunology of social-stress-induced sensitization. Nat. Immunol. 23, 1527–1535 (2022). · DOI · Paper page
  5. McKim, D. B. et al. Microglial recruitment of IL-1β-producing monocytes to brain endothelium causes stress-induced anxiety. Mol. Psychiatry 23, 1421–1431 (2018). · DOI · Paper page
  6. Biltz, R. G. et al. Antagonism of the brain P2X7 ion channel attenuates repeated social defeat induced microglia reactivity, monocyte recruitment and anxiety-like behavior in male mice. Brain Behav. Immun. 115, 356–373 (2024). · DOI
  7. Yin, W. et al. Unique brain endothelial profiles activated by social stress promote cell adhesion, prostaglandin E2 signaling, hypothalamic–pituitary–adrenal axis modulation, and anxiety. Neuropsychopharmacology 47, 2271–2282 (2022). · DOI
  8. Wohleb, E. S. et al. Re-establishment of anxiety in stress-sensitized mice is caused by monocyte trafficking from the spleen to the brain. Biol. Psychiatry 75, 970–981 (2014). · DOI · Paper page
  9. DiSabato, D. J. et al. IL-1 receptor-1 on Vglut2+ neurons in the hippocampus is critical for neuronal and behavioral sensitization after repeated social stress. Brain Behav. Immun. Health 26, 100547 (2022). · DOI
  10. Weber, M. D. et al. The influence of microglial elimination and repopulation on stress sensitization induced by repeated social defeat. Biol. Psychiatry 85, 667–678 (2019). · DOI
  11. Baharikhoob, P. & Kolla, N. J. Microglial dysregulation and suicidality: a stress-diathesis perspective. Front. Psychiatry 11, 781 (2020). · DOI
  12. DiSabato, D. J. et al. Interleukin-1 receptor on hippocampal neurons drives social withdrawal and cognitive deficits after chronic social stress. Mol. Psychiatry 26, 4770–4782 (2021). · DOI
  13. Goodman, E. J. et al. Enhanced fear memory after social defeat in mice is dependent on interleukin-1 receptor signaling in glutamatergic neurons. Mol. Psychiatry https://doi.org/10.1038/s41380-024-02456-1 (2024). · DOI
  14. O’Neil, S. M., Hans, E. E., Jiang, S., Wangler, L. M. & Godbout, J. P. Astrocyte immunosenescence and deficits in interleukin 10 signaling in the aged brain disrupt the regulation of microglia following innate immune activation. Glia 70, 913–934 (2022). · DOI
  15. Witcher, K. G. et al. Traumatic brain injury causes chronic cortical inflammation and neuronal dysfunction mediated by microglia. J. Neurosci. 41, 1597–1616 (2021). · DOI · Paper page
  16. Kulkarni, A., Anderson, A. G., Merullo, D. P. & Konopka, G. Beyond bulk: a review of single cell transcriptomics methodologies and applications. Curr. Opin. Biotechnol. 58, 129–136 (2019). · DOI
  17. Bray, C. E. et al. Chronic cortical inflammation, cognitive impairment, and immune reactivity associated with diffuse brain injury are ameliorated by forced turnover of microglia. J. Neurosci. 42, 4215–4228 (2022). · DOI
  18. Pettas, S. et al. Profiling microglia through single-cell RNA sequencing over the course of development, aging, and disease. Cells 11, 2383 (2022). · DOI
  19. Wohleb, E. S., Powell, N. D., Godbout, J. P. & Sheridan, J. F. Stress-induced recruitment of bone marrow-derived monocytes to the brain promotes anxiety-like behavior. J. Neurosci. 33, 13820–13833 (2013). · DOI · Paper page
  20. Heithoff, B. P. et al. Astrocytes are necessary for blood–brain barrier maintenance in the adult mouse brain. Glia 69, 436–472 (2021). · DOI
  21. Luarte, A. et al. Astrocyte-derived extracellular vesicles in stress-associated mood disorders. Does the immune system get astrocytic? Pharmacol. Res. 194, 106833 (2023). · DOI
  22. Gross, I. et al. Sprouty2 inhibits BDNF-induced signaling and modulates neuronal differentiation and survival. Cell Death Differ. 14, 1802–1812 (2007). · DOI
  23. Zhang, Y. et al. Overexpression of long noncoding RNA Malat1 ameliorates traumatic brain injury induced brain edema by inhibiting AQP4 and the NF‐κB/IL‐6 pathway. J. Cell. Biochem. 120, 17584–17592 (2019). · DOI
  24. Steiner, B. et al. Differential regulation of gliogenesis in the context of adult hippocampal neurogenesis in mice. Glia 46, 41–52 (2004). · DOI
  25. Liu, J., Wu, X. & Lu, Q. Molecular divergence of mammalian astrocyte progenitor cells at early gliogenesis. Development 149, dev199985 (2022). · DOI
  26. Ramirez, K., Niraula, A. & Sheridan, J. F. GABAergic modulation with classical benzodiazepines prevent stress-induced neuro-immune dysregulation and behavioral alterations. Brain Behav. Immun. 51, 154–168 (2016). · DOI · Paper page
  27. Rosenberg, A. B. et al. Single-cell profiling of the developing mouse brain and spinal cord with split-pool barcoding. Science 360, 176–182 (2018). · DOI · Paper page
  28. Packer, J. M. et al. Impaired cortical neuronal homeostasis and cognition after diffuse traumatic brain injury are dependent on microglia and type I interferon responses. Glia 72, 300–321 (2024). · DOI
  29. Zhong, S. et al. Single-nucleus RNA sequencing reveals transcriptional changes of hippocampal neurons in APP23 mouse model of Alzheimer’s disease. Biosci. Biotechnol. Biochem. 84, 919–926 (2020). · DOI
  30. Niraula, A., Witcher, K. G., Sheridan, J. F. & Godbout, J. P. Interleukin-6 induced by social stress promotes a unique transcriptional signature in the monocytes that facilitate anxiety. Biol. Psychiatry 85, 679–689 (2019). · DOI · Paper page
  31. Lin, H.-Y. et al. Chemokine receptor 5 signaling in PFC mediates stress susceptibility in female mice. Preprint at bioRxiv https://doi.org/10.1101/2023.08.18.553789 (2023). · DOI
  32. Baron, C. S. et al. Cell type purification by single-cell transcriptome-trained sorting. Cell 179, 527–542.e519 (2019). · DOI
  33. Ishikawa, Y. et al. Repeated social defeat stress induces neutrophil mobilization in mice: maintenance after cessation of stress and strain‐dependent difference in response. Br. J. Pharmacol. 178, 827–844 (2021). · DOI
  34. Pflieger, F. J. et al. The role of neutrophil granulocytes in immune-to-brain communication. Temperature 5, 296–307 (2018). · DOI
  35. Vichaya, E. G. et al. Microglia depletion fails to abrogate inflammation-induced sickness in mice and rats. J. Neuroinflammation 17, 1–14 (2020). · DOI
  36. Bosch, A. J. et al. CSF1R inhibition with PLX5622 affects multiple immune cell compartments and induces tissue-specific metabolic effects in lean mice. Diabetologia 66, 2292–2306 (2023). · DOI
  37. Green, K. N. & Hume, D. A. On the utility of CSF1R inhibitors. Proc. Natl Acad. Sci. USA 118, e2019695118 (2021). · DOI
  38. Tang, J., Yu, W., Chen, S., Gao, Z. & Xiao, B. Microglia polarization and endoplasmic reticulum stress in chronic social defeat stress induced depression mouse. Neurochem. Res. 43, 985–994 (2018). · DOI
  39. Bond, S., Lopez-Lloreda, C., Gannon, P. J., Akay-Espinoza, C. & Jordan-Sciutto, K. L. The integrated stress response and phosphorylated eukaryotic initiation factor 2α in neurodegeneration. J. Neuropathol. Exp. Neurol. 79, 123–143 (2020). · DOI
  40. Song, X. et al. Fcγ receptor I-and III-mediated macrophage inflammatory protein 1α induction in primary human and murine microglia. Infect. Immun. 70, 5177–5184 (2002). · DOI
  41. Cao, S., Standaert, D. G. & Harms, A. S. The gamma chain subunit of Fc receptors is required for alpha-synuclein-induced pro-inflammatory signaling in microglia. J. Neuroinflammation 9, 1–11 (2012). · DOI
  42. Milior, G. et al. Fractalkine receptor deficiency impairs microglial and neuronal responsiveness to chronic stress. Brain Behav. Immun. 55, 114–125 (2016). · DOI
  43. Bollinger, J. L. et al. Microglial P2Y12 mediates chronic stress-induced synapse loss in the prefrontal cortex and associated behavioral consequences. Neuropsychopharmacology 48, 1347–1357 (2023). · DOI
  44. Liang, T. et al. Galectin-9 promotes neuronal restoration via binding TLR-4 in a rat intracerebral hemorrhage model. Neuromolecular Med. 23, 267–284 (2021). · DOI
  45. Liu, J., Huang, S. & Lu, F. Galectin-3 and Galectin-9 may differently regulate the expressions of microglial M1/M2 markers and T helper 1/Th2 cytokines in the brains of genetically susceptible C57BL/6 and resistant BALB/c mice following peroral infection with Toxoplasma gondii. Front. Immunol. 9, 1648 (2018). · DOI
  46. Xia, C., Braunstein, Z., Toomey, A. C., Zhong, J. & Rao, X. S100 proteins as an important regulator of macrophage inflammation. Front. Immunol. 8, 1908 (2018). · DOI
  47. Gong, H. et al. Hippocampal Mrp8/14 signaling plays a critical role in the manifestation of depressive-like behaviors in mice. J. Neuroinflammation 15, 1–13 (2018). · DOI
  48. Schramm, E. & Waisman, A. Microglia as central protagonists in the chronic stress response. Neurol. Neuroimmunol. Neuroinflamm. 9, e200023 (2022). · DOI
  49. van den Brink, S. C. et al. Single-cell sequencing reveals dissociation-induced gene expression in tissue subpopulations. Nat. Methods 14, 935–936 (2017). · DOI · Paper page
  50. Wahis, J. et al. Astrocytes mediate the effect of oxytocin in the central amygdala on neuronal activity and affective states in rodents. Nat. Neurosci. 24, 529–541 (2021). · DOI
  51. Lin, Y.-T. & Hsu, K.-S. Oxytocin receptor signaling in the hippocampus: role in regulating neuronal excitability, network oscillatory activity, synaptic plasticity and social memory. Prog. Neurobiol. 171, 1–14 (2018). · DOI
  52. Jin, Y., Song, D., Yan, Y., Quan, Z. & Qing, H. The role of oxytocin in early-life-stress-related neuropsychiatric disorders. Int. J. Mol. Sci. 24, 10430 (2023). · DOI
  53. Matusova, Z., Hol, E. M., Pekny, M., Kubista, M. & Valihrach, L. Reactive astrogliosis in the era of single-cell transcriptomics. Front. Cell. Neurosci. 17, 1173200 (2023). · DOI
  54. Joëls, M. & Krugers, H. J. LTP after stress: up or down? Neural Plasticity 2007, 93202 (2007). · DOI
  55. Ainge, J. A., Tamosiunaite, M., Woergoetter, F. & Dudchenko, P. A. Hippocampal CA1 place cells encode intended destination on a maze with multiple choice points. J. Neurosci. 27, 9769–9779 (2007). · DOI
  56. Kallarackal, A. J. et al. Chronic stress induces a selective decrease in AMPA receptor-mediated synaptic excitation at hippocampal temporoammonic-CA1 synapses. J. Neurosci. 33, 15669–15674 (2013). · DOI · Paper page
  57. Yu, J.-Y. et al. Dorsal CA1 interneurons contribute to acute stress-induced spatial memory deficits. Neuropharmacology 135, 474–486 (2018). · DOI
  58. Yin, W. et al. Repeated social defeat in female mice induces anxiety-like behavior associated with enhanced myelopoiesis and increased monocyte accumulation in the brain. Brain Behav. Immun. 78, 131–142 (2019). · DOI
  59. Dion-Albert, L. et al. Vascular and blood-brain barrier-related changes underlie stress responses and resilience in female mice and depression in human tissue. Nat. Commun. 13, 164 (2022). · DOI
  60. Takahashi, A. et al. Establishment of a repeated social defeat stress model in female mice. Sci. Rep. 7, 12838 (2017). · DOI · Paper page
  61. Govek, K. W. et al. CAJAL enables analysis and integration of single-cell morphological data using metric geometry. Nat. Commun. 14, 3672 (2023). · DOI
  62. Butler, A., Hoffman, P., Smibert, P., Papalexi, E. & Satija, R. Integrating single-cell transcriptomic data across different conditions, technologies, and species. Nat. Biotechnol. 36, 411–420 (2018). · DOI · Paper page
  63. O’Neil, S. M., Witcher, K. G., McKim, D. B. & Godbout, J. P. Forced turnover of aged microglia induces an intermediate phenotype but does not rebalance CNS environmental cues driving priming to immune challenge. Acta Neuropathol. Commun. 6, 129 (2018). · DOI
  64. Hao, Y. et al. Integrated analysis of multimodal single-cell data. Cell 184, 3573–3587.e3529 (2021). · DOI · Paper page
  65. Kalinina, A. & Lagace, D. Single-cell and single-nucleus RNAseq analysis of adult neurogenesis. Cells 11, 1633 (2022). · DOI
  66. Finak, G. et al. MAST: a flexible statistical framework for assessing transcriptional changes and characterizing heterogeneity in single-cell RNA sequencing data. Genome Biol. 16, 1–13 (2015). · DOI · Paper page
  67. Kramer, A., Green, J., Pollard, J. Jr. & Tugendreich, S. Causal analysis approaches in Ingenuity Pathway Analysis. Bioinformatics 30, 523–530 (2014). · DOI · Paper page
  68. Zhou, Y. et al. Metascape provides a biologist-oriented resource for the analysis of systems-level datasets. Nat. Commun. 10, 1523 (2019). · DOI · Paper page

Cited by

Sorted by citations

Metadata

Authors
Goodman, E. J., DiSabato, D. J., Sheridan, J. F., & Godbout, J. P.
Venue
Communications Biology
Published
2024-09-28
Volume
7
Issue
1
ISSN
2399-3642
Cited by
19
References
17
Language
en
Funders
U.S. Department of Health & Human Services | NIH | National Institute of Mental Health (R01-MH-119670, R01-MH-116670)

About these checks

Registry, retraction, Cites and statistics results are computed, not judged, with one exception: a printed reference that no index lists is read once by a model before it counts as a citation error. Claims are extracted by a model and kept only when their quote appears verbatim in the text; each cited source is then checked, with a model’s help, for whether it says what the claim relies on. Those verdicts can be wrong — read the claim’s quote and the cited source before relying on one.

Statistics and arithmetic are recomputed, not judged.

Confidence bands are shown only for fields calibrated on our annotated test set. None is calibrated yet, so no band is shown.

What counts as a claim ›How we measure confidence ›How we check this ›

Are you an author, or do you see a problem with this page? Request a review