

The DOI matches its Crossref record; 4 of the 4 references it cites were found in a registry or an index.
SwinCell: a 3D transformer and flow-based framework for improved cell segmentation
Open accessPublished version of a preprint
Abstract
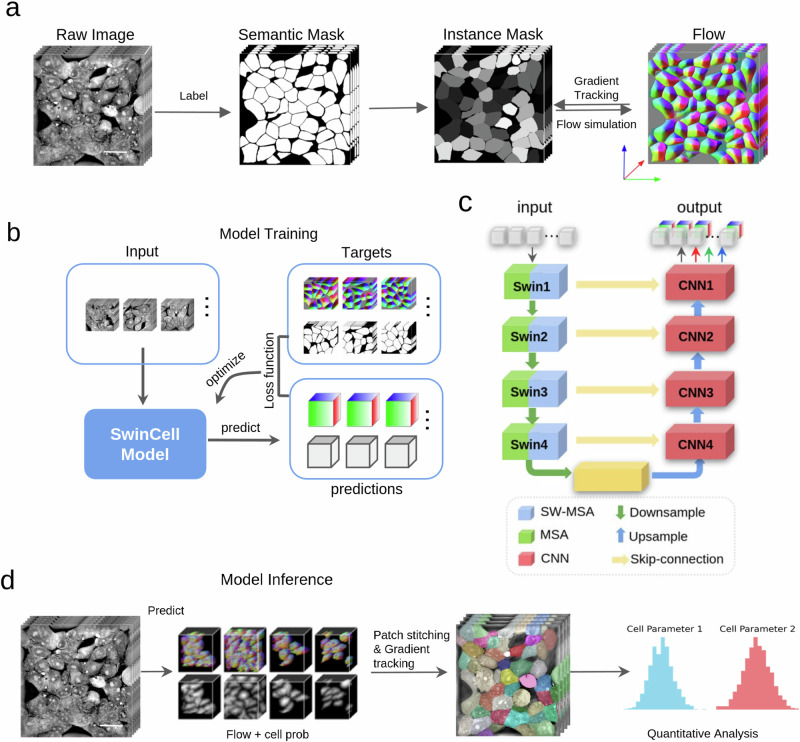
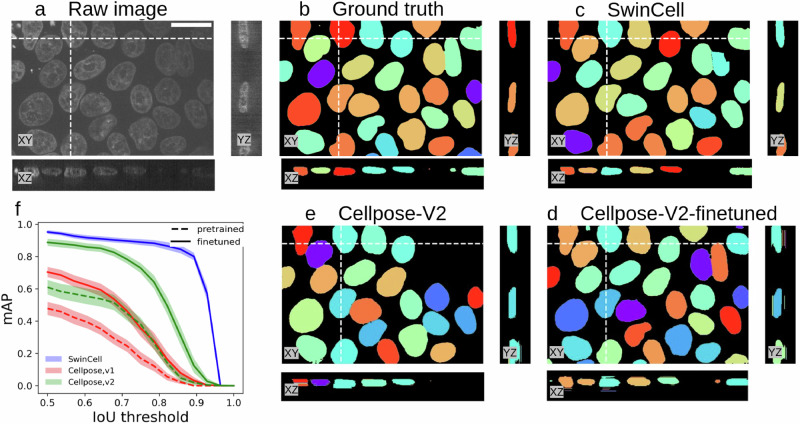
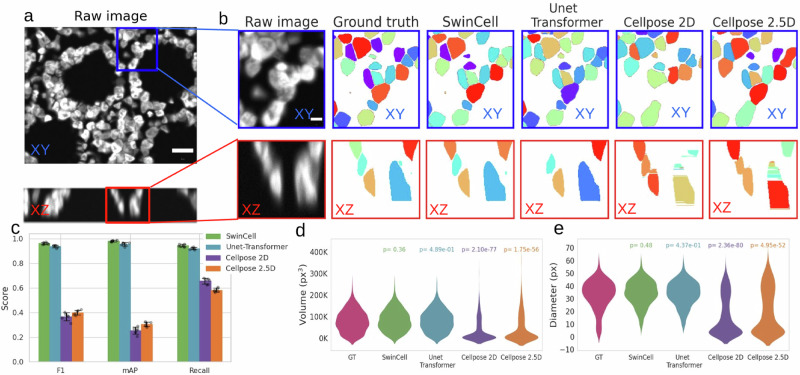
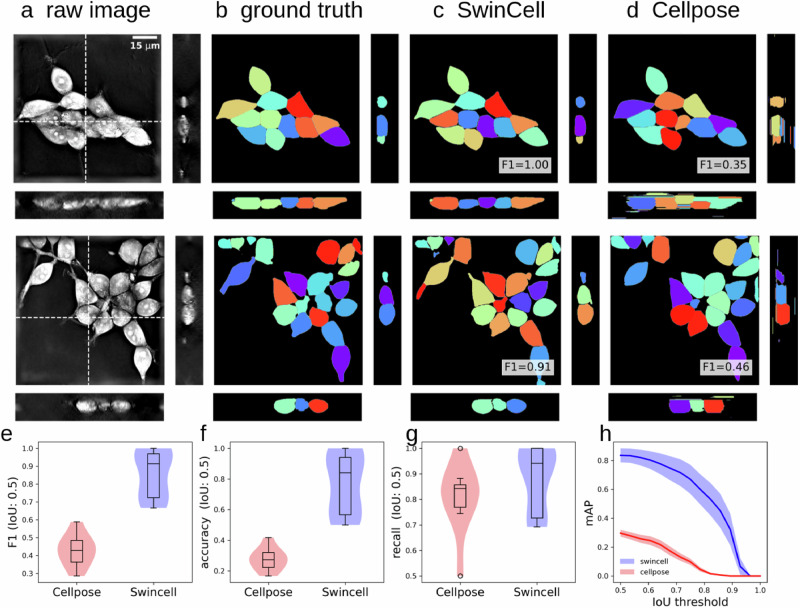
Abstract Segmentation of three-dimensional (3D) cellular images is fundamental for studying and understanding cell structure and function. However, 3D cellular segmentation is challenging, particularly for dense cells and tissues. This challenge arises mainly from the complex contextual information within 3D images, anisotropic properties, and the sensitivity to internal cellular structures, which often lead to miss-segmentation. In this work, we introduce SwinCell, a 3D transformer-based framework that leverages Swin-transformer for flow prediction and effectively distinguishes individual cell instances in 3D. We demonstrate the broad utility of the SwinCell in the segmentation of nuclei, colon tissue cells, and dense cultured cells. SwinCell strikes a balance between maintaining detailed local feature recognition and understanding broader contextual information. Tested extensively with both public and in-house 3D cell imaging datasets, SwinCell shows superior performance in segmenting dense cells in 3D, making it a powerful 3D segmentation tool for cellular analysis that could expedite research in cell biology and tissue engineering.
Overview
The claims and statistics of this paper haven’t been checked yet.
Run the check — free, no account needed. It reads the open-access text and checks the sources it cites.
Integrity signals
Registry
Cites
Statistics
Figures
Verification
Claims the paper makes
The claims and statistics of this paper haven’t been checked yet.
Run the check — free, no account needed. It reads the open-access text and checks the sources it cites.
Self-check
Percentages, sums and reported differences re-computed from the paper’s own numbers.
The self-check needs the paper’s full text.
Citations
Cites
U-Net: Convolutional Networks for Biomedical Image Segmentation
Ronneberger, O., Fischer, P., & Brox, T. (2015) · Lecture notes in computer science · doi:10.1007/978-3-319-24574-4_28 · Cited by 99,404
Swin Transformer: Hierarchical Vision Transformer using Shifted Windows
Liu, Z., Lin, Y., Cao, Y., Hu, H., Wei, Y., Zhang, Z., Lin, S., & Guo, B. (2021) · 2021 IEEE/CVF International Conference on Computer Vision (ICCV) · doi:10.1109/iccv48922.2021.00986 · Cited by 35,534
Self-citationCellpose 2.0: how to train your own model
Pachitariu, M., & Stringer, C. (2022) · Nature Methods · doi:10.1038/s41592-022-01663-4 · Cited by 1,381
Integrated intracellular organization and its variations in human iPS cells
Viana, M. P., Chen, J., Knijnenburg, T. A., Vasan, R., Yan, C., Arakaki, J. E., Bailey, M., Berry, B., Borensztejn, A., Brown, E. M., et al. (2023) · Nature · doi:10.1038/s41586-022-05563-7 · Cited by 132
Research works printed but not linked: 34
- Pérez-Montero, A., Zaragoza, O., Luque, A., Hortelano, S. & Acebo, P. Visualization of lipid droplets in the alveolar macrophage cell line MH-S with live-cell imaging by 3D holotomographic microscopy (Nanolive). Bio-Protoc. 13, e4629 (2023). · DOI
- Lin, Z. et al. Correlative single-cell hard X-ray computed tomography and X-ray fluorescence imaging. Commun. Biol. 7, 1–9 (2024). · DOI
- Hou, Z., Nightingale, F., Zhu, Y., MacGregor-Chatwin, C. & Zhang, P. Structure of native chromatin fibres revealed by Cryo-ET in situ. Nat. Commun. 14, 6324 (2023). · DOI
- Chen, M. et al. A complete data processing workflow for cryo-ET and subtomogram averaging. Nat. Methods 16, 1161–1168 (2019). · DOI
- Xu, C. S. et al. An open-access volume electron microscopy atlas of whole cells and tissues. Nature 599, 147–151 (2021). · DOI
- Lu, M. et al. ERnet: a tool for the semantic segmentation and quantitative analysis of endoplasmic reticulum topology. Nat. Methods 20, 569–579 (2023). · DOI
- Jiménez, J., Doerr, S., Martínez-Rosell, G., Rose, A. S. & De Fabritiis, G. DeepSite: protein-binding site predictor using 3D-convolutional neural networks. Bioinforma. Oxf. Engl. 33, 3036–3042 (2017). · DOI
- Heinrich, L. et al. Whole-cell organelle segmentation in volume electron microscopy. Nature 599, 141–146 (2021). · DOI
- Greenwald, N. F. et al. Whole-cell segmentation of tissue images with human-level performance using large-scale data annotation and deep learning. Nat. Biotechnol. 40, 555–565 (2022). · DOI · Paper page
- Stringer, C., Wang, T., Michaelos, M. & Pachitariu, M. Cellpose: a generalist algorithm for cellular segmentation. Nat. Methods 18, 100–106 (2021). · DOI · Paper page
- He, K., Gkioxari, G., Dollár, P. & Girshick, R. Mask R-CNN. Proc. IEEE Int. Conf. Comput. Vis. 2017, 2980–2988 https://doi.ieeecomputersociety.org/10.1109/ICCV.2017.322. (2017). · DOI · Paper page
- Li, G. et al. Segmentation of touching cell nuclei using gradient flow tracking. J. Microsc. 231, 47–58 (2008). · DOI
- Weigert, M., Schmidt, U., Haase, R., Sugawara, K. & Myers, G. Star-convex polyhedra for 3D object detection and segmentation in microscopy. Proc. IEEE Winter Conf. Appl. Comput. Vis. 2020, 3655–3662 (2020).
- Schmidt, U., Weigert, M., Broaddus, C. & Myers, G. Cell detection with star-convex polygons. Lect. Notes Comput. Sci. 11071, 265–273 (2018). · DOI · Paper page
- Eisenstein, M. AI under the microscope: the algorithms powering the search for cells. Nature 623, 1095–1097 (2023). · DOI
- Vaswani, A. et al. Attention is all you need. Adv. Neural Inf. Process. Syst. 30, 5998–6008 (2017).
- Hatamizadeh, A. et al. Swin UNETR: Swin transformers for semantic segmentation of brain tumors in MRI images. Lect. Notes Comput. Sci. 12962, 272–284 (2022). · DOI · Paper page
- Çiçek, Ö, Abdulkadir, A., Lienkamp, S. S., Brox, T. & Ronneberger, O. 3D U-Net: Learning dense volumetric segmentation from sparse annotation. Lect. Notes Comput. Sci. 9901, 424–432 (2016). · DOI · Paper page
- Ounkomol, C., Seshamani, S., Maleckar, M. M., Collman, F. & Johnson, G. R. Label-free prediction of three-dimensional fluorescence images from transmitted-light microscopy. Nat. Methods 15, 917–920 (2018). · DOI · Paper page
- Wagner, F. R. et al. Preparing samples from whole cells using focused-ion-beam milling for cryo-electron tomography. Nat. Protoc. 15, 2041–2070 (2020). · DOI
- He, J., Li, T. & Huang, S.-Y. Improvement of cryo-EM maps by simultaneous local and non-local deep learning. Nat. Commun. 14, 3217 (2023). · DOI
- Paul, S. & Chen, P.-Y. Vision Transformers Are Robust Learners. Proc. AAAI Conf. Artif. Intell. 36, 2071–2081 (2022).
- Tang, Y. et al. Self-supervised pre-training of Swin transformers for 3D medical image analysis. Proc. IEEE/CVF Conf. Comput. Vis. Pattern Recognit. 2022, 20730–20740 (2022).
- Wagner, S. J. et al. Transformer-based biomarker prediction from colorectal cancer histology: A large-scale multicentric study. Cancer Cell 41, 1650–1661.e4 (2023). · DOI · Paper page
- Svoboda, D., Homola, O. & Stejskal, S. Generation of 3D digital phantoms of colon tissue. Lect. Notes Comput. Sci. 6754, 31–39 (2011). · DOI
- Paszke, A. et al. PyTorch: An imperative style, high-performance deep learning library. Adv. Neural Inf. Process. Syst. 32, 8024–8035 (2019).
- Kluyver, T. et al. Jupyter Notebooks—a publishing format for reproducible computational workflows. in: (eds Loizides, F. & Scmidt, B.) 87–90 (IOS Press, 2016). https://doi.org/10.3233/978-1-61499-649-1-87. · DOI
- Hunter, J. D. Matplotlib: a 2D Graphics Environment. Comput. Sci. Eng. 9, 90–95 (2007). · DOI · Paper page
- Waskom, M. L. seaborn: statistical data visualization. J. Open Source Softw. 6, 3021 (2021). · DOI · Paper page
- Yushkevich, P. A. et al. User-guided 3D active contour segmentation of anatomical structures: significantly improved efficiency and reliability. NeuroImage 31, 1116–1128 (2006). · DOI · Paper page
- Cardoso, M. J. et al. MONAI: an open-source framework for deep learning in healthcare. Preprint at arXiv http://arxiv.org/abs/2211.02701 (2022). · arXiv
- Harris, C. R. et al. Array programming with NumPy. Nature 585, 357–362 (2020). · DOI · Paper page
- Virtanen, P. et al. SciPy 1.0: fundamental algorithms for scientific computing in Python. Nat. Methods 17, 261–272 (2020). · DOI · Paper page
- Eschweiler, D., Smith, R. S. & Stegmaier, J. Robust 3D cell segmentation: extending the view of Cellpose. Proc. IEEE Int. Conf. Image Process 2022, 9897942 (2022).
Metadata
- Authors
- Zhang, X., Lin, Z., Wang, L., Chu, Y. S., Yang, Y., Xiao, X., Lin, Y., & Liu, Q.
- Affiliations
- Brookhaven National Laboratory (US)
- Corresponding author
- Zhang, Xiao
- Lin, Yuewei
- Liu, Qun
- Venue
- Communications Biology
- Published
- 2025-07-01
- Volume
- 8
- Issue
- 1
- Pages
- 962-962
- ISSN
- 2399-3642 (ISSN-L)
- PMC
- PMC12218999
- OpenAlex
- W4411885557
- Cited by
- 7
- References
- 4
- Citations by year
- 2026: 5 · 2025: 2
- FWCI
- 2.64
- Type
- journal article
- Language
- en
- Open access
- gold
- doi.org
- Licence
- Locations
- Communications Biology (publishedVersion, cc-by-nc-nd)
- bioRxiv (Cold Spring Harbor Laboratory) (acceptedVersion, cc-by-nc)
- PubMed Central (publishedVersion, cc-by-nc-nd)
- PubMed (publishedVersion)
- DOAJ (DOAJ: Directory of Open Access Journals) (submittedVersion, cc-by-sa)
- Funders
- DOE | SC | Biological and Environmental Research (KP1601011)
- DOE | LDRD | Brookhaven National Laboratory (LDRD21-013)
- Topics
- Life Sciences › Biochemistry, Genetics and Molecular Biology › Biophysics › Cell Image Analysis Techniques
- Physical Sciences › Computer Science › Computer Vision and Pattern Recognition › Advanced Neural Network Applications
- Physical Sciences › Computer Science › Computer Vision and Pattern Recognition › Medical Image Segmentation Techniques
- Keywords
- 3D cell segmentation, Swin Transformer, nuclei segmentation, attention mechanism, tissue engineering
- MeSH terms
- Algorithms, Colon, Humans, Software, Imaging, Three-Dimensional
About these checks
Registry, retraction, Cites and statistics results are computed, not judged, with one exception: a printed reference that no index lists is read once by a model before it counts as a citation error. Claims are extracted by a model and kept only when their quote appears verbatim in the text; each cited source is then checked, with a model’s help, for whether it says what the claim relies on. Those verdicts can be wrong — read the claim’s quote and the cited source before relying on one.
Statistics and arithmetic are recomputed, not judged.
Confidence bands are shown only for fields calibrated on our annotated test set. None is calibrated yet, so no band is shown.
What counts as a claim ›How we measure confidence ›How we check this ›
Are you an author, or do you see a problem with this page? Request a review
How to cite
Cite CoChat for the checks on this page, and the paper for its own findings.
- This page
- CoChat. (2026). Citation check: SwinCell: a 3D transformer and flow-based framework for improved cell segmentation. https://app.cochat.ai/papers/10.1038/s42003-025-08397-x
- The paper
- Zhang, X., Lin, Z., Wang, L., Chu, Y. S., Yang, Y., Xiao, X., Lin, Y., & Liu, Q. (2025). SwinCell: a 3D transformer and flow-based framework for improved cell segmentation. Communications Biology. https://doi.org/10.1038/s42003-025-08397-x
