Cited by 44

The DOI matches its Crossref record; 10 of the 10 references it cites were found in a registry or an index.

DDHD2 provides a flux of saturated fatty acids for neuronal energy and function

Saber, Saber H., Yak, Nyakuoy, Yong, Xuan Ling Hilary, Bong, Yih Tyng, Leeson, Hannah, Dai, Chuan-Yang, Binder, Tobias, Lu, Siyuan, Purushothaman, Reshinthine, Lenaerts, An-Sofie, Almeida-Souza, Leonardo, Koludarova, Lidiia, Er, Safak, Hlushchuk, Irena, Gaudin, Arnaud, Singh, Sachin, Nyman, Tuula A., Harmer, Jeffrey R., Zuryn, Steven, Wolvetang, Ernst, Talbo, Gert Hoy, Airavaara, Mikko, Battersby, Brendan J., van Waardenberg, Ashley J., Anggono, Victor, Balistreri, Giuseppe, Joensuu, Merja·2025·Nature Metabolism

Published version of a preprint

Abstract

Although fatty acids support mitochondrial ATP production in most tissues, neurons are believed to rely exclusively on glucose for energy. Here we show that genetic ablation of the triglyceride and phospholipid lipase Ddhd2 impairs mitochondrial respiration and ATP synthesis in cultured neurons, despite increased glycolysis. This defect arises from reduced levels of long-chain saturated free fatty acids, particularly myristic, palmitic and stearic acids, normally released in an activity-dependent manner by Ddhd2. Inhibition of mitochondrial fatty acid import in wild-type neurons similarly reduced mitochondrial respiration and ATP production. Saturated fatty acyl-coenzyme A treatment restored mitochondrial energy production in Ddhd2 knockout neurons. When provided in combination, these activated fatty acyl-CoA supplements also rescued defects in membrane trafficking, synaptic function and protein homeostasis. These findings uncover that neurons perform β-oxidation of endogenous long-chain free fatty acids to meet ATP demands and reveal a potential therapeutic strategy for hereditary spastic paraplegia 54 caused by DDHD2 mutations.

Overview

The claims and statistics of this paper haven’t been checked yet.

Run the check — free, no account needed. It reads the open-access text and checks the sources it cites.

A few free checks a day · papers already verified open instantly · results are public

Integrity signals

Registry

Crossref · 10.1038/s42255-025-01367-x

Cites

10 of 10 references verified0 citation errors · 0 not checkable

Statistics

Figures

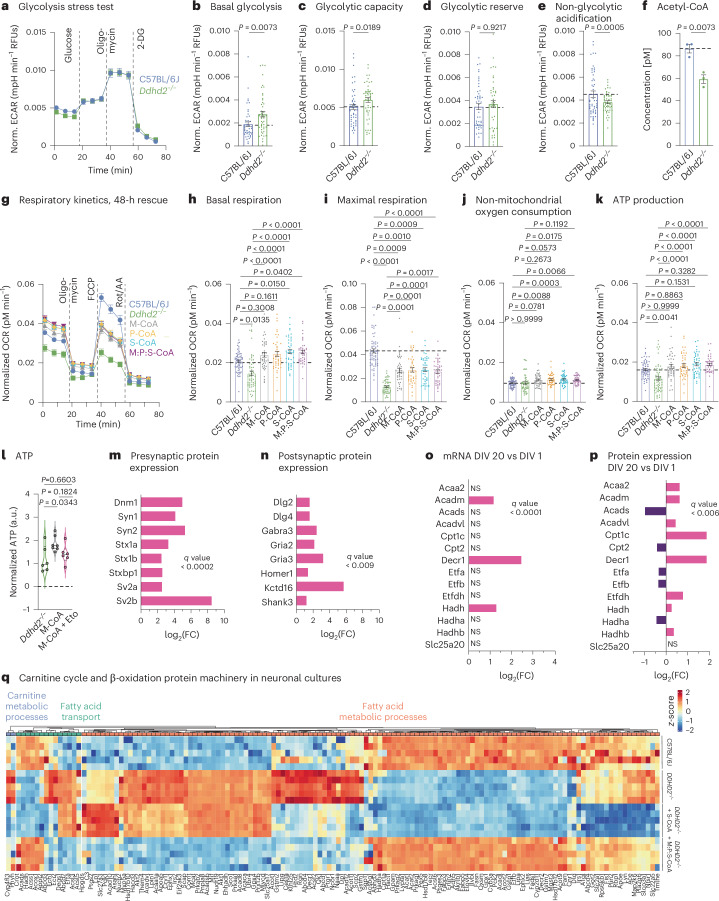
Fig. 1 β-oxidation pathway for mitochondrial energy production in neurons. a, Seahorse XF measurement of ECAR kinetics in embryonic day (E) 16 C57BL/6J and Ddhd2−/− neuronal cultures at DIV 21–22. Injection of glucose, oligomycin and 2-DG is indicated. Quantification of ECAR. b–e, Basal glycolysis (b), glycolytic capacity (c), glycolytic reserve (d) and non-glycolytic (e) acidification in C57BL/6J and Ddhd2−/− neurons. f, Fluorometric acetyl-CoA quantification in adult C57BL/6J and Ddhd2−/− brain lysates. g, Seahorse XF OCR. h–k, Quantification of basal respiration (h), maximal respiration (i), non-mitochondrial oxygen consumption (j) and ATP production (k) in DIV 21–22 hippocampal neuron cultures of C57BL/6J, and Ddhd2−/− ± 1 µM M-CoA, P-CoA, S-CoA, or 1 µM M:P:S-CoA for 48 h. Injection of oligomycin, FCCP and Rot/AA are indicated. l, Luminescence detection of intracellular ATP (a.u., arbitrary units) in cultured hippocampal E16 Ddhd2−/− neurons ±1 µM M-CoA for 48 h and ± etomoxir analysed at DIV 21–22 normalized to the average of Ddhd2−/− in each experiment. m,n, LFQ LC–MS/MS protein expression analysis of presynaptic (m) and postsynaptic (n) proteins from E16 cultured NMRI mouse cortical neuron–glia cultures at DIV 20 versus DIV 1. o, DESeq2 comparison of gene expression changes for mRNAs encoding enzymes of the mitochondrial carnitine cycle and β-oxidation at DIV 20 versus DIV 1 from cultured E16 NMRI mouse cortical neurons. p, LFQ LC–MS/MS expression analysis for mitochondrial carnitine cycle and β-oxidation proteins at DIV 20 versus DIV 1 from cultured E16 NMRI mouse cortical neurons. q, LFQ LC–MS/MS protein abundance analysis of fatty acid metabolic processes (GO:0006631), fatty acid transport (GO:0015908) and carnitine metabolic processes (GO:0009437) in cortical neuron cultures of E16 C57BL/6J, Ddhd2−/− ± 1 µM S-CoA or 1 µM M:P:S-CoA for 48 h and analysed at DIV 21–22. The expression heat map shows column-wise z-score-normalized protein abundances in each condition with each column representing a unique protein and each row a biological replicate. Samples and proteins were clustered using Euclidean distance and complete linkage. The colour gradients in heat maps reflect z-scores from low (blue) to high (red) abundance. Dot plots and kinetic curves are presented as the mean ± s.e.m.; violin plot is median ± quartiles. Dots present technical replicates. N = 3 (a–i) and N = 5 (m–q) biologically independent experiments in each condition. The exact P values stated in the graphs were determined from biological replicates using a two-tailed unpaired t-test (b, d, e, f and g), two-tailed Mann–Whitney test (c), ordinary one-way analysis of variance (ANOVA) Kruskal–Wallis multiple-comparison test (h, i and k), ordinary one-way ANOVA Sidak’s multiple-comparisons test (j) and ordinary one-way ANOVA Tukey’s multiple-comparisons test (l). FC, fold change; NS, not significant. RFU, relative fluorescence unit.
Fig. 1 β-oxidation pathway for mitochondrial energy production in neurons. a, Seahorse XF measurement of ECAR kinetics in embryonic day (E) 16 C57BL/6J and Ddhd2−/− neuronal cultures at DIV 21–22. Injection of glucose, oligomycin and 2-DG is indicated. Quantification of ECAR. b–e, Basal glycolysis (b), glycolytic capacity (c), glycolytic reserve (d) and non-glycolytic (e) acidification in C57BL/6J and Ddhd2−/− neurons. f, Fluorometric acetyl-CoA quantification in adult C57BL/6J and Ddhd2−/− brain lysates. g, Seahorse XF OCR. h–k, Quantification of basal respiration (h), maximal respiration (i), non-mitochondrial oxygen consumption (j) and ATP production (k) in DIV 21–22 hippocampal neuron cultures of C57BL/6J, and Ddhd2−/− ± 1 µM M-CoA, P-CoA, S-CoA, or 1 µM M:P:S-CoA for 48 h. Injection of oligomycin, FCCP and Rot/AA are indicated. l, Luminescence detection of intracellular ATP (a.u., arbitrary units) in cultured hippocampal E16 Ddhd2−/− neurons ±1 µM M-CoA for 48 h and ± etomoxir analysed at DIV 21–22 normalized to the average of Ddhd2−/− in each experiment. m,n, LFQ LC–MS/MS protein expression analysis of presynaptic (m) and postsynaptic (n) proteins from E16 cultured NMRI mouse cortical neuron–glia cultures at DIV 20 versus DIV 1. o, DESeq2 comparison of gene expression changes for mRNAs encoding enzymes of the mitochondrial carnitine cycle and β-oxidation at DIV 20 versus DIV 1 from cultured E16 NMRI mouse cortical neurons. p, LFQ LC–MS/MS expression analysis for mitochondrial carnitine cycle and β-oxidation proteins at DIV 20 versus DIV 1 from cultured E16 NMRI mouse cortical neurons. q, LFQ LC–MS/MS protein abundance analysis of fatty acid metabolic processes (GO:0006631), fatty acid transport (GO:0015908) and carnitine metabolic processes (GO:0009437) in cortical neuron cultures of E16 C57BL/6J, Ddhd2−/− ± 1 µM S-CoA or 1 µM M:P:S-CoA for 48 h and analysed at DIV 21–22. The expression heat map shows column-wise z-score-normalized protein abundances in each condition with each column representing a unique protein and each row a biological replicate. Samples and proteins were clustered using Euclidean distance and complete linkage. The colour gradients in heat maps reflect z-scores from low (blue) to high (red) abundance. Dot plots and kinetic curves are presented as the mean ± s.e.m.; violin plot is median ± quartiles. Dots present technical replicates. N = 3 (a–i) and N = 5 (m–q) biologically independent experiments in each condition. The exact P values stated in the graphs were determined from biological replicates using a two-tailed unpaired t-test (b, d, e, f and g), two-tailed Mann–Whitney test (c), ordinary one-way analysis of variance (ANOVA) Kruskal–Wallis multiple-comparison test (h, i and k), ordinary one-way ANOVA Sidak’s multiple-comparisons test (j) and ordinary one-way ANOVA Tukey’s multiple-comparisons test (l). FC, fold change; NS, not significant. RFU, relative fluorescence unit.CC BY · PubMed Central
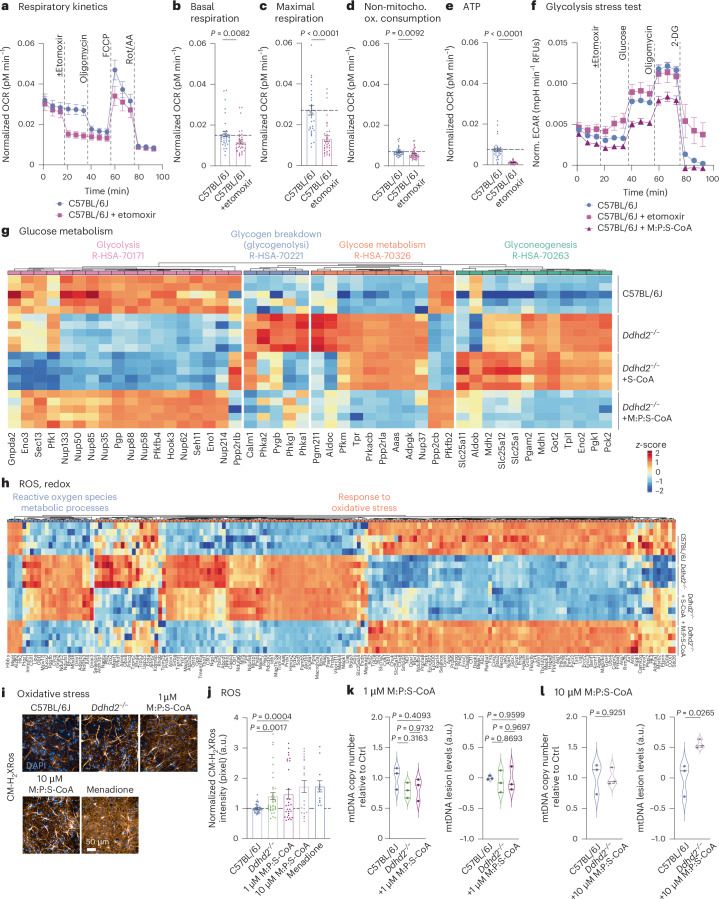
Fig. 2 Mitochondrial fatty acid import regulates neuronal energy balance without inducing ROS or mtDNA damage. a–e, Seahorse XF OCR kinetics (a) and quantification of basal respiration (b), maximal respiration (c), non-mitochondrial oxygen consumption (d) and ATP production (e) in E16 C57BL/6J hippocampal neuronal cultures ± etomoxir at DIV 21–22. Injection of etomoxir, oligomycin, FCCP and Rot/AA is indicated. f, Seahorse XF ECAR glycolysis stress test kinetics in DIV 21–22 hippocampal neuronal cultures of E16 C57BL/6J treated with etomoxir or 1 µM M:P:S-CoA for 48 h. Injection of etomoxir, glucose, oligomycin and 2-DG is indicated. g, LFQ LC–MS/MS protein abundance analysis of gluconeogenesis (R-HSA-70263), glucose metabolism (R-HSA-70326), glucose breakdown (gluconeogenesis, R-HSA-70221) and glycolysis (R-HAS-70171) proteins at DIV 21–22 cortical neuron cultures of E16 C57BL/6J, Ddhd2−/− ± 1 µM S-CoA or 1 µM M:P:S-CoA treatment for 48 h, showing column-wise z-score-normalized protein abundances in each condition. h, LFQ LC–MS/MS analysis of oxidative stress (GO:0006979) and ROS metabolic process protein abundance at DIV 21–22 in E16 cortical neuron cultures of C57BL/6J, and Ddhd2−/− ± 1 µM S-CoA or 1 µM M:P:S-CoA for 48 h, showing column-wise z-score-normalized protein abundances in each condition. i,j, Representative fluorescence images (i) and quantification (j) of CMHrXRos fluorescence intensity in E16 hippocampal neuron cultures of C57BL/6J and Ddhd2−/− ± 1 µM or 10 µM M:P:S-CoA for 48 h, or menadione. k,l, qPCR analysis of mtDNA copy number and mtDNA lesion levels in cortical neuron cultures of C57BL/6J, and Ddhd2−/− treated with 1 µM M:P:S-CoA (k) or 10 µM M:P:S-CoA (l) for 48 h. Proteomics samples and proteins were clustered using Euclidean distance and complete linkage, and the colour gradients in heat maps reflect z-scores from low (blue) to high (red) abundance, each column representing a unique protein and each row a biological replicate. Data are presented as mean values ± s.e.m.; dots present averages of biological replicates. Sample sizes are N = 3 (a–f, k and l) and N = 5 (g, h, and C57BL/6J, Ddhd2−/− and Ddhd2−/− ± 1 µM M:P:S-CoA in j), N = 2 (Ddhd2−/− ± 1 µM M:P:S-CoA and Ddhd2−/− + menadione in j) biologically independent experiments in each condition. The exact P values stated in the graphs were determined from biological replicates using a two-tailed unpaired t-test (b, d, e and l), two-tailed Mann–Whitney test (c), and ordinary one-way ANOVA Kruskal–Wallis multiple-comparisons test (j) and ordinary one-way ANOVA Tukey’s multiple-comparisons test (k).
Fig. 2 Mitochondrial fatty acid import regulates neuronal energy balance without inducing ROS or mtDNA damage. a–e, Seahorse XF OCR kinetics (a) and quantification of basal respiration (b), maximal respiration (c), non-mitochondrial oxygen consumption (d) and ATP production (e) in E16 C57BL/6J hippocampal neuronal cultures ± etomoxir at DIV 21–22. Injection of etomoxir, oligomycin, FCCP and Rot/AA is indicated. f, Seahorse XF ECAR glycolysis stress test kinetics in DIV 21–22 hippocampal neuronal cultures of E16 C57BL/6J treated with etomoxir or 1 µM M:P:S-CoA for 48 h. Injection of etomoxir, glucose, oligomycin and 2-DG is indicated. g, LFQ LC–MS/MS protein abundance analysis of gluconeogenesis (R-HSA-70263), glucose metabolism (R-HSA-70326), glucose breakdown (gluconeogenesis, R-HSA-70221) and glycolysis (R-HAS-70171) proteins at DIV 21–22 cortical neuron cultures of E16 C57BL/6J, Ddhd2−/− ± 1 µM S-CoA or 1 µM M:P:S-CoA treatment for 48 h, showing column-wise z-score-normalized protein abundances in each condition. h, LFQ LC–MS/MS analysis of oxidative stress (GO:0006979) and ROS metabolic process protein abundance at DIV 21–22 in E16 cortical neuron cultures of C57BL/6J, and Ddhd2−/− ± 1 µM S-CoA or 1 µM M:P:S-CoA for 48 h, showing column-wise z-score-normalized protein abundances in each condition. i,j, Representative fluorescence images (i) and quantification (j) of CMHrXRos fluorescence intensity in E16 hippocampal neuron cultures of C57BL/6J and Ddhd2−/− ± 1 µM or 10 µM M:P:S-CoA for 48 h, or menadione. k,l, qPCR analysis of mtDNA copy number and mtDNA lesion levels in cortical neuron cultures of C57BL/6J, and Ddhd2−/− treated with 1 µM M:P:S-CoA (k) or 10 µM M:P:S-CoA (l) for 48 h. Proteomics samples and proteins were clustered using Euclidean distance and complete linkage, and the colour gradients in heat maps reflect z-scores from low (blue) to high (red) abundance, each column representing a unique protein and each row a biological replicate. Data are presented as mean values ± s.e.m.; dots present averages of biological replicates. Sample sizes are N = 3 (a–f, k and l) and N = 5 (g, h, and C57BL/6J, Ddhd2−/− and Ddhd2−/− ± 1 µM M:P:S-CoA in j), N = 2 (Ddhd2−/− ± 1 µM M:P:S-CoA and Ddhd2−/− + menadione in j) biologically independent experiments in each condition. The exact P values stated in the graphs were determined from biological replicates using a two-tailed unpaired t-test (b, d, e and l), two-tailed Mann–Whitney test (c), and ordinary one-way ANOVA Kruskal–Wallis multiple-comparisons test (j) and ordinary one-way ANOVA Tukey’s multiple-comparisons test (k).CC BY · PubMed Central
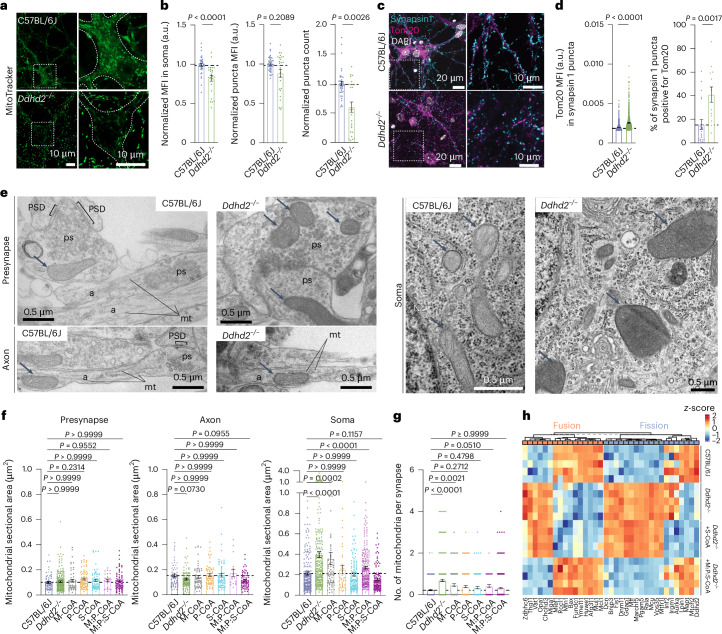
Fig. 3 Defects in mitochondrial structure, subcellular localization and ATP production in Ddhd2−/− neurons are rescued with combined fatty acyl-CoA supplements. a, Representative images of MitoTracker green staining in live E16 C57BL/6J and Ddhd2−/− hippocampal neurons at DIV 21–22. Boxed areas are magnified in the bottom showing neuronal soma outlines and a decrease in fluorescence in Ddhd2−/− neuron soma. See also Supplementary Videos 1 and 2. b, Quantifications of MitoTracker Deep Red FM staining in E16 C57BL/6J and Ddhd2−/− hippocampal neurons imaged with high-content live imaging at DIV 21–22 showing MFI (a.u.) in the neuronal soma normalized to C57BL/6J, MFI of MitoTracker-stained puncta normalized to puncta background, and MitoTracker puncta count normalized to puncta background per cell (DAPI). c, Representative immunofluorescence images of endogenous Tom20 and synapsin 1 immunostaining in E16 C57BL/6J and Ddhd2−/− hippocampal neurons at DIV 21–22. DAPI staining shown for reference. d, Quantifications show Tom20 MFI (a.u.) in synapsin 1 puncta and the percentage of synapsin 1 puncta positive for Tom20. The dotted horizontal lines indicate the average of the C57BL/6J controls. e, Representative electron microscopy images of E16 C57BL/6J and Ddhd2−/− hippocampal neuron cultures at DIV 21–22 showing presynapses (ps), axons (a), soma, microtubules (mt), postsynaptic density (PSD), nuclear envelope (NE), endoplasmic reticulum (E), Golgi complex (G) and mitochondria (arrows). f,g, Quantification of mitochondrial sectional area (µm2) from electron microscopy images (f) and the number of mitochondrial profiles per presynapse (g) in indicated conditions. h, LFQ LC–MS/MS analysis of mitochondrial fusion (GO:0008053) and fission (GO:0000266) protein abundance at DIV 21–22 in cortical neuron cultures of E16 C57BL/6J, and Ddhd2−/− ± 1 µM S-CoA or 1 µM M:P:S-CoA for 48 h, showing column-wise z-score-normalized abundances of pathways. Proteomics samples and proteins were clustered using Euclidean distance and complete linkage, and the colour gradients in heat maps reflect z-scores from low (blue) to high (red) abundance, each column representing a unique protein and each row a biological replicate. Data are presented as mean values ± s.e.m.; dots indicate technical replicates (b) and individual quantifications of synapses from technical replicates (d, f and g). The exact P values stated in the graphs were determined from biological replicates using a two-tailed Mann–Whitney test (1st graph in b and c) and a two-tailed unpaired t-test (2nd and 3rd graphs in b and 2nd graph in c) and one-way ANOVA Kruskal–Wallis multiple-comparison test (f and g). Sample sizes were N = 3 (b, d, f and g) and N = 5 (h) biologically independent experiments in each condition.
Fig. 3 Defects in mitochondrial structure, subcellular localization and ATP production in Ddhd2−/− neurons are rescued with combined fatty acyl-CoA supplements. a, Representative images of MitoTracker green staining in live E16 C57BL/6J and Ddhd2−/− hippocampal neurons at DIV 21–22. Boxed areas are magnified in the bottom showing neuronal soma outlines and a decrease in fluorescence in Ddhd2−/− neuron soma. See also Supplementary Videos 1 and 2. b, Quantifications of MitoTracker Deep Red FM staining in E16 C57BL/6J and Ddhd2−/− hippocampal neurons imaged with high-content live imaging at DIV 21–22 showing MFI (a.u.) in the neuronal soma normalized to C57BL/6J, MFI of MitoTracker-stained puncta normalized to puncta background, and MitoTracker puncta count normalized to puncta background per cell (DAPI). c, Representative immunofluorescence images of endogenous Tom20 and synapsin 1 immunostaining in E16 C57BL/6J and Ddhd2−/− hippocampal neurons at DIV 21–22. DAPI staining shown for reference. d, Quantifications show Tom20 MFI (a.u.) in synapsin 1 puncta and the percentage of synapsin 1 puncta positive for Tom20. The dotted horizontal lines indicate the average of the C57BL/6J controls. e, Representative electron microscopy images of E16 C57BL/6J and Ddhd2−/− hippocampal neuron cultures at DIV 21–22 showing presynapses (ps), axons (a), soma, microtubules (mt), postsynaptic density (PSD), nuclear envelope (NE), endoplasmic reticulum (E), Golgi complex (G) and mitochondria (arrows). f,g, Quantification of mitochondrial sectional area (µm2) from electron microscopy images (f) and the number of mitochondrial profiles per presynapse (g) in indicated conditions. h, LFQ LC–MS/MS analysis of mitochondrial fusion (GO:0008053) and fission (GO:0000266) protein abundance at DIV 21–22 in cortical neuron cultures of E16 C57BL/6J, and Ddhd2−/− ± 1 µM S-CoA or 1 µM M:P:S-CoA for 48 h, showing column-wise z-score-normalized abundances of pathways. Proteomics samples and proteins were clustered using Euclidean distance and complete linkage, and the colour gradients in heat maps reflect z-scores from low (blue) to high (red) abundance, each column representing a unique protein and each row a biological replicate. Data are presented as mean values ± s.e.m.; dots indicate technical replicates (b) and individual quantifications of synapses from technical replicates (d, f and g). The exact P values stated in the graphs were determined from biological replicates using a two-tailed Mann–Whitney test (1st graph in b and c) and a two-tailed unpaired t-test (2nd and 3rd graphs in b and 2nd graph in c) and one-way ANOVA Kruskal–Wallis multiple-comparison test (f and g). Sample sizes were N = 3 (b, d, f and g) and N = 5 (h) biologically independent experiments in each condition.CC BY · PubMed Central
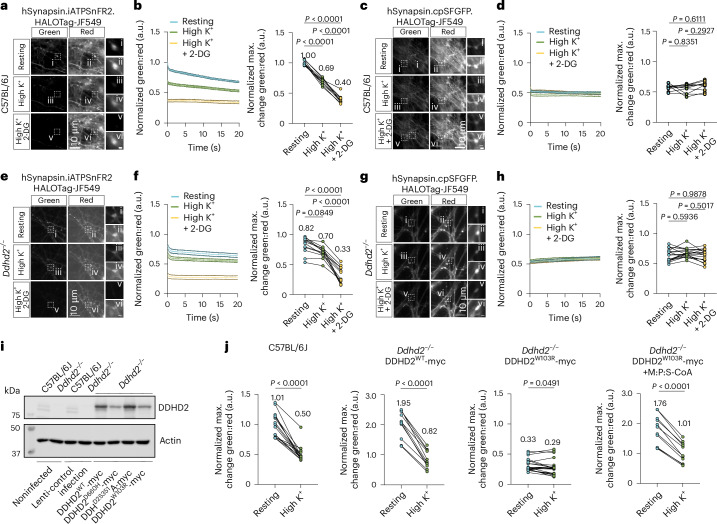
Fig. 4 Synaptic energy defects observed in HSP54-associated DDHD2 mutation are rescued with combined fatty acyl-CoA supplements. a, Representative, simultaneously acquired, fluorescence images of green (iATPSnFR2) and red (HaloTag-Janelia Fluor 549) fluorescence of ratio-metric hSynapsin.iATPSnFR2.HaloTag-JF549 ATP sensor at rest, during high K+ stimulation, and following a 15-min high K+ stimulation in the presence of 2-DG in E16 cultured hippocampal C57BL/6J neurons at DIV18-19. Boxed areas (i–vi) are shown magnified on the right. b, Kinetic graph shows the average ratio (normalized average numbers indicated on top of each condition) of iATPSnFR2 green to HaloTag-Janelia Fluor 549 red fluorescence and maximum change in green:red normalized to the C57BL/6J/ATP sensor at t1. c, Representative, simultaneously acquired, fluorescence images of green (cpSFGFP) and red (HaloTag-Janelia Fluor 549) fluorescence of ratio-metric hSynapsin.cpSFGFP.HaloTag-JF549 non-responsive control at rest, during high K+ stimulation, and following a 15-min high K+ stimulation in the presence of 2-DG in E16 cultured hippocampal C57BL/6J neurons at DIV18-19. Boxed areas (i–vi) are shown magnified on the right. d, Kinetic graph shows the average ratio (normalized average numbers indicated on top of each condition) of cpSFGFP green to HaloTag-Janelia Fluor 549 red fluorescence and maximum change in green:red normalized to the C57BL/6J/ATP sensor at t1. e, Representative, simultaneously acquired, fluorescence images of green (iATPSnFR2) and red (HaloTag-Janelia Fluor 549) fluorescence of ratio-metric hSynapsin.iATPSnFR2.HaloTag-JF549 ATP sensor at rest, during high K+ stimulation, and following a 15-min high K+ stimulation in the presence of 2-DG in E16 cultured hippocampal Ddhd2−/− neurons at DIV18-19. Boxed areas (i–vi) are shown magnified on the right. f, Kinetic graph shows the average ratio (normalized average numbers indicated on top of each condition) of iATPSnFR2 green to HaloTag-Janelia Fluor 549 red fluorescence and maximum change in green:red normalized to the C57BL/6J/ATP sensor at t1. g, Representative, simultaneously acquired, fluorescence images of green (cpSFGFP) and red (HaloTag-Janelia Fluor 549) fluorescence of ratio-metric hSynapsin.cpSFGFP.HaloTag-JF549 non-responsive control at rest, during high K+ stimulation, and following a 15-min high K+ stimulation in the presence of 2-DG in E16 cultured hippocampal Ddhd2−/− neurons at DIV18-19. Boxed areas (i–vi) are shown magnified on the right. h, Kinetic graph shows the average ratio (normalized average numbers indicated on top of each condition) of cpSFGFP green to HaloTag-Janelia Fluor 549 red fluorescence and maximum change in green:red normalized to the C57BL/6J/ATP sensor at t1. i, Western blot of DDHD2 protein levels in C57BL/6J and Ddhd2−/− ± lenti control infection, DDHD2wt-myc, DDHD2D660H-myc, DDHD2S351A-myc and DDHD2W103R-myc. j, Hippocampal C57BL/6J neurons, and lentivirally induced Ddhd2−/− hippocampal neurons expressing DDHD2wt-myc and DDHD2W103R-myc, were AAV9-infected to express hSynapsin.iATPSnFR2.HaloTag-JF549. Quantification of the hSynapsin.iATPSnFR2.HaloTag-JF549 maximum change in green:red normalized to the C57BL/6J/ATP sensor at t1 in E16 hippocampal C57BL/6J, and Ddhd2−/− neurons transiently expressing DDHD2wt-myc and DDHD2W103R-myc ± 1 µM M:P:S-CoA for 48 h at DIV14-16. Data are presented as mean values ± SEM from individual synapses. The exact P values stated in the graphs were determined from biological replicates using one-way ANOVA Kruskal–Wallis multiple comparison test (b), one-way ANOVA Tukey’s multiple comparisons test (f, d and h) and two-tailed paired t-test (j). Sample sizes were N = 3 in a and b, and Ddhd2−/− +DDHD2wt-myc and Ddhd2−/− +DDHD2W103R-myc + M:P:S-CoA in j, and N = 4 in d, f and h, and C57BL/6J, Ddhd2−/− +DDHD2W103R-myc in j, biologically independent experiments. Source data
Fig. 4 Synaptic energy defects observed in HSP54-associated DDHD2 mutation are rescued with combined fatty acyl-CoA supplements. a, Representative, simultaneously acquired, fluorescence images of green (iATPSnFR2) and red (HaloTag-Janelia Fluor 549) fluorescence of ratio-metric hSynapsin.iATPSnFR2.HaloTag-JF549 ATP sensor at rest, during high K+ stimulation, and following a 15-min high K+ stimulation in the presence of 2-DG in E16 cultured hippocampal C57BL/6J neurons at DIV18-19. Boxed areas (i–vi) are shown magnified on the right. b, Kinetic graph shows the average ratio (normalized average numbers indicated on top of each condition) of iATPSnFR2 green to HaloTag-Janelia Fluor 549 red fluorescence and maximum change in green:red normalized to the C57BL/6J/ATP sensor at t1. c, Representative, simultaneously acquired, fluorescence images of green (cpSFGFP) and red (HaloTag-Janelia Fluor 549) fluorescence of ratio-metric hSynapsin.cpSFGFP.HaloTag-JF549 non-responsive control at rest, during high K+ stimulation, and following a 15-min high K+ stimulation in the presence of 2-DG in E16 cultured hippocampal C57BL/6J neurons at DIV18-19. Boxed areas (i–vi) are shown magnified on the right. d, Kinetic graph shows the average ratio (normalized average numbers indicated on top of each condition) of cpSFGFP green to HaloTag-Janelia Fluor 549 red fluorescence and maximum change in green:red normalized to the C57BL/6J/ATP sensor at t1. e, Representative, simultaneously acquired, fluorescence images of green (iATPSnFR2) and red (HaloTag-Janelia Fluor 549) fluorescence of ratio-metric hSynapsin.iATPSnFR2.HaloTag-JF549 ATP sensor at rest, during high K+ stimulation, and following a 15-min high K+ stimulation in the presence of 2-DG in E16 cultured hippocampal Ddhd2−/− neurons at DIV18-19. Boxed areas (i–vi) are shown magnified on the right. f, Kinetic graph shows the average ratio (normalized average numbers indicated on top of each condition) of iATPSnFR2 green to HaloTag-Janelia Fluor 549 red fluorescence and maximum change in green:red normalized to the C57BL/6J/ATP sensor at t1. g, Representative, simultaneously acquired, fluorescence images of green (cpSFGFP) and red (HaloTag-Janelia Fluor 549) fluorescence of ratio-metric hSynapsin.cpSFGFP.HaloTag-JF549 non-responsive control at rest, during high K+ stimulation, and following a 15-min high K+ stimulation in the presence of 2-DG in E16 cultured hippocampal Ddhd2−/− neurons at DIV18-19. Boxed areas (i–vi) are shown magnified on the right. h, Kinetic graph shows the average ratio (normalized average numbers indicated on top of each condition) of cpSFGFP green to HaloTag-Janelia Fluor 549 red fluorescence and maximum change in green:red normalized to the C57BL/6J/ATP sensor at t1. i, Western blot of DDHD2 protein levels in C57BL/6J and Ddhd2−/− ± lenti control infection, DDHD2wt-myc, DDHD2D660H-myc, DDHD2S351A-myc and DDHD2W103R-myc. j, Hippocampal C57BL/6J neurons, and lentivirally induced Ddhd2−/− hippocampal neurons expressing DDHD2wt-myc and DDHD2W103R-myc, were AAV9-infected to express hSynapsin.iATPSnFR2.HaloTag-JF549. Quantification of the hSynapsin.iATPSnFR2.HaloTag-JF549 maximum change in green:red normalized to the C57BL/6J/ATP sensor at t1 in E16 hippocampal C57BL/6J, and Ddhd2−/− neurons transiently expressing DDHD2wt-myc and DDHD2W103R-myc ± 1 µM M:P:S-CoA for 48 h at DIV14-16. Data are presented as mean values ± SEM from individual synapses. The exact P values stated in the graphs were determined from biological replicates using one-way ANOVA Kruskal–Wallis multiple comparison test (b), one-way ANOVA Tukey’s multiple comparisons test (f, d and h) and two-tailed paired t-test (j). Sample sizes were N = 3 in a and b, and Ddhd2−/− +DDHD2wt-myc and Ddhd2−/− +DDHD2W103R-myc + M:P:S-CoA in j, and N = 4 in d, f and h, and C57BL/6J, Ddhd2−/− +DDHD2W103R-myc in j, biologically independent experiments. Source dataCC BY · PubMed Central
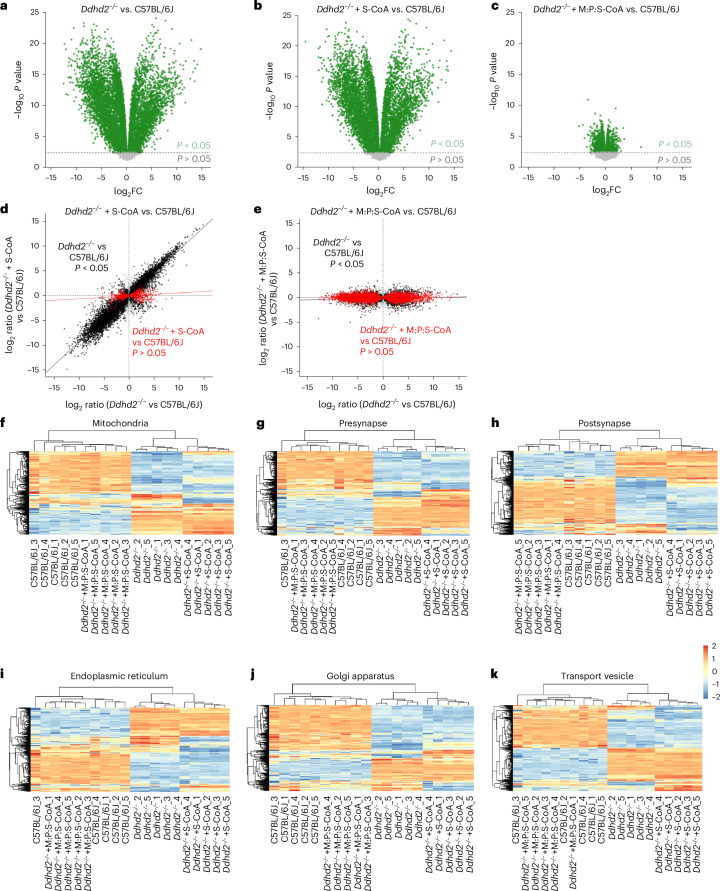
Fig. 5 Ddhd2−/− neuron proteome imbalance is restored with a combined fatty acyl-CoA treatment. a–c, Volcano plots of LFQ LC–MS/MS global proteomics comparing cultured E16 cortical C57BL/6J and Ddhd2−/− neurons across the indicated experimental conditions at DIV 21–22 showing Ddhd2−/− versus C57BL/6J (a), Ddhd2−/− + 1 µM S-CoA for 48 h versus C57BL/6J (b) and Ddhd2−/− + 1 µM M:P:S-CoA for 48 h versus C57BL/6J (c). Differentially abundant proteins are displayed as log2 fold change (x axis) and −log10-transformed P values (y axis). The significance threshold (P < 0.05) is indicated by a dashed horizontal line. Proteins with P < 0.05 are shown in green; non-significant proteins are shown in grey. Rescue dot plots display protein abundance changes in Ddhd2−/− versus C57BL/6J (x axis) and rescue with S-CoA (d) and M:P:S-CoA (e) versus C57BL/6J (y axis). Each dot represents a protein; proteins with significant and nonsignificant differences in abundance in Ddhd2−/− compared to C57BL/6J are shown in black and grey, respectively. Proteins, the abundance of which following treatments no longer significantly differed from the C57BL/6J controls, are shown in red. Red and black lines indicate linear model fits for rescued and still dysregulated protein subsets, respectively, visualizing proteome convergence towards wild-type (C57BL/6J) levels. f–k, Heat maps displaying row-wise z-score-normalized protein abundances across six functional compartments: mitochondria (GO:0005739) (f), presynapse (GO:0098793) (g), postsynapse (GO:0098794) (h), endoplasmic reticulum (GO:0005783) (i), Golgi apparatus (GO:0005794) (j) and transport vesicle (GO:0030133) (k). Gene sets were selected from enriched GO terms specific to each compartment. Each row represents a unique protein, and each column represents a biological replicate. Samples and proteins were clustered using Euclidean distance and complete linkage. Colour gradients reflect z-scores from low (blue) to high (red) abundance. N = 5 biologically independent cell culture preparations in each condition.
Fig. 5 Ddhd2−/− neuron proteome imbalance is restored with a combined fatty acyl-CoA treatment. a–c, Volcano plots of LFQ LC–MS/MS global proteomics comparing cultured E16 cortical C57BL/6J and Ddhd2−/− neurons across the indicated experimental conditions at DIV 21–22 showing Ddhd2−/− versus C57BL/6J (a), Ddhd2−/− + 1 µM S-CoA for 48 h versus C57BL/6J (b) and Ddhd2−/− + 1 µM M:P:S-CoA for 48 h versus C57BL/6J (c). Differentially abundant proteins are displayed as log2 fold change (x axis) and −log10-transformed P values (y axis). The significance threshold (P < 0.05) is indicated by a dashed horizontal line. Proteins with P < 0.05 are shown in green; non-significant proteins are shown in grey. Rescue dot plots display protein abundance changes in Ddhd2−/− versus C57BL/6J (x axis) and rescue with S-CoA (d) and M:P:S-CoA (e) versus C57BL/6J (y axis). Each dot represents a protein; proteins with significant and nonsignificant differences in abundance in Ddhd2−/− compared to C57BL/6J are shown in black and grey, respectively. Proteins, the abundance of which following treatments no longer significantly differed from the C57BL/6J controls, are shown in red. Red and black lines indicate linear model fits for rescued and still dysregulated protein subsets, respectively, visualizing proteome convergence towards wild-type (C57BL/6J) levels. f–k, Heat maps displaying row-wise z-score-normalized protein abundances across six functional compartments: mitochondria (GO:0005739) (f), presynapse (GO:0098793) (g), postsynapse (GO:0098794) (h), endoplasmic reticulum (GO:0005783) (i), Golgi apparatus (GO:0005794) (j) and transport vesicle (GO:0030133) (k). Gene sets were selected from enriched GO terms specific to each compartment. Each row represents a unique protein, and each column represents a biological replicate. Samples and proteins were clustered using Euclidean distance and complete linkage. Colour gradients reflect z-scores from low (blue) to high (red) abundance. N = 5 biologically independent cell culture preparations in each condition.CC BY · PubMed Central
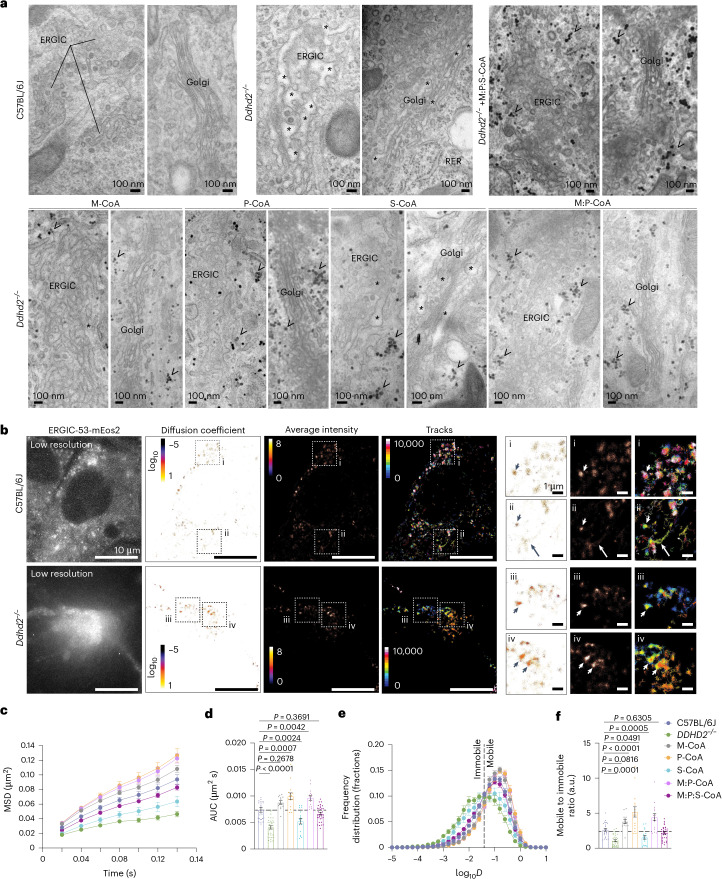
Fig. 6 Loss of Ddhd2 alters the structure and membrane trafficking in the ERGIC and Golgi complex. a, Representative electron microscopy images of cultured E16 hippocampal neurons of C57BL/6J and Ddhd2−/− ± 1 µM M-CoA, P-CoA, S-CoA, M:P-CoA or M:P:S-CoA for 48 h and imaged at DIV 21–22. ERGIC, Golgi complex, rough endoplasmic reticulum (RER), luminal dilation (asterisks) and glycogen (arrowheads) are indicated. See full images in Extended Data Fig. 7a. b, sptPALM super-resolution imaging of E16 cultured hippocampal neurons of C57BL/6J and Ddhd2−/− transiently expressing ERGIC53-mEos2 and imaged at DIV 21–22. Low-resolution image of green fluorescence of the ERGIC53-mEos2, along with super-resolved average intensity (bar: 8 to 0, high to low density), diffusion coefficient (bar: log10 1 to −5, high to low mobility) and single-molecule trajectory (bar: 0–10,000 frame acquisition) maps are show. Boxed areas (i–iv) are shown magnified on the right. Arrowheads point to confined molecules with low mobility, while arrows indicate mobile molecules. c–f, Quantification of sptPALM imaging of ERGIC53-mEos2 in E16 neuronal cultures of C57BL/6J and Ddhd22−/− ± indicated rescues, and imaged at DIV 21–22, shown as mean square displacement (MSD, µm2) (c), area under the MSD curve (µm2 s) (d), frequency distribution of log10 diffusion coefficients (D = μm2 s−1) (e) and mobile-to-immobile ratio of diffusion coefficient frequency distributions (immobile log10D ≤ − 1.45 and mobile log10D > − 1.45) (f). Data are presented as mean values ± s.e.m. Dots present technical replicates. Sample sizes were N = 3 biologically independent experiments in each condition with 23 (C57BL/6J), 32 (Ddhd2−/−), 13 (Ddhd2−/− + M-CoA), 15 (Ddhd2−/− + P-CoA), 17 (Ddhd2−/− + S-CoA), 15 (Ddhd2−/− + M:P-CoA) and 34 (Ddhd2−/− + M:P:S-CoA) technical replicates. The exact P values stated in the graphs were determined from biological replicates using ordinary one-way ANOVA Dunnett’s multiple-comparisons test (d and f). Horizontal lines in d and f indicate average C57BL/6J values.
Fig. 6 Loss of Ddhd2 alters the structure and membrane trafficking in the ERGIC and Golgi complex. a, Representative electron microscopy images of cultured E16 hippocampal neurons of C57BL/6J and Ddhd2−/− ± 1 µM M-CoA, P-CoA, S-CoA, M:P-CoA or M:P:S-CoA for 48 h and imaged at DIV 21–22. ERGIC, Golgi complex, rough endoplasmic reticulum (RER), luminal dilation (asterisks) and glycogen (arrowheads) are indicated. See full images in Extended Data Fig. 7a. b, sptPALM super-resolution imaging of E16 cultured hippocampal neurons of C57BL/6J and Ddhd2−/− transiently expressing ERGIC53-mEos2 and imaged at DIV 21–22. Low-resolution image of green fluorescence of the ERGIC53-mEos2, along with super-resolved average intensity (bar: 8 to 0, high to low density), diffusion coefficient (bar: log10 1 to −5, high to low mobility) and single-molecule trajectory (bar: 0–10,000 frame acquisition) maps are show. Boxed areas (i–iv) are shown magnified on the right. Arrowheads point to confined molecules with low mobility, while arrows indicate mobile molecules. c–f, Quantification of sptPALM imaging of ERGIC53-mEos2 in E16 neuronal cultures of C57BL/6J and Ddhd22−/− ± indicated rescues, and imaged at DIV 21–22, shown as mean square displacement (MSD, µm2) (c), area under the MSD curve (µm2 s) (d), frequency distribution of log10 diffusion coefficients (D = μm2 s−1) (e) and mobile-to-immobile ratio of diffusion coefficient frequency distributions (immobile log10D ≤ − 1.45 and mobile log10D > − 1.45) (f). Data are presented as mean values ± s.e.m. Dots present technical replicates. Sample sizes were N = 3 biologically independent experiments in each condition with 23 (C57BL/6J), 32 (Ddhd2−/−), 13 (Ddhd2−/− + M-CoA), 15 (Ddhd2−/− + P-CoA), 17 (Ddhd2−/− + S-CoA), 15 (Ddhd2−/− + M:P-CoA) and 34 (Ddhd2−/− + M:P:S-CoA) technical replicates. The exact P values stated in the graphs were determined from biological replicates using ordinary one-way ANOVA Dunnett’s multiple-comparisons test (d and f). Horizontal lines in d and f indicate average C57BL/6J values.CC BY · PubMed Central
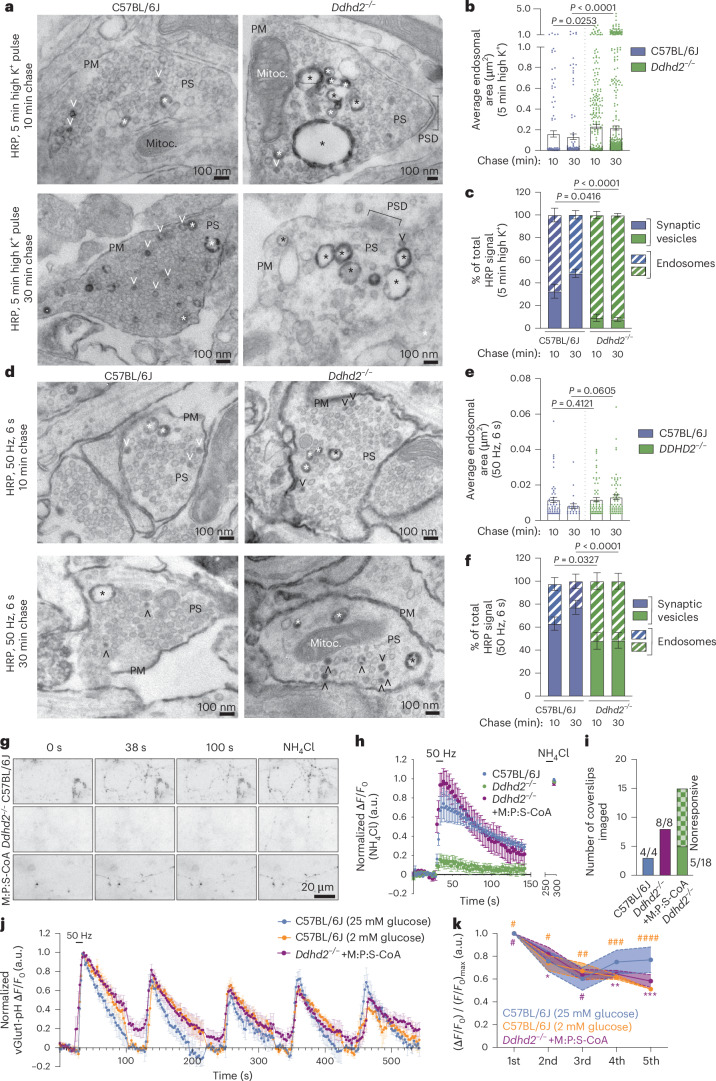
Fig. 7 Ddhd2 is required for efficient synaptic vesicle exocytosis and endocytosis. a, Representative electron microscopy images of E16 C57BL/6J and Ddhd2−/− cultured hippocampal neurons pulsed with 5 min high K+ in the presence of HRP and chased for either 10 min or 30 min, followed by cytochemical staining (that is, dark precipitate) and preparation for electron microscopy at DIV 21–22. Large endosomes (asterisks), synaptic vesicles (open arrowheads), plasma membrane (PM), mitochondria (Mitoc.) and PSD in the presynapses (PS) are indicated. b,c, Quantification of average sectional area (µm2) of large endosomes (b) and HRP-stained synaptic vesicles (SVs) and endosomes (c) shown as a percentage of the total in indicated conditions quantified from electron microscopy images. d, Representative electron microscopy images of cultured C57BL/6J and Ddhd2−/− neurons challenged with 300 action potentials (50 Hz, 6 s) in the presence of HRP, followed by either 10 min or 30 min chase, followed by cytochemical staining (that is, dark precipitate) and preparation for electron microscopy at DIV 21–22. e,f, Quantification of average sectional area (µm2) of large endosomes (e) and HRP-stained synaptic vesicles (SVs) and endosomes (f) shown as a percentage of the total in indicated conditions quantified from electron microscopy images. g, Representative widefield time-series images of E16 cultured hippocampal C57BL/6J and Ddhd2−/− (±1 µM M:P:S-CoA for 48 h) neurons transiently expressing vGlut1-pHluorin at rest (baseline), following 300 action potentials (50 Hz, 6 s) and NH4Cl dequenching. h, vGlut1-pHluorin traces (ΔF/F0) of C57BL/6J and Ddhd2−/− ± 1 µM M:P:S-CoA for 48 h, normalized to NH4Cl response peak in each condition. i, Number of indicated neuronal cultures responding to stimulation with 300 action potentials (50 Hz, 6 s). j, vGlut1-pHluorin traces (ΔF/F0) of C57BL/6J and DDHD2−/− + 1 µM M:P:S-CoA for 48 h following five repetitive stimulations at 50 Hz, at 2-min intervals, normalized to the first stimulation peak in each condition allowing the assessment of endocytosis kinetics. k, Summary data of normalized vGlut1-pHluorin peak responses over five repetitive stimulations. Data are presented as mean values ± s.e.m. Dots in b and c show the endosomal area obtained from technical replicates. Sample sizes were N = 3 (b, c, e, f, h and i), N = 5 (j, k; C57BL/6J 25 mM glucose), N = 4 (j, k, C57BL/6J 2 mM glucose) and N = 6 (j, k; Ddhd2−/− + M:P:S-CoA) biologically independent experiments in each condition. The exact P values stated in the graphs were determined from biological replicates using one-way ANOVA Kruskal–Wallis multiple-comparison test (b and e), with one-way ANOVA Sidak’s multiple-comparisons test (c and f), two-way ANOVA Sidak’s multiple-comparisons test (k; where #P > 0.9999, ##P = 0.9986, ###P = 0.8518, ####P = 0.0929, *P = 0.9976, **P = 0.9277 and ***P = 0.3088 compared to C57BL/6J neurons cultured in 25 mM glucose).
Fig. 7 Ddhd2 is required for efficient synaptic vesicle exocytosis and endocytosis. a, Representative electron microscopy images of E16 C57BL/6J and Ddhd2−/− cultured hippocampal neurons pulsed with 5 min high K+ in the presence of HRP and chased for either 10 min or 30 min, followed by cytochemical staining (that is, dark precipitate) and preparation for electron microscopy at DIV 21–22. Large endosomes (asterisks), synaptic vesicles (open arrowheads), plasma membrane (PM), mitochondria (Mitoc.) and PSD in the presynapses (PS) are indicated. b,c, Quantification of average sectional area (µm2) of large endosomes (b) and HRP-stained synaptic vesicles (SVs) and endosomes (c) shown as a percentage of the total in indicated conditions quantified from electron microscopy images. d, Representative electron microscopy images of cultured C57BL/6J and Ddhd2−/− neurons challenged with 300 action potentials (50 Hz, 6 s) in the presence of HRP, followed by either 10 min or 30 min chase, followed by cytochemical staining (that is, dark precipitate) and preparation for electron microscopy at DIV 21–22. e,f, Quantification of average sectional area (µm2) of large endosomes (e) and HRP-stained synaptic vesicles (SVs) and endosomes (f) shown as a percentage of the total in indicated conditions quantified from electron microscopy images. g, Representative widefield time-series images of E16 cultured hippocampal C57BL/6J and Ddhd2−/− (±1 µM M:P:S-CoA for 48 h) neurons transiently expressing vGlut1-pHluorin at rest (baseline), following 300 action potentials (50 Hz, 6 s) and NH4Cl dequenching. h, vGlut1-pHluorin traces (ΔF/F0) of C57BL/6J and Ddhd2−/− ± 1 µM M:P:S-CoA for 48 h, normalized to NH4Cl response peak in each condition. i, Number of indicated neuronal cultures responding to stimulation with 300 action potentials (50 Hz, 6 s). j, vGlut1-pHluorin traces (ΔF/F0) of C57BL/6J and DDHD2−/− + 1 µM M:P:S-CoA for 48 h following five repetitive stimulations at 50 Hz, at 2-min intervals, normalized to the first stimulation peak in each condition allowing the assessment of endocytosis kinetics. k, Summary data of normalized vGlut1-pHluorin peak responses over five repetitive stimulations. Data are presented as mean values ± s.e.m. Dots in b and c show the endosomal area obtained from technical replicates. Sample sizes were N = 3 (b, c, e, f, h and i), N = 5 (j, k; C57BL/6J 25 mM glucose), N = 4 (j, k, C57BL/6J 2 mM glucose) and N = 6 (j, k; Ddhd2−/− + M:P:S-CoA) biologically independent experiments in each condition. The exact P values stated in the graphs were determined from biological replicates using one-way ANOVA Kruskal–Wallis multiple-comparison test (b and e), with one-way ANOVA Sidak’s multiple-comparisons test (c and f), two-way ANOVA Sidak’s multiple-comparisons test (k; where #P > 0.9999, ##P = 0.9986, ###P = 0.8518, ####P = 0.0929, *P = 0.9976, **P = 0.9277 and ***P = 0.3088 compared to C57BL/6J neurons cultured in 25 mM glucose).CC BY · PubMed Central
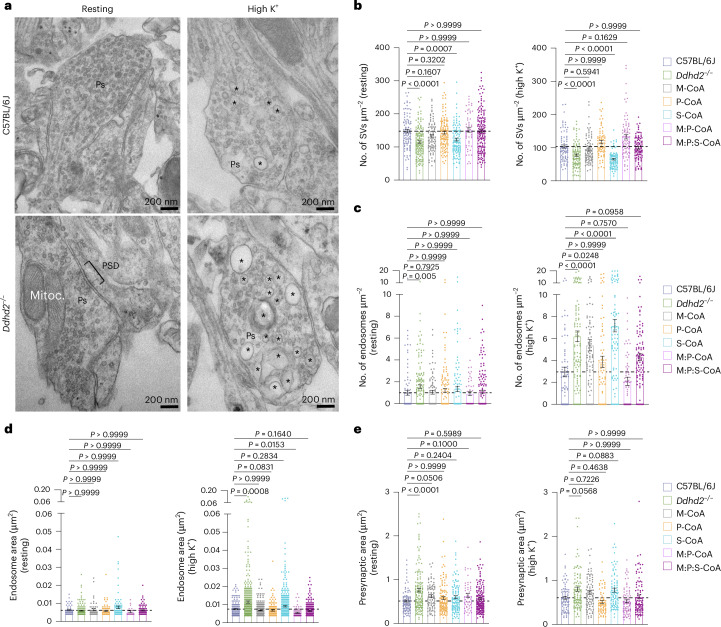
Fig. 8 Perturbed presynaptic membrane trafficking in cultured Ddhd2−/− hippocampal neurons is restored with M:P:S-CoA supplementation. a, Representative electron microscopy images. b–e, Quantification of number of synaptic vesicles (SVs) (b) and endosomes (c) per presynaptic area (µm2), endosomal area (µm2) (d) and presynaptic area (µm2) (e) in cultured E16 hippocampal C57BL/6J and Ddhd2−/− ± 1 µM M-CoA, P-CoA, S-CoA or combinations for 48 h, fixed, processed for electron microscopy, and imaged at DIV 21–22. Representative images of presynapses (Ps), endosomes (asterisks), mitochondria (Mitoc.) and PSD in the resting (non-stimulated) condition and following a 5-min high K+ stimulation are indicated. Data are presented as mean values ± s.e.m. Dots in b and c show the number of synaptic vesicles and endosomes, respectively, per synapse, and in d and e, endosomal and presynaptic area, obtained from technical replicates. Sample size is N = 3 biologically independent experiments in each condition. The exact P values stated in the graphs were determined from biological replicates using a one-way ANOVA Kruskal–Wallis multiple-comparison test (b–e). Horizontal lines in b–e indicate average C57BL/6J values.
Fig. 8 Perturbed presynaptic membrane trafficking in cultured Ddhd2−/− hippocampal neurons is restored with M:P:S-CoA supplementation. a, Representative electron microscopy images. b–e, Quantification of number of synaptic vesicles (SVs) (b) and endosomes (c) per presynaptic area (µm2), endosomal area (µm2) (d) and presynaptic area (µm2) (e) in cultured E16 hippocampal C57BL/6J and Ddhd2−/− ± 1 µM M-CoA, P-CoA, S-CoA or combinations for 48 h, fixed, processed for electron microscopy, and imaged at DIV 21–22. Representative images of presynapses (Ps), endosomes (asterisks), mitochondria (Mitoc.) and PSD in the resting (non-stimulated) condition and following a 5-min high K+ stimulation are indicated. Data are presented as mean values ± s.e.m. Dots in b and c show the number of synaptic vesicles and endosomes, respectively, per synapse, and in d and e, endosomal and presynaptic area, obtained from technical replicates. Sample size is N = 3 biologically independent experiments in each condition. The exact P values stated in the graphs were determined from biological replicates using a one-way ANOVA Kruskal–Wallis multiple-comparison test (b–e). Horizontal lines in b–e indicate average C57BL/6J values.CC BY · PubMed Central
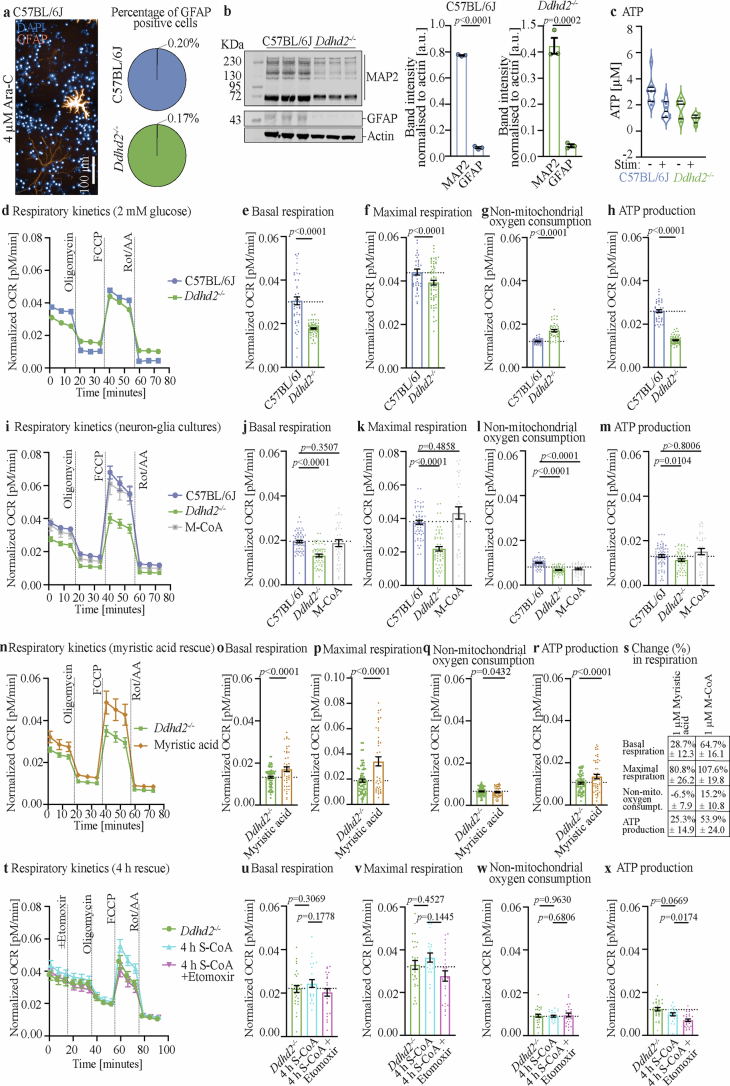
Extended Data Fig. 1 Mitochondrial respiration and glycolysis in neuronal cultures. a, Representative immunofluorescence image of endogenous GFAP staining in E16 C57BL/6J hippocampal neuron cultures treated with 4 µM Ara-C from DIV3 onwards until DIV21, after which the cultures were fixed for immunofluorescence staining. Quantification shows percentage (%) of GFAP-positive cells normalised to DAPI count in 4 µM Ara-C-treated (DIV 3-21) C57BL/6J and Ddhd2−/− cultures. b, Western blot and quantification of E16 C57BL/6J and Ddhd2−/− cultures treated with 4 µM Ara-C-treated at DIV3 to DIV21, and immunostained for MAP2, GFAP, and actin. MAP2 and GFAP band intensity are shown normalised to actin in C57BL/6J and Ddhd2−/−. c, Luminescence detection of intracellular ATP levels [µM] in cultured hippocampal E16 C57BL/6J and Ddhd2−/− neuronal cultures at DIV21–22, measured at rest (–) and after 5 min high K⁺ stimulation (+). Seahorse XF OCR measurements in E16 d-h, hippocampal neuron cultures of C57BL/6J and Ddhhd2−/− ( + 4 µM Ara-C) incubated in culture media containing 2 mM glucose for 1 h prior OCR measurements, i-m, E16 neuron-glia cultures (no Ara-C) of C57BL/6J, and Ddhd2−/− ± 1 µM M-CoA for 48 h, n-s, E16 hippocampal neuron cultures ( + 4 µM Ara-C) of C57BL/6J and Ddhd2−/− ± 1 µM myristic acid for 48 h, and the comparison of the percentage (%) change in mitochondrial respiration in Ddhd2−/− following a rescue with 1 µm myristic acid or 1µM M-CoA for 48 h (s, see Fig. 1g-k, for comparison with M-CoA rescue), and t-x, E16 hippocampal neuron cultures ( + 4 µM Ara-C) of C57BL/6J and Ddhd2−/− ± 1 µM S-CoA for 4 h ± etomoxir, both in the presence of cycloheximide. All analysed at DIV 21-22. Respiration kinetics, basal respiration, maximal respiration, non-mitochondrial oxygen consumption, and ATP production are shown for each condition. Injection of oligomycin, FCCP, Rot/AA, and etomoxir are indicated. Data are presented as mean values ± SEM, dots present technical replicates. N = 3 biologically independent experiments in each condition (b, d-x,) and N = 2 (c,). The exact p-values stated in the graphs were determined from biological replicates using two-tailed unpaired t test (b, e, h, o-r,), two-tailed Mann-Whitney test (f, g,), ordinary one-way ANOVA Dunnett’s multiple comparisons test (j,), ordinary one-way ANOVA Kruskal-Wallis multiple comparisons test (k-m,), ordinary one-way ANOVA Šídák’s multiple comparisons test (u, v, w, x,). Source data
Extended Data Fig. 1 Mitochondrial respiration and glycolysis in neuronal cultures. a, Representative immunofluorescence image of endogenous GFAP staining in E16 C57BL/6J hippocampal neuron cultures treated with 4 µM Ara-C from DIV3 onwards until DIV21, after which the cultures were fixed for immunofluorescence staining. Quantification shows percentage (%) of GFAP-positive cells normalised to DAPI count in 4 µM Ara-C-treated (DIV 3-21) C57BL/6J and Ddhd2−/− cultures. b, Western blot and quantification of E16 C57BL/6J and Ddhd2−/− cultures treated with 4 µM Ara-C-treated at DIV3 to DIV21, and immunostained for MAP2, GFAP, and actin. MAP2 and GFAP band intensity are shown normalised to actin in C57BL/6J and Ddhd2−/−. c, Luminescence detection of intracellular ATP levels [µM] in cultured hippocampal E16 C57BL/6J and Ddhd2−/− neuronal cultures at DIV21–22, measured at rest (–) and after 5 min high K⁺ stimulation (+). Seahorse XF OCR measurements in E16 d-h, hippocampal neuron cultures of C57BL/6J and Ddhhd2−/− ( + 4 µM Ara-C) incubated in culture media containing 2 mM glucose for 1 h prior OCR measurements, i-m, E16 neuron-glia cultures (no Ara-C) of C57BL/6J, and Ddhd2−/− ± 1 µM M-CoA for 48 h, n-s, E16 hippocampal neuron cultures ( + 4 µM Ara-C) of C57BL/6J and Ddhd2−/− ± 1 µM myristic acid for 48 h, and the comparison of the percentage (%) change in mitochondrial respiration in Ddhd2−/− following a rescue with 1 µm myristic acid or 1µM M-CoA for 48 h (s, see Fig. 1g-k, for comparison with M-CoA rescue), and t-x, E16 hippocampal neuron cultures ( + 4 µM Ara-C) of C57BL/6J and Ddhd2−/− ± 1 µM S-CoA for 4 h ± etomoxir, both in the presence of cycloheximide. All analysed at DIV 21-22. Respiration kinetics, basal respiration, maximal respiration, non-mitochondrial oxygen consumption, and ATP production are shown for each condition. Injection of oligomycin, FCCP, Rot/AA, and etomoxir are indicated. Data are presented as mean values ± SEM, dots present technical replicates. N = 3 biologically independent experiments in each condition (b, d-x,) and N = 2 (c,). The exact p-values stated in the graphs were determined from biological replicates using two-tailed unpaired t test (b, e, h, o-r,), two-tailed Mann-Whitney test (f, g,), ordinary one-way ANOVA Dunnett’s multiple comparisons test (j,), ordinary one-way ANOVA Kruskal-Wallis multiple comparisons test (k-m,), ordinary one-way ANOVA Šídák’s multiple comparisons test (u, v, w, x,). Source dataCC BY · PubMed Central
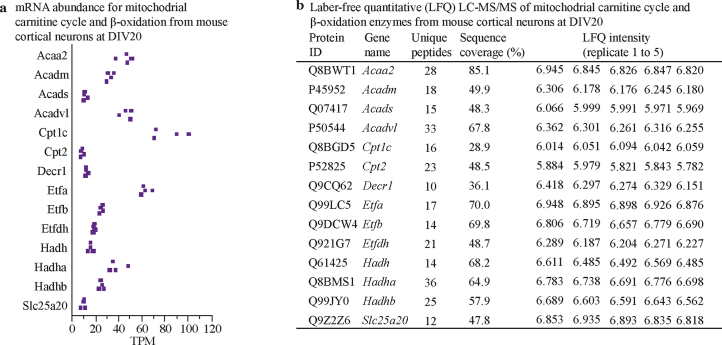
Extended Data Fig. 2 Mitochondrial carnitine cycle and β-oxidation enzymes expression in cultured cortical neurons. a, Total RNAseq expression of mRNAs encoding enzymes of the mitochondrial carnitine cycle and β-oxidation at DIV20 from cultured mouse cortical neurons. TPM, transcript per million. b, Label-free quantitative (LFQ) liquid chromatography-mass spectrometry (LC-MS/MS) expression analysis of the enzymes of the mitochondrial carnitine cycle and β-oxidation at DIV20 from cultured mouse cortical neurons. N = 5 biologically independent experiments in each condition.
Extended Data Fig. 2 Mitochondrial carnitine cycle and β-oxidation enzymes expression in cultured cortical neurons. a, Total RNAseq expression of mRNAs encoding enzymes of the mitochondrial carnitine cycle and β-oxidation at DIV20 from cultured mouse cortical neurons. TPM, transcript per million. b, Label-free quantitative (LFQ) liquid chromatography-mass spectrometry (LC-MS/MS) expression analysis of the enzymes of the mitochondrial carnitine cycle and β-oxidation at DIV20 from cultured mouse cortical neurons. N = 5 biologically independent experiments in each condition.CC BY · PubMed Central
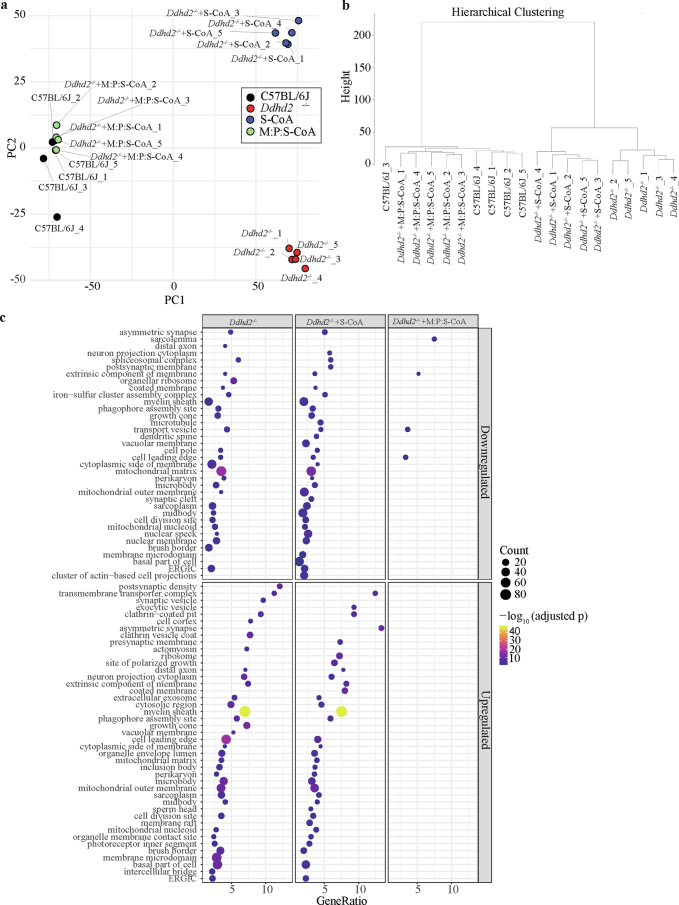
Extended Data Fig. 3 Mass spectrometry analysis of neuronal cultures of C57BL/6J, Ddhd2−/− and Ddhd2−/− treated with fatty acyl-CoA supplements. Global proteomic shifts and rescue effects in Ddhd2−/− neurons revealed by PCA, hierarchical clustering, and GO enrichment. a, Principal component analysis (PCA) of batch-corrected protein abundance data from C57BL/6J, Ddhd2−/−, and Ddhd2−/− neurons treated with either S-CoA or M:P:S-CoA. Each point represents an individual sample, with the outer square indicating replicate identity and inner fill denoting treatment group. PC1 and PC2 account for the greatest variance in the dataset and show clear separation by condition. b, Hierarchical clustering based on Euclidean distance and complete linkage, using normalized and batch-corrected protein abundance data. Samples cluster by experimental group, with M:P:S-CoA-treated Ddhd2−/− neurons displaying the closest proximity to wild-type samples. c, Gene Ontology (GO) enrichment analysis (cellular component category) of significantly up- or down-regulated proteins in Ddhd2−/− ± S-CoA or M:P:S-CoA relative to C57BL/6J. Dot size represents the number of enriched proteins; color scale reflects statistical significance (adjusted p-value); and GeneRatio corresponds to the fraction of significant proteins per GO term. N = 5 biologically independent experiments in each condition.
Extended Data Fig. 3 Mass spectrometry analysis of neuronal cultures of C57BL/6J, Ddhd2−/− and Ddhd2−/− treated with fatty acyl-CoA supplements. Global proteomic shifts and rescue effects in Ddhd2−/− neurons revealed by PCA, hierarchical clustering, and GO enrichment. a, Principal component analysis (PCA) of batch-corrected protein abundance data from C57BL/6J, Ddhd2−/−, and Ddhd2−/− neurons treated with either S-CoA or M:P:S-CoA. Each point represents an individual sample, with the outer square indicating replicate identity and inner fill denoting treatment group. PC1 and PC2 account for the greatest variance in the dataset and show clear separation by condition. b, Hierarchical clustering based on Euclidean distance and complete linkage, using normalized and batch-corrected protein abundance data. Samples cluster by experimental group, with M:P:S-CoA-treated Ddhd2−/− neurons displaying the closest proximity to wild-type samples. c, Gene Ontology (GO) enrichment analysis (cellular component category) of significantly up- or down-regulated proteins in Ddhd2−/− ± S-CoA or M:P:S-CoA relative to C57BL/6J. Dot size represents the number of enriched proteins; color scale reflects statistical significance (adjusted p-value); and GeneRatio corresponds to the fraction of significant proteins per GO term. N = 5 biologically independent experiments in each condition.CC BY · PubMed Central
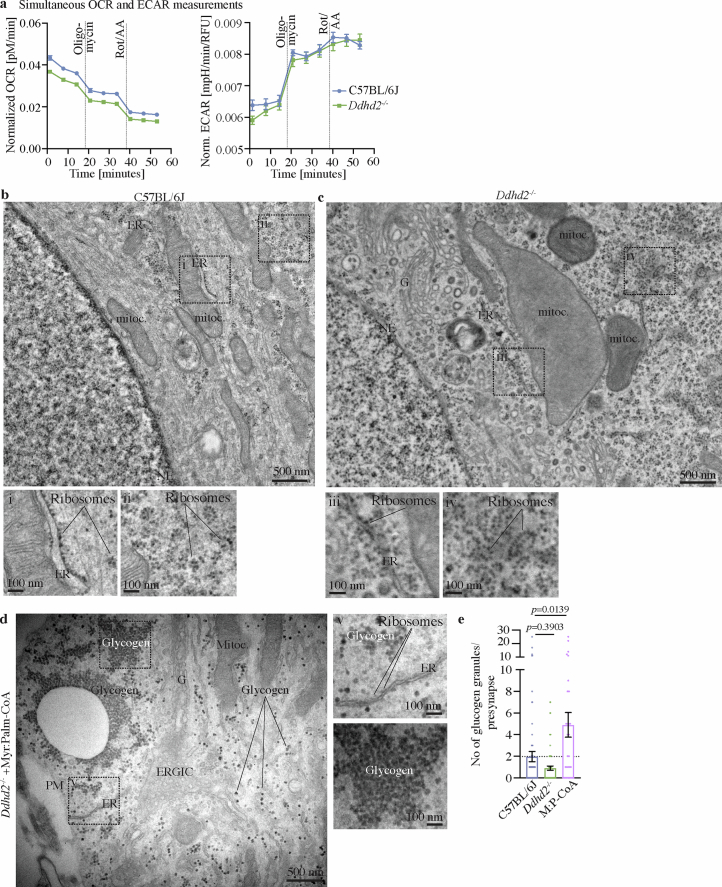
Extended Data Fig. 4 Inhibition of mitochondrial respiration increases ECAR while external supplementation of fatty acyl-CoA leads to an increase in glycogen. a, Simultaneous OCR and ECAR measurements in neuronal C57BL/6J and Ddhd2−/−cultures. Injection of oligomycin, and Rot/AA are indicated. Representative EM images of E16 neuronal cultures ( + 4 µM Ara-C) of b, C57BL/6J, c, Ddhd2−/− and d, Ddhd2−/− + 1 µM M:P-CoA for 48 h and imaged at DIV21. Boxed areas (i-iv) are shown magnified. Endoplasmic reticulum (ER), mitochondria (mitoc.), nuclear envelope (NE), Golgi complex (G), ribosomes, glycogen and plasma membrane (PM) are indicated. Note the size difference between ribosomes and glycogen for identification. e, EM quantification of average number of glycogen granules in synapses in C57BL/6J, and Ddhd2−/− ± 1 µM M:P-CoA for 48 h. Data are presented as mean values ± SEM, dots present quantifications in synapses from technical replicates. N = 3 (a, e,) biologically independent experiments in each condition. The exact p-values stated in the graphs were determined from biological replicates using one-way ANOVA Kruskal-Wallis multiple comparisons test (e,).
Extended Data Fig. 4 Inhibition of mitochondrial respiration increases ECAR while external supplementation of fatty acyl-CoA leads to an increase in glycogen. a, Simultaneous OCR and ECAR measurements in neuronal C57BL/6J and Ddhd2−/−cultures. Injection of oligomycin, and Rot/AA are indicated. Representative EM images of E16 neuronal cultures ( + 4 µM Ara-C) of b, C57BL/6J, c, Ddhd2−/− and d, Ddhd2−/− + 1 µM M:P-CoA for 48 h and imaged at DIV21. Boxed areas (i-iv) are shown magnified. Endoplasmic reticulum (ER), mitochondria (mitoc.), nuclear envelope (NE), Golgi complex (G), ribosomes, glycogen and plasma membrane (PM) are indicated. Note the size difference between ribosomes and glycogen for identification. e, EM quantification of average number of glycogen granules in synapses in C57BL/6J, and Ddhd2−/− ± 1 µM M:P-CoA for 48 h. Data are presented as mean values ± SEM, dots present quantifications in synapses from technical replicates. N = 3 (a, e,) biologically independent experiments in each condition. The exact p-values stated in the graphs were determined from biological replicates using one-way ANOVA Kruskal-Wallis multiple comparisons test (e,).CC BY · PubMed Central
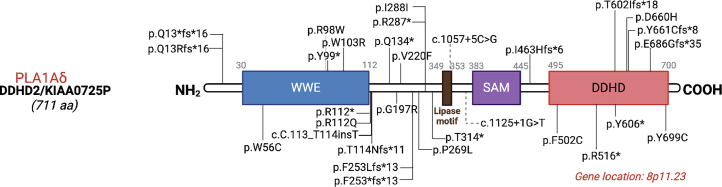
Extended data Fig. 5 Reported human mutations of DDHD2 gene. See Table 4 for further details. Created in BioRender.com.
Extended data Fig. 5 Reported human mutations of DDHD2 gene. See Table 4 for further details. Created in BioRender.com.CC BY · PubMed Central
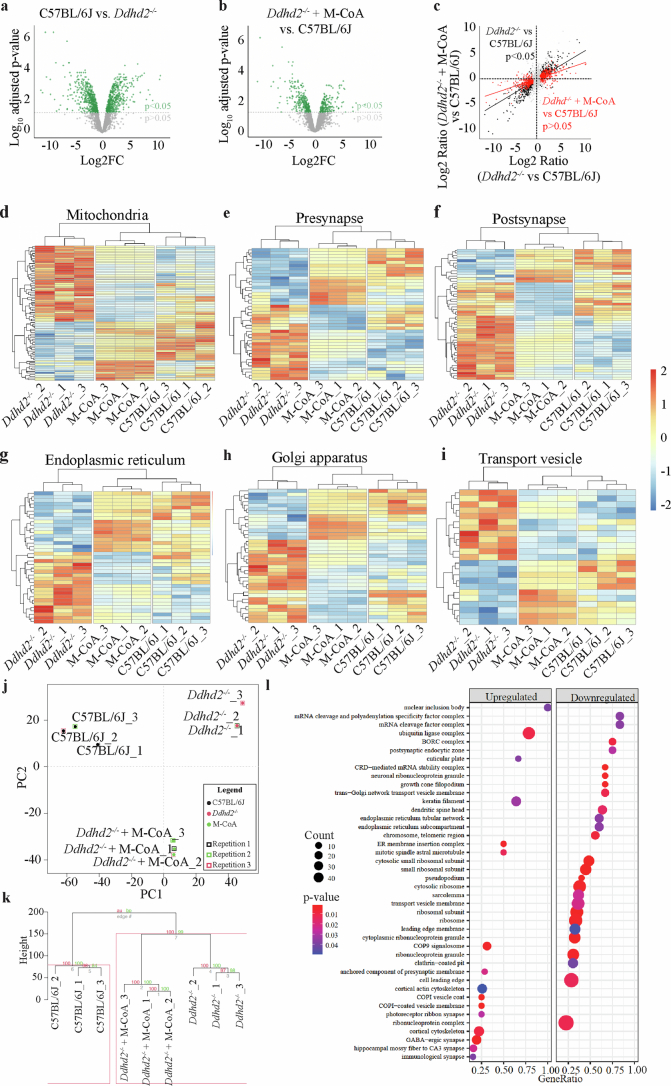
Extended Data Fig. 6 Global proteomics in C57BL/6J, and Ddhd2−/− ± M-CoA, neuron-glia cultures. Volcano plot of mass spectrometry proteomics of cultured neuron-glia cultures (no Ara-C) of E16 a, C57BL/6J vs. Ddhd2−/− and b, Ddhd2−/− treated with 1 µM M-CoA for 48 h vs. C57BL/6J. Altered protein abundance is represented as the log2 FC (or ratio) of the C57BL/6J vs. Ddhd2−/− (a, X-axis) and Ddhd2−/− + M-CoA vs. C57BL/6J (b, X-axis), and -log10 transformed adjusted p-value (Y-axes, p < 0.05 threshold indicated as a dotted grey line). c, Protein abundance of Ddhd2−/− vs. C57BL/6J (X-axis) and Ddhd2−/− + M-CoA vs. C57BL/6J (Y-axis). Proteins with unchanged levels (grey dots) and those significantly altered in abundance in Ddhd2−/− vs C57BL/6J (965 proteins, black dots) are highlighted. Notably, 605 proteins (red dots) regain normal levels after M-CoA rescue in DDHD2−/−. The black and red lines correspond to linear model fits to these sets of proteins, highlighting the Ddhd2−/− proteome shift towards C57BL/6J. d-i Protein abundance heatmaps for targeted pathways for mitochondria (GO:0005739), presynapse (GO:0098793), postsynapse’ (GO:XXX), endoplasmic reticulum (GO:0005783), Golgi apparatus (GO:0005794), and transport vesicle (GO:0030133). Each row represents an individual protein. Cells are coloured by the z-score calculated for each row. Samples (columns) and proteins (rows) are clustered Euclidean method with complete linkage. j, Principal component analysis of neuron-glia co-cultures of E16 C57BL/6J, Ddhd2−/− and Ddhd2−/− treated with 1 µM M-CoA for 48 h and analysed with mass spectrometry at DIV21-22. k, Hierarchical clustering. Samples cluster according to their experimental group (within each of the tree-like - dendrograms). Values on branches and the red box, represent probabilities of observing the clustering after 100 bootstraps. l, Gene set enrichment analysis (GSEA). Top Cellular component terms associated with increased abundance (upregulated) or decreased abundance (downregulated) upon M-CoA treatment in Ddhd2−/− neurons are shown. Count, also the size of the point, is the number of proteins associated with increased or decreased abundance. GeneRatio is the proportion of proteins captured as increased or decreased in abundance. P-value, also the colour of each point, is the significance of enrichment of proteins associated with each cellular component term. N = 3 biologically independent experiments in each condition.
Extended Data Fig. 6 Global proteomics in C57BL/6J, and Ddhd2−/− ± M-CoA, neuron-glia cultures. Volcano plot of mass spectrometry proteomics of cultured neuron-glia cultures (no Ara-C) of E16 a, C57BL/6J vs. Ddhd2−/− and b, Ddhd2−/− treated with 1 µM M-CoA for 48 h vs. C57BL/6J. Altered protein abundance is represented as the log2 FC (or ratio) of the C57BL/6J vs. Ddhd2−/− (a, X-axis) and Ddhd2−/− + M-CoA vs. C57BL/6J (b, X-axis), and -log10 transformed adjusted p-value (Y-axes, p < 0.05 threshold indicated as a dotted grey line). c, Protein abundance of Ddhd2−/− vs. C57BL/6J (X-axis) and Ddhd2−/− + M-CoA vs. C57BL/6J (Y-axis). Proteins with unchanged levels (grey dots) and those significantly altered in abundance in Ddhd2−/− vs C57BL/6J (965 proteins, black dots) are highlighted. Notably, 605 proteins (red dots) regain normal levels after M-CoA rescue in DDHD2−/−. The black and red lines correspond to linear model fits to these sets of proteins, highlighting the Ddhd2−/− proteome shift towards C57BL/6J. d-i Protein abundance heatmaps for targeted pathways for mitochondria (GO:0005739), presynapse (GO:0098793), postsynapse’ (GO:XXX), endoplasmic reticulum (GO:0005783), Golgi apparatus (GO:0005794), and transport vesicle (GO:0030133). Each row represents an individual protein. Cells are coloured by the z-score calculated for each row. Samples (columns) and proteins (rows) are clustered Euclidean method with complete linkage. j, Principal component analysis of neuron-glia co-cultures of E16 C57BL/6J, Ddhd2−/− and Ddhd2−/− treated with 1 µM M-CoA for 48 h and analysed with mass spectrometry at DIV21-22. k, Hierarchical clustering. Samples cluster according to their experimental group (within each of the tree-like - dendrograms). Values on branches and the red box, represent probabilities of observing the clustering after 100 bootstraps. l, Gene set enrichment analysis (GSEA). Top Cellular component terms associated with increased abundance (upregulated) or decreased abundance (downregulated) upon M-CoA treatment in Ddhd2−/− neurons are shown. Count, also the size of the point, is the number of proteins associated with increased or decreased abundance. GeneRatio is the proportion of proteins captured as increased or decreased in abundance. P-value, also the colour of each point, is the significance of enrichment of proteins associated with each cellular component term. N = 3 biologically independent experiments in each condition.CC BY · PubMed Central
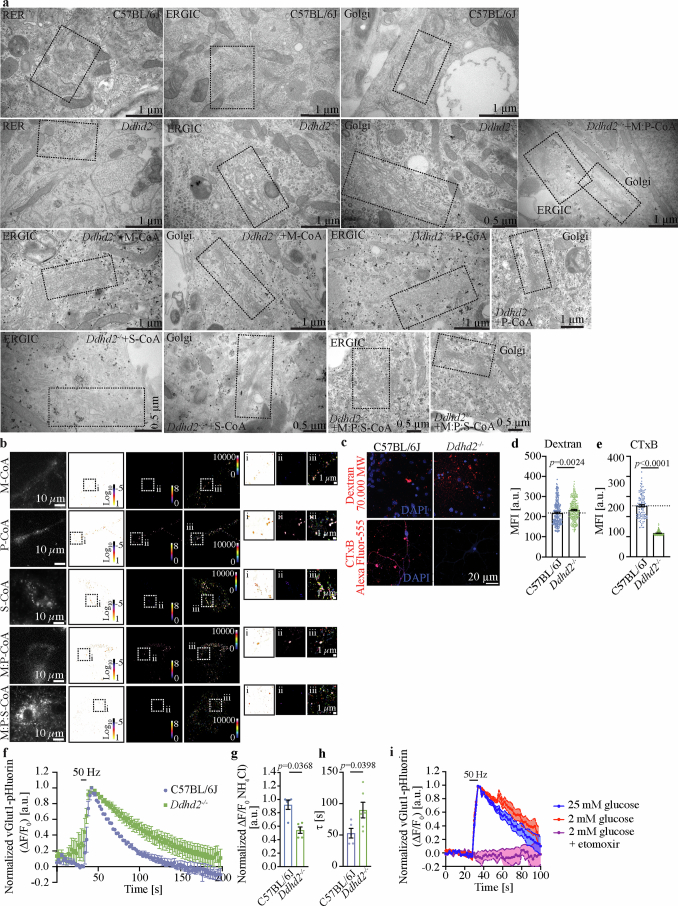
Extended Data Fig. 7 Loss of Ddhd2 leads to membrane trafficking defects in neurons. a, Uncropped images of the representative EM captures shown in Fig. 6a. b, Representative sptPALM super-resolution images of ERGIC-53-mEos2 transiently expressed in E16 Ddhd2−/− hippocampal neurons treated with 1 µM fatty acyl-CoAs for 48 h as indicated and imaged at DIV21-22. Low resolution image of green fluorescence of the ERGIC-53-mEos2, along with super-resolved diffusion coefficient (bar: Log10 1 to −5, high to low mobility), average intensity (bar: 8 to 0, high to low density), and single-molecule trajectory (bar: 0–10,000 frame acquisition) maps are show. Boxed areas (i-iii) are shown magnified on right. Arrowheads point to confined molecules with low mobility, while arrows indicate mobile molecules. c, Representative maximum projection images and quantification of mean fluorescence intensity (MFI [arbitrary units, a.u.]) of cultured E16 C57BL/6J and Ddhd2−/− hippocampal neurons ( + 4 µM Ara-C) at DIV21-22 following a 5 min high K+ pulse in presence of d, 70,000 MW Dextran Tetramethylrhodamine (red) or e, Alexa Fluor 555-conjugated Cholera Toxin Subunit B (CTxB, red), followed by 30 min chase in low K+ buffer, fixation and imaging. Nuclei stained with DAPI (blue). f, Averaged vGlut1-pHluorin traces (ΔF/F0 [a.u.]), g, peak height of vGlut1-pH responses normalized to NH4Cl [a.u.], and h, endocytosis time-constant (τ [s]) and in C57BL/6J and responsive Ddhd2−/− hippocampal neurons stimulated with a train of 300 action potentials (50 Hz, 6 s). Normalisation to the peak of each condition. i, Averaged vGlut1-pHluorin traces (ΔF/F0 [a.u.]) of C57BL/6J grown in 25 mM glucose, and 2 mM glucose ± 15 min incubation in etomoxir. Data are presented as mean values ± SEM, dots present technical replicates. N = 3 biologically independent experiments in each condition. The exact p-values stated in the graphs were determined from biological replicates using two-tailed Mann-Whitney test (d, e,) and two-tailed unpaired t test (g, h,).
Extended Data Fig. 7 Loss of Ddhd2 leads to membrane trafficking defects in neurons. a, Uncropped images of the representative EM captures shown in Fig. 6a. b, Representative sptPALM super-resolution images of ERGIC-53-mEos2 transiently expressed in E16 Ddhd2−/− hippocampal neurons treated with 1 µM fatty acyl-CoAs for 48 h as indicated and imaged at DIV21-22. Low resolution image of green fluorescence of the ERGIC-53-mEos2, along with super-resolved diffusion coefficient (bar: Log10 1 to −5, high to low mobility), average intensity (bar: 8 to 0, high to low density), and single-molecule trajectory (bar: 0–10,000 frame acquisition) maps are show. Boxed areas (i-iii) are shown magnified on right. Arrowheads point to confined molecules with low mobility, while arrows indicate mobile molecules. c, Representative maximum projection images and quantification of mean fluorescence intensity (MFI [arbitrary units, a.u.]) of cultured E16 C57BL/6J and Ddhd2−/− hippocampal neurons ( + 4 µM Ara-C) at DIV21-22 following a 5 min high K+ pulse in presence of d, 70,000 MW Dextran Tetramethylrhodamine (red) or e, Alexa Fluor 555-conjugated Cholera Toxin Subunit B (CTxB, red), followed by 30 min chase in low K+ buffer, fixation and imaging. Nuclei stained with DAPI (blue). f, Averaged vGlut1-pHluorin traces (ΔF/F0 [a.u.]), g, peak height of vGlut1-pH responses normalized to NH4Cl [a.u.], and h, endocytosis time-constant (τ [s]) and in C57BL/6J and responsive Ddhd2−/− hippocampal neurons stimulated with a train of 300 action potentials (50 Hz, 6 s). Normalisation to the peak of each condition. i, Averaged vGlut1-pHluorin traces (ΔF/F0 [a.u.]) of C57BL/6J grown in 25 mM glucose, and 2 mM glucose ± 15 min incubation in etomoxir. Data are presented as mean values ± SEM, dots present technical replicates. N = 3 biologically independent experiments in each condition. The exact p-values stated in the graphs were determined from biological replicates using two-tailed Mann-Whitney test (d, e,) and two-tailed unpaired t test (g, h,).CC BY · PubMed Central
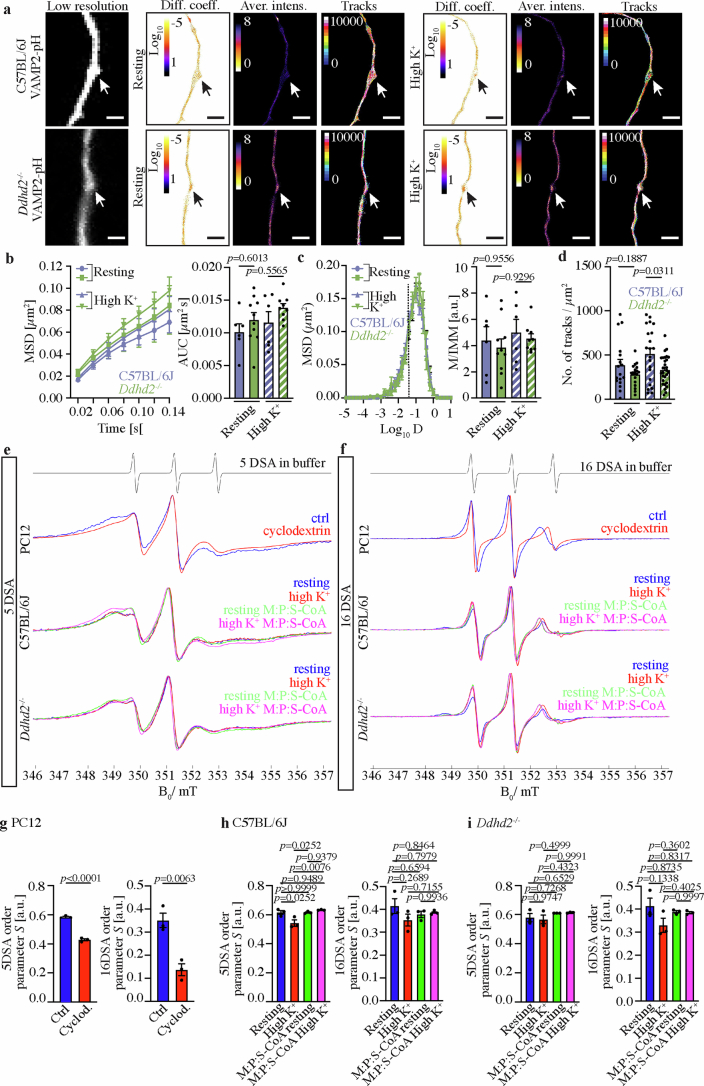
Extended Data Fig. 8 Protein trafficking and membrane fluidity. a, uPAINT super-resolution imaging VAMP2-pHluorin (VAMP2-pH) bound Atto647N-nanobodies in cultured C57BL/6J and Ddhd2−/− neurons in resting condition (low K+) and following high K+ stimulation. Low resolution images of green fluorescence of the VAMP2-pHluorin, along with super-resolved diffusion coefficient (bar: Log10 1 to −5, high to low mobility), average intensity (bar: 8 to 0, high to low density), and single-molecule trajectory (bar: 0–10,000 frame acquisition) maps are show. Arrows point to presynapses. Quantification of single-molecule mobility of VAMP2-pH/Atto647N-nanobodies in C57BL/6J and Ddhd2−/− neurons shown as b, mean square displacement (MSD [µm2]) and area under the MSD curve (µm2 s), c, frequency distribution of log10 diffusion coefficients ([D] = μm2 s−1), and mobile to immobile ratio of diffusion coefficient frequency distributions (immobile Log10D ≤ − 1.45 and mobile Log10D > − 1.45 [a.u.]) in indicated conditions. d, Quantification of single-molecule numbers of VAMP2-pH/Atto647N-nanobodies per area (µm2) in C57BL/6J and Ddhd2−/− neuron presynapses in resting and high K+ stimulated conditions. e, f, X-band (9.852) CW EPRspectra recorded from neuronal cultures of E16 C57BL/6J and Ddhd2−/− with and without 1 µM M:P:S-CoA-treatment for 48 h and analysed at DIV21-22 in resting condition (non-stimulated) and following a 5-min high K+ stimulation using a microwave power of 16 mW and a modulation amplitude of e, 0.3 mT (5DSA) and f, 0.1 mT (16DSA). PC12 neurosecretory cells treated with 1 µM cyclodextrin (that is cholesterol scavenger) or DMSO (vehicle media; Ctrl) for 30 min are shown as a positive control for a decrease in membrane order, and therefore an increase in membrane fluidity. Quantification of 0.3 mT (5DSA) and 0.1 mT (16DSA) membrane order parameter S [a.u.] in g, PC12 cells, h, C57BL/6J and i, D−/− neurons in indicated conditions. Data are presented as mean values ± SEM, dots present technical replicates in b-d, and biological replicates in g-i,. N = 3 biologically independent experiments in each condition. The exact p-values stated in the graphs were determined from biological replicates using ordinary one-way ANOVA Šídák’s multiple comparisons test (b, c, d, h, i,) and two-tailed unpaired t test (g,).
Extended Data Fig. 8 Protein trafficking and membrane fluidity. a, uPAINT super-resolution imaging VAMP2-pHluorin (VAMP2-pH) bound Atto647N-nanobodies in cultured C57BL/6J and Ddhd2−/− neurons in resting condition (low K+) and following high K+ stimulation. Low resolution images of green fluorescence of the VAMP2-pHluorin, along with super-resolved diffusion coefficient (bar: Log10 1 to −5, high to low mobility), average intensity (bar: 8 to 0, high to low density), and single-molecule trajectory (bar: 0–10,000 frame acquisition) maps are show. Arrows point to presynapses. Quantification of single-molecule mobility of VAMP2-pH/Atto647N-nanobodies in C57BL/6J and Ddhd2−/− neurons shown as b, mean square displacement (MSD [µm2]) and area under the MSD curve (µm2 s), c, frequency distribution of log10 diffusion coefficients ([D] = μm2 s−1), and mobile to immobile ratio of diffusion coefficient frequency distributions (immobile Log10D ≤ − 1.45 and mobile Log10D > − 1.45 [a.u.]) in indicated conditions. d, Quantification of single-molecule numbers of VAMP2-pH/Atto647N-nanobodies per area (µm2) in C57BL/6J and Ddhd2−/− neuron presynapses in resting and high K+ stimulated conditions. e, f, X-band (9.852) CW EPRspectra recorded from neuronal cultures of E16 C57BL/6J and Ddhd2−/− with and without 1 µM M:P:S-CoA-treatment for 48 h and analysed at DIV21-22 in resting condition (non-stimulated) and following a 5-min high K+ stimulation using a microwave power of 16 mW and a modulation amplitude of e, 0.3 mT (5DSA) and f, 0.1 mT (16DSA). PC12 neurosecretory cells treated with 1 µM cyclodextrin (that is cholesterol scavenger) or DMSO (vehicle media; Ctrl) for 30 min are shown as a positive control for a decrease in membrane order, and therefore an increase in membrane fluidity. Quantification of 0.3 mT (5DSA) and 0.1 mT (16DSA) membrane order parameter S [a.u.] in g, PC12 cells, h, C57BL/6J and i, D−/− neurons in indicated conditions. Data are presented as mean values ± SEM, dots present technical replicates in b-d, and biological replicates in g-i,. N = 3 biologically independent experiments in each condition. The exact p-values stated in the graphs were determined from biological replicates using ordinary one-way ANOVA Šídák’s multiple comparisons test (b, c, d, h, i,) and two-tailed unpaired t test (g,).CC BY · PubMed Central

Verification

Claims the paper makes

The claims and statistics of this paper haven’t been checked yet.

Run the check — free, no account needed. It reads the open-access text and checks the sources it cites.

A few free checks a day · papers already verified open instantly · results are public

Claims other papers make about this one

Each is checked against this paper’s own text: does it say what the citing paper says it does?

Self-check

Percentages, sums and reported differences re-computed from the paper’s own numbers.

The self-check needs the paper’s full text.

Citations

Cites

Research works printed but not linked: 85

  1. Inloes, J. M. et al. The hereditary spastic paraplegia-related enzyme DDHD2 is a principal brain triglyceride lipase. Proc. Natl Acad. Sci. USA 111, 14924–14929 (2014). · DOI
  2. Inloes, J. M. et al. Functional contribution of the spastic paraplegia-related triglyceride hydrolase DDHD2 to the formation and content of lipid droplets. Biochemistry 57, 827–838 (2018). · DOI
  3. Akefe, I. O. et al. The DDHD2-STXBP1 interaction mediates long-term memory via generation of saturated free fatty acids. EMBO J. 43, 533–567 (2024). · DOI
  4. Joensuu, M., Wallis, T. P., Saber, S. H. & Meunier, F. A. Phospholipases in neuronal function: a role in learning and memory? J. Neurochem. 153, 300–333 (2020). · DOI
  5. Wallis, T. P. et al. Saturated free fatty acids and association with memory formation. Nat. Commun. 12, 3443 (2021). · DOI
  6. Schuurs-Hoeijmakers, J. H. et al. Mutations in DDHD2, encoding an intracellular phospholipase A1, cause a recessive form of complex hereditary spastic paraplegia. Am. J. Hum. Genet. 91, 1073–1081 (2012). · DOI
  7. Blackstone, C. Hereditary spastic paraplegia. Handb. Clin. Neurol. 148, 633–652 (2018). · DOI
  8. Salinas, S., Proukakis, C., Crosby, A. & Warner, T. T. Hereditary spastic paraplegia: clinical features and pathogenetic mechanisms. Lancet Neurol. 7, 1127–1138 (2008). · DOI · Paper page
  9. Fink, J. K. Hereditary spastic paraplegia. Curr. Neurol. Neurosci. Rep. 6, 65–76 (2006). · DOI
  10. Murala, S., Nagarajan, E. & Bollu, P. C. Hereditary spastic paraplegia. Neurol. Sci. 42, 883–894 (2021). · DOI
  11. Gonzalez, M. et al. Mutations in phospholipase DDHD2 cause autosomal recessive hereditary spastic paraplegia (SPG54). Eur. J. Hum. Genet. 21, 1214–1218 (2013). · DOI
  12. Maruyama, T. et al. Loss of DDHD2, whose mutation causes spastic paraplegia, promotes reactive oxygen species generation and apoptosis. Cell Death Dis. 9, 797 (2018). · DOI
  13. Citterio, A. et al. Mutations in CYP2U1, DDHD2 and GBA2 genes are rare causes of complicated forms of hereditary spastic paraparesis. J. Neurol. 261, 373–381 (2014). · DOI
  14. Alrayes, N. et al. Truncating mutation in intracellular phospholipase A(1) gene (DDHD2) in hereditary spastic paraplegia with intellectual disability (SPG54). BMC Res. Notes 8, 271 (2015). · DOI
  15. Nicita, F. et al. Defining the clinical-genetic and neuroradiological features in SPG54: description of eight additional cases and nine novel DDHD2 variants. J. Neurol. 266, 2657–2664 (2019). · DOI
  16. Schonfeld, P. & Reiser, G. Why does brain metabolism not favor burning of fatty acids to provide energy? Reflections on disadvantages of the use of free fatty acids as fuel for brain. J. Cereb. Blood Flow. Metab. 33, 1493–1499 (2013). · DOI · Paper page
  17. Hiltunen, J. K. & Qin, Y.-M. β-oxidation—strategies for the metabolism of a wide variety of acyl-CoA esters. Biochim. Biophys. Acta 1484, 117–128 (2000). · DOI
  18. Adeva-Andany, M. M., Carneiro-Freire, N., Seco-Filgueira, M., Fernández-Fernández, C. & Mouriño-Bayolo, D. Mitochondrial β-oxidation of saturated fatty acids in humans. Mitochondrion 46, 73–90 (2019). · DOI
  19. Resh, M. D. Fatty acylation of proteins: the long and the short of it. Prog. Lipid Res. 63, 120–131 (2016). · DOI
  20. Yuan, Y. et al. Protein lipidation in health and disease: molecular basis, physiological function and pathological implication. Signal Transduct. Target. Ther. 9, 60 (2024). · DOI
  21. Chandel, N. S. Lipid metabolism. Cold Spring Harb. Perspect. Biol. 13, a040576 (2021). · DOI
  22. Kruszynska, Y. T. & Sherratt, H. S. Glucose kinetics during acute and chronic treatment of rats with 2[6(4-chloro-phenoxy)hexyl]oxirane-2-carboxylate, etomoxir. Biochem. Pharmacol. 36, 3917–3921 (1987). · DOI
  23. Vajrala, N., Bottomley, P. J., Stahl, D. A., Arp, D. J. & Sayavedra-Soto, L. A. Cycloheximide prevents the de novo polypeptide synthesis required to recover from acetylene inhibition in Nitrosopumilus maritimus. FEMS Microbiol. Ecol. 88, 495–502 (2014). · DOI
  24. Violante, S. et al. Carnitine palmitoyltransferase 2: new insights on the substrate specificity and implications for acylcarnitine profiling. Biochim. Biophys. Acta 1802, 728–732 (2010). · DOI
  25. Aicart-Ramos, C., Valero, R. A. & Rodriguez-Crespo, I. Protein palmitoylation and subcellular trafficking. Biochim. Biophys. Acta 1808, 2981–2994 (2011). · DOI
  26. Wang, B. et al. Protein N-myristoylation: functions and mechanisms in control of innate immunity. Cell. Mol. Immunol. 18, 878–888 (2021). · DOI
  27. Yuan, M. et al. N-myristoylation: from cell biology to translational medicine. Acta Pharmacol. Sin. 41, 1005–1015 (2020). · DOI
  28. Timms, R. T. et al. A glycine-specific N-degron pathway mediates the quality control of protein N-myristoylation. Science 365, eaaw4912 (2019). · DOI
  29. Blaskovic, S., Blanc, M. & van der Goot, F. G. What does S‐palmitoylation do to membrane proteins? FEBS J. 280, 2766–2774 (2013). · DOI
  30. Akbar, M. et al. Mitochondrial dysfunction and cell death in neurodegenerative diseases through nitroxidative stress. Brain Res. 1637, 34–55 (2016). · DOI
  31. Leeson, H. C. et al. Ataxia telangiectasia patient-derived neuronal and brain organoid models reveal mitochondrial dysfunction and oxidative stress. Neurobiol. Dis. 199, 106562 (2024). · DOI
  32. Marvin, J. S. et al. iATPSnFR2: a high-dynamic-range fluorescent sensor for monitoring intracellular ATP. Proc. Natl Acad. Sci. USA 121, e2314604121 (2024). · DOI
  33. Al-Yahyaee, S. et al. A novel locus for hereditary spastic paraplegia with thin corpus callosum and epilepsy. Neurology 66, 1230–1234 (2006). · DOI
  34. Chou, Y. T. et al. Biallelic DDHD2 mutations in patients with adult-onset complex hereditary spastic paraplegia. Ann. Clin. Transl. Neurol. 10, 1603–1612 (2023). · DOI
  35. D’Amore, A. et al. Next generation molecular diagnosis of hereditary spastic paraplegias: an Italian cross-sectional study. Front. Neurol. 9, 981 (2018). · DOI · Paper page
  36. Doi, H. et al. Late-onset spastic ataxia phenotype in a patient with a homozygous DDHD2 mutation. Sci. Rep. 4, 7132 (2014). · DOI
  37. Dong, E. L. et al. Clinical spectrum and genetic landscape for hereditary spastic paraplegias in China. Mol. Neurodegener. 13, 36 (2018). · DOI
  38. Kumar, K. R. et al. Defining the genetic basis of early onset hereditary spastic paraplegia using whole genome sequencing. Neurogenetics 17, 265–270 (2016). · DOI
  39. Magariello, A. et al. Further evidence that DDHD2 gene mutations cause autosomal recessive hereditary spastic paraplegia with thin corpus callosum. Eur. J. Neurol. 21, e25–e26 (2014). · DOI
  40. Novarino, G. et al. Exome sequencing links corticospinal motor neuron disease to common neurodegenerative disorders. Science 343, 506–511 (2014). · DOI
  41. Salinas, V. et al. The odyssey of complex neurogenetic disorders: from undetermined to positive. Am. J. Med. Genet. C. Semin. Med. Genet. 184, 876–884 (2020). · DOI
  42. Thabet, F., Tlili-Graiess, K. & Tabarki, B. Distinct neuroimaging features of DDHD2 gene-related spastic paraplegia, a mimicker of cerebral palsy. Arch. Dis. Child 105, 482 (2020). · DOI
  43. Travaglini, L. et al. The impact of next-generation sequencing on the diagnosis of pediatric-onset hereditary spastic paraplegias: new genotype-phenotype correlations for rare HSP-related genes. Neurogenetics 19, 111–121 (2018). · DOI
  44. Xu, X. et al. Case report: novel compound heterozygous missense mutations in the DDHD2 gene in a Chinese patient associated with spastic paraplegia type 54. Front. Pediatr. 10, 997274 (2022). · DOI
  45. Joensuu, M., Martínez-Mármol, R., Mollazade, M., Padmanabhan, P. & Meunier, F. A. in Single Molecule Microscopy in Neurobiology (eds Yamamoto, N. et al.) 81–114 (Springer, 2020). · DOI
  46. Small, C., Martinez-Marmol, R., Amor, R., Meunier, F. A. & Joensuu, M. Combining single molecule super-resolution imaging techniques to unravel the nanoscale organization of the presynapse. Methods Mol. Biol. 2233, 265–286 (2021). · DOI
  47. Heuser, J. & Reese, T. Evidence for recycling of synaptic vesicle membrane during transmitter release at the frog neuromuscular junction. J. Cell Biol. 57, 315–344 (1973). · DOI
  48. Haucke, V., Neher, E. & Sigrist, S. J. Protein scaffolds in the coupling of synaptic exocytosis and endocytosis. Nat. Rev. Neurosci. 12, 127–138 (2011). · DOI
  49. Wang, L. et al. α-synuclein multimers cluster synaptic vesicles and attenuate recycling. Curr. Biol. 24, 2319–2326 (2014). · DOI
  50. Yong, X. L. H., Cousin, M. A. & Anggono, V. PICK1 controls activity-dependent synaptic vesicle cargo retrieval. Cell Rep. 33, 108312 (2020). · DOI
  51. Giannone, G. et al. Dynamic superresolution imaging of endogenous proteins on living cells at ultra-high density. Biophys. J. 99, 1303–1310 (2010). · DOI
  52. Ogura, R., Sugiyama, M., Sakanashi, T. & Ninomiya, T. ESR spin-labeling method of determining membrane fluidity in biological materials tissue culture cells, cardiac mitochondria, erythrocytes and epidermal cells. Kurume Med. J. 35, 171–182 (1988). · DOI
  53. Zidovetzki, R. & Levitan, I. Use of cyclodextrins to manipulate plasma membrane cholesterol content: evidence, misconceptions and control strategies. Biochim. Biophys. Acta 1768, 1311–1324 (2007). · DOI
  54. Bengtsson, G. & Olivecrona, T. Lipoprotein lipase. Mechanism of product inhibition. Eur. J. Biochem. 106, 557–562 (1980). · DOI
  55. Tracey, T. J., Steyn, F. J., Wolvetang, E. J. & Ngo, S. T. Neuronal lipid metabolism: multiple pathways driving functional outcomes in health and disease. Front. Mol. Neurosci. 11, 10 (2018). · DOI
  56. Barber, C. N. & Raben, D. M. Lipid metabolism crosstalk in the brain: glia and neurons. Front. Cell Neurosci. 13, 212 (2019). · DOI · Paper page
  57. Carver, J. D., Benford, V. J., Han, B. & Cantor, A. B. The relationship between age and the fatty acid composition of cerebral cortex and erythrocytes in human subjects. Brain Res. Bull. 56, 79–85 (2001). · DOI
  58. Fecher, C. et al. Cell-type-specific profiling of brain mitochondria reveals functional and molecular diversity. Nat. Neurosci. 22, 1731–1742 (2019). · DOI
  59. Morant-Ferrando, B. et al. Fatty acid oxidation organizes mitochondrial supercomplexes to sustain astrocytic ROS and cognition. Nat. Metab. 5, 1290–1302 (2023). · DOI
  60. Yang, S. Y., He, X. Y. & Schulz, H. Fatty acid oxidation in rat brain is limited by the low activity of 3-ketoacyl-coenzyme A thiolase. J. Biol. Chem. 262, 13027–13032 (1987). · DOI
  61. Edmond, J., Robbins, R. A., Bergstrom, J. D., Cole, R. A. & de Vellis, J. Capacity for substrate utilization in oxidative metabolism by neurons, astrocytes, and oligodendrocytes from developing brain in primary culture. J. Neurosci. Res. 18, 551–561 (1987). · DOI
  62. Panov, A., Orynbayeva, Z., Vavilin, V. & Lyakhovich, V. Fatty acids in energy metabolism of the central nervous system. BioMed. Res. Int. 2014, 472459 (2014). · DOI · Paper page
  63. Patterson, S. I. Posttranslational protein S-palmitoylation and the compartmentalization of signaling molecules in neurons. Biol. Res. 35, 139–150 (2002). · DOI
  64. Maurer-Stroh, S. et al. MYRbase: analysis of genome-wide glycine myristoylation enlarges the functional spectrum of eukaryotic myristoylated proteins. Genome Biol. 5, R21 (2004). · DOI
  65. Shen, X. et al. Stearic acid metabolism in human health and disease. Clin. Nutr. 44, 222–238 (2025). · DOI
  66. Joensuu, M. et al. Visualizing endocytic recycling and trafficking in live neurons by subdiffractional tracking of internalized molecules. Nat. Protoc. 12, 2590–2622 (2017). · DOI
  67. Changou, C. A., Ajoy, R. & Chou, S. Y. Live images of GLUT4 protein trafficking in mouse primary hypothalamic neurons using deconvolution microscopy. J. Vis. Exp. https://doi.org/10.3791/56409 (2017). · DOI
  68. Nakajima, K. et al. A novel phospholipase A1 with sequence homology to a mammalian Sec23p-interacting protein, p125. J. Biol. Chem. 277, 11329–11335 (2002). · DOI
  69. Itakura, E. & Mizushima, N. Characterization of autophagosome formation site by a hierarchical analysis of mammalian Atg proteins. Autophagy 6, 764–776 (2010). · DOI · Paper page
  70. Dull, T. et al. A third-generation lentivirus vector with a conditional packaging system. J. Virol. 72, 8463–8471 (1998). · DOI · Paper page
  71. Malik, A. N., Czajka, A. & Cunningham, P. Accurate quantification of mouse mitochondrial DNA without co-amplification of nuclear mitochondrial insertion sequences. Mitochondrion 29, 59–64 (2016). · DOI
  72. Dai, W. et al. The ATF2/miR-3913-5p/CREB5 axis is involved in the cell proliferation and metastasis of colorectal cancer. Commun. Biol. 6, 1026 (2023). · DOI
  73. Gureev, A. P., Shaforostova, E. A., Starkov, A. A. & Popov, V. N. Simplified qPCR method for detecting excessive mtDNA damage induced by exogenous factors. Toxicology 382, 67–74 (2017). · DOI
  74. Marinangeli, C., Kluza, J., Marchetti, P., Buee, L. & Vingtdeux, V. Study of AMPK-regulated metabolic fluxes in neurons using the Seahorse XFe analyzer. Methods Mol. Biol. 1732, 289–305 (2018). · DOI
  75. Batth, T. S. et al. Protein aggregation capture on microparticles enables multipurpose proteomics sample preparation. Mol. Cell Proteomics 18, 1027–1035 (2019). · DOI
  76. Engholm-Keller, K. et al. The temporal profile of activity-dependent presynaptic phospho-signalling reveals long-lasting patterns of poststimulus regulation. PLoS Biol. 17, e3000170 (2019). · DOI
  77. Bolstad, B. M., Irizarry, R. A., Åstrand, M. & Speed, T. P. A comparison of normalization methods for high density oligonucleotide array data based on variance and bias. Bioinformatics 19, 185–193 (2003). · DOI
  78. Troyanskaya, O. et al. Missing value estimation methods for DNA microarrays. Bioinformatics 17, 520–525 (2001). · DOI · Paper page
  79. Ritchie, M. E. et al. limma powers differential expression analyses for RNA-sequencing and microarray studies. Nucleic Acids Res. 43, e47 (2015). · DOI · Paper page
  80. Manley, S., Gillette, J. M. & Lippincott-Schwartz, J. Single-particle tracking photoactivated localization microscopy for mapping single-molecule dynamics. Methods Enzymol. 475, 109–120 (2010). · DOI
  81. Joensuu, M. et al. Subdiffractional tracking of internalized molecules reveals heterogeneous motion states of synaptic vesicles. J. Cell Biol. 215, 277–292 (2016). · DOI
  82. Kechkar, A., Nair, D., Heilemann, M., Choquet, D. & Sibarita, J. B. Real-time analysis and visualization for single-molecule based super-resolution microscopy. PLoS ONE 8, e62918 (2013). · DOI
  83. Nair, D. et al. Super-resolution imaging reveals that AMPA receptors inside synapses are dynamically organized in nanodomains regulated by PSD95. J. Neurosci. 33, 13204–13224 (2013). · DOI · Paper page
  84. Butler, C. et al. Multi-dimensional spectral single molecule localization microscopy. Front. Bioinform. 2, 813494 (2022). · DOI
  85. Constals, A. et al. Glutamate-induced AMPA receptor desensitization increases their mobility and modulates short-term plasticity through unbinding from Stargazin. Neuron 85, 787–803 (2015). · DOI

Cited by

Sorted by citations

See all 44

Metadata

Authors
Saber, S. H., Yak, N., Yong, X. L. H., Bong, Y. T., Leeson, H., Dai, C.-Y., Binder, T., Lu, S., Purushothaman, R., Lenaerts, A.-S., Almeida-Souza, L., Koludarova, L., Er, S., Hlushchuk, I., Gaudin, A., Singh, S., Nyman, T. A., Harmer, J. R., Zuryn, S., Wolvetang, E., Talbo, G. H., Airavaara, M., Battersby, B. J., van Waardenberg, A. J., Anggono, V., Balistreri, G., & Joensuu, M.
Venue
Nature Metabolism
Published
2025-09-30
Volume
7
Issue
10
Pages
2117-2141
ISSN
2522-5812
Cited by
44
References
10
Language
en
Funders
  • Norges Forskningsråd (295910)
  • Department of Education and Training | Australian Research Council (FT220100485)
  • Sigrid Juséliuksen Säätiö
  • Academy of Finland (335527)
  • Sigrid Juselius Foundation, National Ataxia Foundation, Lindsey Flynt, Hereditary Neuropathy Foundation, Research Council of Finland.
  • EC | Horizon 2020 Framework Programme (101057553)

About these checks

Registry, retraction, Cites and statistics results are computed, not judged, with one exception: a printed reference that no index lists is read once by a model before it counts as a citation error. Claims are extracted by a model and kept only when their quote appears verbatim in the text; each cited source is then checked, with a model’s help, for whether it says what the claim relies on. Those verdicts can be wrong — read the claim’s quote and the cited source before relying on one.

Statistics and arithmetic are recomputed, not judged.

Confidence bands are shown only for fields calibrated on our annotated test set. None is calibrated yet, so no band is shown.

What counts as a claim ›How we measure confidence ›How we check this ›

Are you an author, or do you see a problem with this page? Request a review