Student or educator? Sign up with your school email and get 6 months of Pro free.
CoChat

The DOI matches its Crossref record; 220 of the 220 references it cites were found in a registry or an index.

A transcriptome-based human universal senescence index (hUSI) robustly predicts cellular senescence under various conditions

Open access
Wang, Jing, Zhou, Xiaolan, Yu, Peng, Yao, Jun, Guo, Pengfei, Xu, Qiushi, Zhao, Yuqi, Wang, Guanlong, Li, Qianru, Zhu, Xiaofeng, Wei, Gang, Wang, Weixu, Ni, Ting · 2025 · Nature Aging

Published version of a preprint

Abstract

Despite the manifestation and contribution of cellular senescence to aging and various diseases, accurate identification of heterogeneous senescent cells remains challenging. Current senescence evaluation methods rely mainly on limited markers or homogeneous samples, which might fail to capture universal senescence features, limiting their generalizability. Here we developed the human universal senescence index (hUSI), an accurate and robust senescence evaluation method for diverse cells and samples. Based on features learned from the most comprehensive cellular senescence-associated transcriptome data so far, hUSI demonstrated its convincing connections with senescence phenotypes and superior robustness in predicting senescence state. Using hUSI, we discovered potential senescence regulators and mapped senescent cell accumulation across cell types in coronavirus disease 2019 (COVID-19). The method also facilitates decoding heterogeneous senescence states in melanoma tumors, identifying prognosis-associated signaling pathways. Overall, hUSI demonstrates its utility in characterizing cellular senescence across biological contexts, with broad applications in aging research and clinical practice.

Overview

The claims and statistics of this paper haven’t been checked yet.

Free: it reads the open-access text and checks the first 5 claims that cite a source we can check. Create a free account to check every claim.

A few free checks a day · papers already verified open instantly · results are public

Integrity signals

Registry

Crossref · 10.1038/s43587-025-00886-2

Cites

220 of 220 references verified0 citation errors · 0 not checkable

Statistics

Figures

Fig. 1 Overall workflow of hUSI. The workflow of hUSI encompasses four major steps: data collection, feature learning, hUSI computation and hUSI application. 1. Data collection: We collected bulk RNA-seq data (843 samples) from 73 studies. After quality control, 770 samples (385 senescent and 385 non-senescent) from 64 studies were retained across 34 distinct cell types and 13 senescence types. The distribution of cell lines and senescence types is shown in pie charts (lower left and lower right, respectively). 2. Feature learning: A uniform RNA-seq data processing pipeline was employed to create a standardized gene expression matrix. We selected senescent samples and filtered cell type signatures to generate a universal senescence transcriptome profile. Then, an OCLR model was applied to this profile and ultimately produced a weighted gene vector, referred to as the OCLR-learned senescence features. 3. hUSI computation: hUSI can be calculated for both bulk and single-cell samples by calculating the Spearman correlation coefficient between the OCLR-learned senescence features and gene expression value. 4. hUSI application: The effectiveness of hUSI was validated in distinguishing senescent samples across multiple bulk and single-cell datasets, demonstrating superior performance compared to other methods. Applying hUSI to various datasets can elucidate characteristics, interactions, clinical relationships and regulators of senescent cells as well as their accumulative changes in diseases. Figure created with BioRender.
Fig. 1 Overall workflow of hUSI. The workflow of hUSI encompasses four major steps: data collection, feature learning, hUSI computation and hUSI application. 1. Data collection: We collected bulk RNA-seq data (843 samples) from 73 studies. After quality control, 770 samples (385 senescent and 385 non-senescent) from 64 studies were retained across 34 distinct cell types and 13 senescence types. The distribution of cell lines and senescence types is shown in pie charts (lower left and lower right, respectively). 2. Feature learning: A uniform RNA-seq data processing pipeline was employed to create a standardized gene expression matrix. We selected senescent samples and filtered cell type signatures to generate a universal senescence transcriptome profile. Then, an OCLR model was applied to this profile and ultimately produced a weighted gene vector, referred to as the OCLR-learned senescence features. 3. hUSI computation: hUSI can be calculated for both bulk and single-cell samples by calculating the Spearman correlation coefficient between the OCLR-learned senescence features and gene expression value. 4. hUSI application: The effectiveness of hUSI was validated in distinguishing senescent samples across multiple bulk and single-cell datasets, demonstrating superior performance compared to other methods. Applying hUSI to various datasets can elucidate characteristics, interactions, clinical relationships and regulators of senescent cells as well as their accumulative changes in diseases. Figure created with BioRender.CC BY-NC-ND · PubMed Central
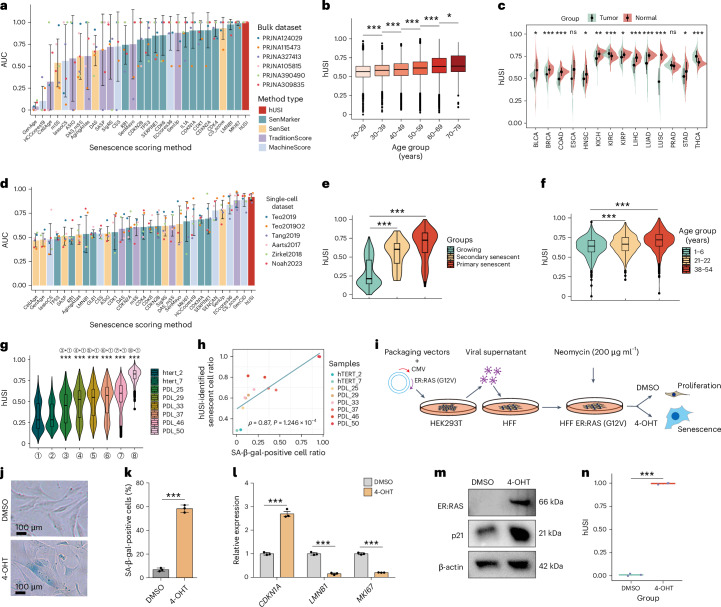
Fig. 2 hUSI enables robustly evaluating senescence for diverse samples. a, Mean AUC values across six microarray datasets, with sample sizes detailed in Supplementary Table 3, presented as mean ± s.d. b, hUSI values in GTEx samples grouped by age (n = 17,382 samples; two-tailed Wilcoxon test). c, hUSI comparison between tumor and matched normal tissues (n = 1,291 samples; two-tailed t-test). d, Similar to a, benchmarking results of all methods in six scRNA-seq datasets (the number of cells is provided in Supplementary Table 3). e, hUSI levels of IMR90 cells were compared across three groups, including growing (untreated), primary senescent (4-OHT-induced) and secondary senescent (SASP-mediated) (n = 480 cells; two-tailed Wilcoxon test). f, hUSI levels of pancreas cells from donors aged 1–6, 21–22 and 38–54 years (n = 2,544 cells; two-tailed Wilcoxon test). g, hUSI levels in cells at different immortalization stages (hTERT_2 and hTERT_7) and passage stages (PDL_25 to PDL_50) were compared to the hTERT_2 stage (n = 12,019 cells; two-tailed Wilcoxon test). h, Spearman correlation between the proportion of hUSI-identified senescent cells and SA-β-gal-positive cells. i, Workflow for generating HFF ER:RAS cells. j, SA-β-gal staining in HFF cells after oncogene activation. k, The percentage of SA-β-gal-positive cells (n = 3 biological replicates; two-tailed t-test). Data are presented as mean ± s.e.m. l, Expression levels of CDKN1A, LMNB1 and MKI67 detected by qRT–PCR upon oncogene activation (n = 3 biological replicates; two-tailed t-test). Data are presented as mean ± s.e.m. m, Western blot analysis of ER:RAS and p21 protein in OIS HFF cells, with β-actin serving as the loading control. n, Boxplot showing hUSI levels in proliferation (treated with DMSO) versus senescence (treated with 4-OHT) groups (n = 3 biological replicates; two-tailed t-test.). The box in the boxplot (b and e–g) represents the interquartile range (IQR), with its lower and upper edges indicating the 25th and 75th percentiles, respectively. The medium value (50th percentile) is shown within the box, and the whiskers extend to the minimum and maximum values within 1.5 times the IQR of the quartiles. For all statistical tests: *P < 0.05, **P < 0.01 and ***P < 1 × 10⁻³. The exact P values are reported in Source Data for Fig. 2. Source data
Fig. 2 hUSI enables robustly evaluating senescence for diverse samples. a, Mean AUC values across six microarray datasets, with sample sizes detailed in Supplementary Table 3, presented as mean ± s.d. b, hUSI values in GTEx samples grouped by age (n = 17,382 samples; two-tailed Wilcoxon test). c, hUSI comparison between tumor and matched normal tissues (n = 1,291 samples; two-tailed t-test). d, Similar to a, benchmarking results of all methods in six scRNA-seq datasets (the number of cells is provided in Supplementary Table 3). e, hUSI levels of IMR90 cells were compared across three groups, including growing (untreated), primary senescent (4-OHT-induced) and secondary senescent (SASP-mediated) (n = 480 cells; two-tailed Wilcoxon test). f, hUSI levels of pancreas cells from donors aged 1–6, 21–22 and 38–54 years (n = 2,544 cells; two-tailed Wilcoxon test). g, hUSI levels in cells at different immortalization stages (hTERT_2 and hTERT_7) and passage stages (PDL_25 to PDL_50) were compared to the hTERT_2 stage (n = 12,019 cells; two-tailed Wilcoxon test). h, Spearman correlation between the proportion of hUSI-identified senescent cells and SA-β-gal-positive cells. i, Workflow for generating HFF ER:RAS cells. j, SA-β-gal staining in HFF cells after oncogene activation. k, The percentage of SA-β-gal-positive cells (n = 3 biological replicates; two-tailed t-test). Data are presented as mean ± s.e.m. l, Expression levels of CDKN1A, LMNB1 and MKI67 detected by qRT–PCR upon oncogene activation (n = 3 biological replicates; two-tailed t-test). Data are presented as mean ± s.e.m. m, Western blot analysis of ER:RAS and p21 protein in OIS HFF cells, with β-actin serving as the loading control. n, Boxplot showing hUSI levels in proliferation (treated with DMSO) versus senescence (treated with 4-OHT) groups (n = 3 biological replicates; two-tailed t-test.). The box in the boxplot (b and e–g) represents the interquartile range (IQR), with its lower and upper edges indicating the 25th and 75th percentiles, respectively. The medium value (50th percentile) is shown within the box, and the whiskers extend to the minimum and maximum values within 1.5 times the IQR of the quartiles. For all statistical tests: *P < 0.05, **P < 0.01 and ***P < 1 × 10⁻³. The exact P values are reported in Source Data for Fig. 2. Source dataCC BY-NC-ND · PubMed Central
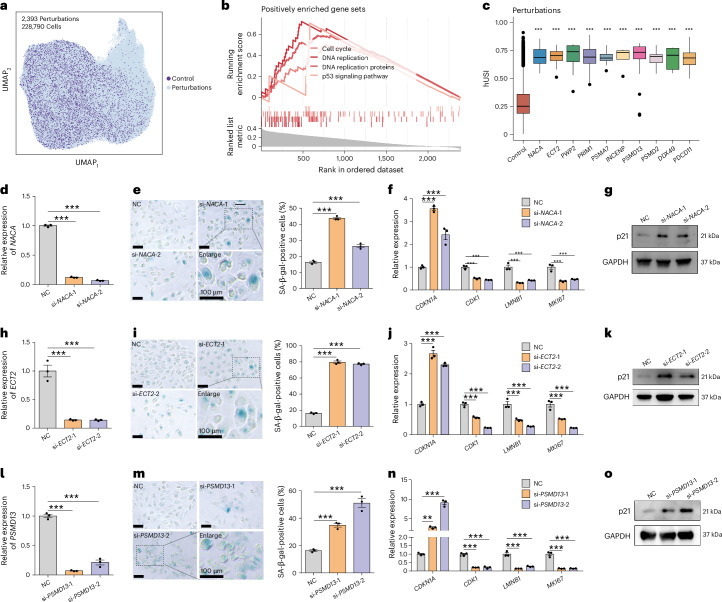
Fig. 3 hUSI revealed potential senescence regulators in a Perturb-seq dataset. a, UMAP plot showing the distribution of cells in the Perturb-seq dataset. b, GSEA results for hUSI-identified genes whose perturbations could induce cell into senescence state. Each line corresponds to a different Hallmark gene set, with line color shading indicating NES. c, Boxplot showing the hUSI levels of cells targeted by the top 10 hUSI-identified genes compared to that of the control cells (n = 11,705 cells; ***P < 1 × 10⁻³, two-tailed Wilcoxon test with Benjamini–Hochberg correction). The box represents the IQR, with its lower and upper edges indicating the 25th and 75th percentiles, respectively. The medium value (50th percentile) is shown within the box, and the whiskers extend to the minimum and maximum values within 1.5 times the IQR of the quartiles. d–g, Senescence validation of NACA knockdown in ARPE19 cells (n = 3 biological replicates; two-tailed t-test). Data are presented as mean ± s.e.m. NACA was knocked down by two siRNAs (si-NACA-1 and si-NACA-2) (d). e, Left: the senescence state is demonstrated by representative images of SA-β-gal staining. Right: the bar chart shows the percentage of SA-β-gal-positive cells (n = 3 biological replicates). Scale bars, 100 μm. The gene expression levels of CDKN1A, CDK1, LMNB1 and MKI67 evaluated by qRT–PCR (f) and the western blot of p21 protein levels before and after NACA knockdown in ARPE19 cells, with GAPDH serving as the internal control (g). h–k and l–o present the senescence validation results for ECT2 and PSMD13 (as those in d–g), respectively. Scale bars, 100 μm. For all statistical tests: **P < 0.01 and ***P < 1 × 10⁻³. The exact P values are reported in Source Data for Fig. 3. NC, negative control. Source data
Fig. 3 hUSI revealed potential senescence regulators in a Perturb-seq dataset. a, UMAP plot showing the distribution of cells in the Perturb-seq dataset. b, GSEA results for hUSI-identified genes whose perturbations could induce cell into senescence state. Each line corresponds to a different Hallmark gene set, with line color shading indicating NES. c, Boxplot showing the hUSI levels of cells targeted by the top 10 hUSI-identified genes compared to that of the control cells (n = 11,705 cells; ***P < 1 × 10⁻³, two-tailed Wilcoxon test with Benjamini–Hochberg correction). The box represents the IQR, with its lower and upper edges indicating the 25th and 75th percentiles, respectively. The medium value (50th percentile) is shown within the box, and the whiskers extend to the minimum and maximum values within 1.5 times the IQR of the quartiles. d–g, Senescence validation of NACA knockdown in ARPE19 cells (n = 3 biological replicates; two-tailed t-test). Data are presented as mean ± s.e.m. NACA was knocked down by two siRNAs (si-NACA-1 and si-NACA-2) (d). e, Left: the senescence state is demonstrated by representative images of SA-β-gal staining. Right: the bar chart shows the percentage of SA-β-gal-positive cells (n = 3 biological replicates). Scale bars, 100 μm. The gene expression levels of CDKN1A, CDK1, LMNB1 and MKI67 evaluated by qRT–PCR (f) and the western blot of p21 protein levels before and after NACA knockdown in ARPE19 cells, with GAPDH serving as the internal control (g). h–k and l–o present the senescence validation results for ECT2 and PSMD13 (as those in d–g), respectively. Scale bars, 100 μm. For all statistical tests: **P < 0.01 and ***P < 1 × 10⁻³. The exact P values are reported in Source Data for Fig. 3. NC, negative control. Source dataCC BY-NC-ND · PubMed Central
Fig. 4 hUSI enables the evaluation of senescence burden in COVID-19. a, UMAP plot showing the distribution of nine annotated cell types in the snRNA-seq dataset derived from COVID-19 lung tissues (GSE171524). b, The distribution of hUSI value for each cell in the COVID-19 dataset projected onto the UMAP. c, Violin plot showing the comparison of hUSI levels between control and COVID-19 samples across 41 fine cell types (two-tailed t-test; *P < 0.05, **P < 0.01 and ***P < 1 × 10⁻³; the exact P values and cell numbers of each cell type are reported in Source Data for Fig. 4). The box in the boxplot represents the IQR, with its lower and upper edges indicating the 25th and 75th percentiles, respectively. The medium value (50th percentile) is shown within the box, and the whiskers extend to the minimum and maximum values within 1.5 times the IQR of the quartiles. d, UMAP plot showing the distribution of hUSI-identified Senescent-like cells and Normal-like cells. e, Heatmap showing the scaled mean expression of senescence-related and cycling-related genes in Normal-like and Senescent-like groups across each fine cell type. f, KEGG enrichment results of significant (the hypergeometric test with Benjamini–Hochberg correction) highly expressed genes in Senescent-like cells across fine cell types. Only gene sets with the highest representation across cell types are shown. The x axis represents gene set names, and the y axis represents cell types. Source data
Fig. 4 hUSI enables the evaluation of senescence burden in COVID-19. a, UMAP plot showing the distribution of nine annotated cell types in the snRNA-seq dataset derived from COVID-19 lung tissues (GSE171524). b, The distribution of hUSI value for each cell in the COVID-19 dataset projected onto the UMAP. c, Violin plot showing the comparison of hUSI levels between control and COVID-19 samples across 41 fine cell types (two-tailed t-test; *P < 0.05, **P < 0.01 and ***P < 1 × 10⁻³; the exact P values and cell numbers of each cell type are reported in Source Data for Fig. 4). The box in the boxplot represents the IQR, with its lower and upper edges indicating the 25th and 75th percentiles, respectively. The medium value (50th percentile) is shown within the box, and the whiskers extend to the minimum and maximum values within 1.5 times the IQR of the quartiles. d, UMAP plot showing the distribution of hUSI-identified Senescent-like cells and Normal-like cells. e, Heatmap showing the scaled mean expression of senescence-related and cycling-related genes in Normal-like and Senescent-like groups across each fine cell type. f, KEGG enrichment results of significant (the hypergeometric test with Benjamini–Hochberg correction) highly expressed genes in Senescent-like cells across fine cell types. Only gene sets with the highest representation across cell types are shown. The x axis represents gene set names, and the y axis represents cell types. Source dataCC BY-NC-ND · PubMed Central
Fig. 5 hUSI identifies prognosis-related senescent tumor cells in melanoma. a, tSNE plot showing the distribution of seven cell types identified within the melanoma dataset (GSE72056). b, The UMAP displays the distribution of hUSI value of each cell in the melanoma dataset. c, Violin plot compares hUSI levels between untreated and treated groups in immune therapy (two-tailed Wilcoxon test). The box in the boxplot represents the IQR, with its lower and upper edges indicating the 25th and 75th percentiles, respectively. The medium value (50th percentile) is shown within the box, and the whiskers extend to the minimum and maximum values within 1.5 times the IQR of the quartiles. ***P < 1 × 10⁻³. The exact P values are reported in Source Data for Fig. 5. d, The proportions of three tumor senescence subpopulations of untreated and treated groups in immune therapy. e, Senescence trajectory of melanoma tumor cells in PHATE space. f, Increased expression levels of aging-related marker genes CDKN1A and SERPINE along the trajectory in e and in different senescence subpopulations. g, Different GO terms (biological process (BP)) characterize Cycling, Transitional and Senescent subpopulations, with replication-associated terms enriched by the Cycling subpopulation and immunity activation-related terms enriched by the Senescent subpopulation (the hypergeometric test with Benjamini–Hochberg correction). The exact FDR-corrected P values are reported in Source Data for Fig. 5. h, Heatmap of Spearman correlation coefficient between the abundance of the three subpopulations and that of 22 immune cell types. i, Survival curves of patients with melanoma with low or high proportion of Senescent subpopulation in the TCGA-SKCM cohort (log-rank test). j, Dot plot showing the interaction strength of three tumor subpopulations and six cell types in the TME. k, Dot plot of communication probabilities for signaling pathways presenting in the Senescent subpopulation while absent in the Cycling subpopulation (permutation test, n = 100 iterations). l, Chord plots showing that Macro and CAFs interact with Transitional and Senescent subpopulations by the TGFβ signaling pathway. m, Violin plot showing the expression levels of four receptors specifically expressed in the Senescent subpopulation. n, Survival curves of patients with melanoma with low or high enrichment score of TGFBR2, ACVR1, ALCAM and CCR10 in the TCGA-SKCM cohort (log-rank test). tSNE, t-distributed stochastic neighbor embedding. Source data
Fig. 5 hUSI identifies prognosis-related senescent tumor cells in melanoma. a, tSNE plot showing the distribution of seven cell types identified within the melanoma dataset (GSE72056). b, The UMAP displays the distribution of hUSI value of each cell in the melanoma dataset. c, Violin plot compares hUSI levels between untreated and treated groups in immune therapy (two-tailed Wilcoxon test). The box in the boxplot represents the IQR, with its lower and upper edges indicating the 25th and 75th percentiles, respectively. The medium value (50th percentile) is shown within the box, and the whiskers extend to the minimum and maximum values within 1.5 times the IQR of the quartiles. ***P < 1 × 10⁻³. The exact P values are reported in Source Data for Fig. 5. d, The proportions of three tumor senescence subpopulations of untreated and treated groups in immune therapy. e, Senescence trajectory of melanoma tumor cells in PHATE space. f, Increased expression levels of aging-related marker genes CDKN1A and SERPINE along the trajectory in e and in different senescence subpopulations. g, Different GO terms (biological process (BP)) characterize Cycling, Transitional and Senescent subpopulations, with replication-associated terms enriched by the Cycling subpopulation and immunity activation-related terms enriched by the Senescent subpopulation (the hypergeometric test with Benjamini–Hochberg correction). The exact FDR-corrected P values are reported in Source Data for Fig. 5. h, Heatmap of Spearman correlation coefficient between the abundance of the three subpopulations and that of 22 immune cell types. i, Survival curves of patients with melanoma with low or high proportion of Senescent subpopulation in the TCGA-SKCM cohort (log-rank test). j, Dot plot showing the interaction strength of three tumor subpopulations and six cell types in the TME. k, Dot plot of communication probabilities for signaling pathways presenting in the Senescent subpopulation while absent in the Cycling subpopulation (permutation test, n = 100 iterations). l, Chord plots showing that Macro and CAFs interact with Transitional and Senescent subpopulations by the TGFβ signaling pathway. m, Violin plot showing the expression levels of four receptors specifically expressed in the Senescent subpopulation. n, Survival curves of patients with melanoma with low or high enrichment score of TGFBR2, ACVR1, ALCAM and CCR10 in the TCGA-SKCM cohort (log-rank test). tSNE, t-distributed stochastic neighbor embedding. Source dataCC BY-NC-ND · PubMed Central
Extended Data Fig. 1 Details of the dataset used for model training and parameter testing. a. Criteria for selecting senescent samples in the training set. b. Boxplot showing that senescent samples included in the training set have significantly higher expression of CDKN1A, CDKN2B, and SERPINE1 compared to non-senescent samples (n = 770 samples; 385 senescent samples and 385 non-senescent samples; two-tailed Wilcoxon test; *** denotes p < 1e-3; The exact p values are reported in Source Data for Extended Data Fig. 1). c. Histogram showing the proportion of cell lines within each cell type, explicitly excluding merging of cancer cell lines due to their high heterogeneity. d. ARI values plotted against numbers of removed cell-type-specific genes at a clustering resolution of 0.6, with the elbow point at 85 highlighted by a dashed line. e. Log2 fold change of the top 85 cell-type-specific genes across various cell types. f. Conceptual diagram illustrating the 10-folds cross-validation OOD (10-folds CV OOD) test methodology (Supplementary Information Note 3). g, h. AUC values for models using different L2 values and quantification methods in the OOD test. Source data
Extended Data Fig. 1 Details of the dataset used for model training and parameter testing. a. Criteria for selecting senescent samples in the training set. b. Boxplot showing that senescent samples included in the training set have significantly higher expression of CDKN1A, CDKN2B, and SERPINE1 compared to non-senescent samples (n = 770 samples; 385 senescent samples and 385 non-senescent samples; two-tailed Wilcoxon test; *** denotes p < 1e-3; The exact p values are reported in Source Data for Extended Data Fig. 1). c. Histogram showing the proportion of cell lines within each cell type, explicitly excluding merging of cancer cell lines due to their high heterogeneity. d. ARI values plotted against numbers of removed cell-type-specific genes at a clustering resolution of 0.6, with the elbow point at 85 highlighted by a dashed line. e. Log2 fold change of the top 85 cell-type-specific genes across various cell types. f. Conceptual diagram illustrating the 10-folds cross-validation OOD (10-folds CV OOD) test methodology (Supplementary Information Note 3). g, h. AUC values for models using different L2 values and quantification methods in the OOD test. Source dataCC BY-NC-ND · PubMed Central
Extended Data Fig. 2 Performance comparison of models and distribution of the OCLR-learned features. a. AUC values for models with L2 = 1 across various quantification methods (Dot, Logistic, Pearson, Spearman, Gsva, and Mean). Only the top 50 methods were displayed and only the top 10 were labeled. The red points represent the best performed methods—Spearman correlation—which is used for hUSI computation. b. AUC values of hUSI applied to integrated bulk gene expression profiles from IMR90 cells across five studies (PRJNA395363, PRJNA395378, PRJNA503415, PRJNA449912, PRJNA293984), distinguishing non-senescent (grey) and OIS (red) samples. c, d. Bar plots showing the mean AUC values across five studies (mentioned in (b)) with different sparsity levels (c) and outlier percentages (d) in gene expression profiles. e, f. The AUC values of OCLR versus RF, EN, and SVM models in OOD test, both overall (f) and by cell type (e). g. The AUC values of OCLR and two-class models (RF, EN, SVM) with different cell type numbers.h. The false positive rate, false negative rate, F1 score and AUC of SSE binary hUSI in 10-folds CV OOD test. i. Distribution of gene weights in OCLR-learned senescence features, highlighting genes related to senescence (red), cycling (blue), and SASP. j. Enrichment analysis of OCLR-learned senescence features on 268 cell type marker sets from the CellMark database and one senescence-associated gene set (SenUP) for comparison. P-values were calculated by permutation test (n = 1,000 iterations) using GSEA function, and adjusted by the Benjamini-Hochberg (BH) method. k. Bar plots exhibiting gene sets (top 5 for each database: HALLMARKER, GO, KEGG, and Reactome) positively (left) and negatively (right) enriched by the OCLR-learned senescence features. l, m. OCLR-learned senescence features were significantly positively enriched in senescence associated gene sets (l) and negatively enriched in proliferation gene sets (m). Source data
Extended Data Fig. 2 Performance comparison of models and distribution of the OCLR-learned features. a. AUC values for models with L2 = 1 across various quantification methods (Dot, Logistic, Pearson, Spearman, Gsva, and Mean). Only the top 50 methods were displayed and only the top 10 were labeled. The red points represent the best performed methods—Spearman correlation—which is used for hUSI computation. b. AUC values of hUSI applied to integrated bulk gene expression profiles from IMR90 cells across five studies (PRJNA395363, PRJNA395378, PRJNA503415, PRJNA449912, PRJNA293984), distinguishing non-senescent (grey) and OIS (red) samples. c, d. Bar plots showing the mean AUC values across five studies (mentioned in (b)) with different sparsity levels (c) and outlier percentages (d) in gene expression profiles. e, f. The AUC values of OCLR versus RF, EN, and SVM models in OOD test, both overall (f) and by cell type (e). g. The AUC values of OCLR and two-class models (RF, EN, SVM) with different cell type numbers.h. The false positive rate, false negative rate, F1 score and AUC of SSE binary hUSI in 10-folds CV OOD test. i. Distribution of gene weights in OCLR-learned senescence features, highlighting genes related to senescence (red), cycling (blue), and SASP. j. Enrichment analysis of OCLR-learned senescence features on 268 cell type marker sets from the CellMark database and one senescence-associated gene set (SenUP) for comparison. P-values were calculated by permutation test (n = 1,000 iterations) using GSEA function, and adjusted by the Benjamini-Hochberg (BH) method. k. Bar plots exhibiting gene sets (top 5 for each database: HALLMARKER, GO, KEGG, and Reactome) positively (left) and negatively (right) enriched by the OCLR-learned senescence features. l, m. OCLR-learned senescence features were significantly positively enriched in senescence associated gene sets (l) and negatively enriched in proliferation gene sets (m). Source dataCC BY-NC-ND · PubMed Central
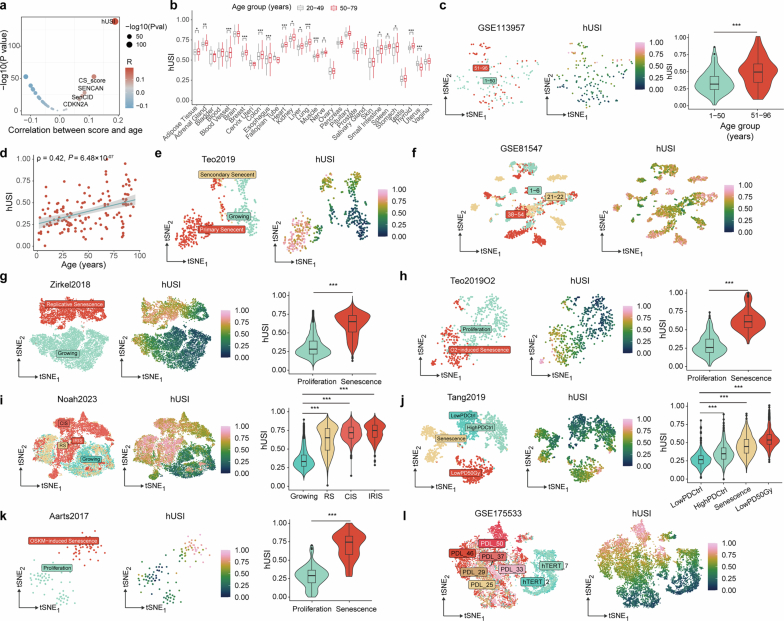
Extended Data Fig. 3 The distribution of hUSI across diverse datasets. a. Scatter plot showing the significance of Spearman correlation between hUSI scores and the ages of GTEx samples. Each point represents a different method, with the top five correlated methods labeled. P-values were calculated using cor.test function. b. Box plot of hUSI levels in GTEx samples stratified across various tissues by age groups (n = 17382 samples; 5345 donors aged 20 to 49 and 12037 donors aged 50 to 70). Asterisks denote significance levels, (two-tailed t-test). c. t-SNE distribution of bulk samples from donors aged from 1 to 96 years, which were clustered into two age groups (left panel). The middle panel shows hUSI values for each sample in UAMP, while the right panel shows the comparison of hUSI levels between the two age groups (n = 143 samples; 83 donors aged 1 to 50 and 60 donors aged 51 to 96; two-tailed Wilcoxon test). d. Scatter plot showing the Spearman correlation between hUSI scores and age in the human skin dataset. e. Cell distribution in the Teo2019 dataset. The left panel shows the t-SNE distribution of different cell groups, and the right panel displays hUSI values for each cell. f. Cell distribution in the human pancreas dataset. g-k. Five single-cell RNA-seq datasets included for benchmarking (the number of cells for each dataset is provided in Supplementary Data 3). The left panel shows the t-SNE distributions of different cell groups, the middle panel displays hUSI values for each cell, and the right panel presents the comparison of hUSI levels across different groups (two-tailed Wilcoxon test). l. The t-SNE distribution of cells at different immortalization stages (hTERT_2 and hTERT_7) and passage stages (PDL_25, PDL_29, PDL_33, PDL_37, PDL_46, and PDL_50). The boxplots in the upper panels (b-c, g-k) represents the interquartile range (IQR), with its lower and upper edges indicating the 25th and 75th percentiles, respectively. The medium value (50th percentile) is shown within the box, and the whiskers extend to the minimum and maximum values within 1.5 times the IQR of the quartiles. For all statistics, * denotes p < 0.05, ** denotes p < 0.01 and *** denotes p < 1e-3; The exact p values are reported in Source Data for Extended Data Fig. 3. Source data
Extended Data Fig. 3 The distribution of hUSI across diverse datasets. a. Scatter plot showing the significance of Spearman correlation between hUSI scores and the ages of GTEx samples. Each point represents a different method, with the top five correlated methods labeled. P-values were calculated using cor.test function. b. Box plot of hUSI levels in GTEx samples stratified across various tissues by age groups (n = 17382 samples; 5345 donors aged 20 to 49 and 12037 donors aged 50 to 70). Asterisks denote significance levels, (two-tailed t-test). c. t-SNE distribution of bulk samples from donors aged from 1 to 96 years, which were clustered into two age groups (left panel). The middle panel shows hUSI values for each sample in UAMP, while the right panel shows the comparison of hUSI levels between the two age groups (n = 143 samples; 83 donors aged 1 to 50 and 60 donors aged 51 to 96; two-tailed Wilcoxon test). d. Scatter plot showing the Spearman correlation between hUSI scores and age in the human skin dataset. e. Cell distribution in the Teo2019 dataset. The left panel shows the t-SNE distribution of different cell groups, and the right panel displays hUSI values for each cell. f. Cell distribution in the human pancreas dataset. g-k. Five single-cell RNA-seq datasets included for benchmarking (the number of cells for each dataset is provided in Supplementary Data 3). The left panel shows the t-SNE distributions of different cell groups, the middle panel displays hUSI values for each cell, and the right panel presents the comparison of hUSI levels across different groups (two-tailed Wilcoxon test). l. The t-SNE distribution of cells at different immortalization stages (hTERT_2 and hTERT_7) and passage stages (PDL_25, PDL_29, PDL_33, PDL_37, PDL_46, and PDL_50). The boxplots in the upper panels (b-c, g-k) represents the interquartile range (IQR), with its lower and upper edges indicating the 25th and 75th percentiles, respectively. The medium value (50th percentile) is shown within the box, and the whiskers extend to the minimum and maximum values within 1.5 times the IQR of the quartiles. For all statistics, * denotes p < 0.05, ** denotes p < 0.01 and *** denotes p < 1e-3; The exact p values are reported in Source Data for Extended Data Fig. 3. Source dataCC BY-NC-ND · PubMed Central
Extended Data Fig. 4 hUSI revealed potential senescence regulators. a. A high similarity transcript (ENSG00000275464) hinders the design of siRNA for the knockdown of PWP2. b-e. Senescence validation of PRIM1 knockdown in ARPE19 cells (n = 3 biological replicates; two-tailed t-test, the exact p values were shown in Source Data Extended Data Fig. 4). PRIM1 was knocked down by two siRNAs (si-PRIM1-1 and si-PRIM1-2) (b). The senescence status was demonstrated by representative images of SA-β-Gal staining (c). The gene expression of CDKN1A, CDK1, LMNB1 and MKI67 evaluated by qRT-PCR (n = 3 biological replicates) (d) and the Western blot of p21 protein levels (e) before and after PRIM1 knockdown in ARPE19 cells, with GAPDH serving as the internal control. f-i, j-m, n-q and r-u present the senescence validation results for PSMA7, INCENP, PSMD2, and DDX49 (as those in b-e), respectively. Data are presented as mean ± SEM. *, **, and *** denote p < 0.05, p < 0.01 and p < 1e-3, respectively, two-tailed t-test. The exact p values of f-h, j-l, n-p, r-t were shown in Source Data for Extended Data Fig. 4. Source data
Extended Data Fig. 4 hUSI revealed potential senescence regulators. a. A high similarity transcript (ENSG00000275464) hinders the design of siRNA for the knockdown of PWP2. b-e. Senescence validation of PRIM1 knockdown in ARPE19 cells (n = 3 biological replicates; two-tailed t-test, the exact p values were shown in Source Data Extended Data Fig. 4). PRIM1 was knocked down by two siRNAs (si-PRIM1-1 and si-PRIM1-2) (b). The senescence status was demonstrated by representative images of SA-β-Gal staining (c). The gene expression of CDKN1A, CDK1, LMNB1 and MKI67 evaluated by qRT-PCR (n = 3 biological replicates) (d) and the Western blot of p21 protein levels (e) before and after PRIM1 knockdown in ARPE19 cells, with GAPDH serving as the internal control. f-i, j-m, n-q and r-u present the senescence validation results for PSMA7, INCENP, PSMD2, and DDX49 (as those in b-e), respectively. Data are presented as mean ± SEM. *, **, and *** denote p < 0.05, p < 0.01 and p < 1e-3, respectively, two-tailed t-test. The exact p values of f-h, j-l, n-p, r-t were shown in Source Data for Extended Data Fig. 4. Source dataCC BY-NC-ND · PubMed Central
Extended Data Fig. 5 The accumulation of senescent cells in COVID-19. a. Bar plot showing the percentage of senescent subpopulations across various cell types. b, c. Dot plots displaying the fractional difference of Senescent-like cells (y-axis) between the COVID-19 and Control groups (b) and that between Severe and Moderate COVID-19 groups (c) across all fine cell types. Source data
Extended Data Fig. 5 The accumulation of senescent cells in COVID-19. a. Bar plot showing the percentage of senescent subpopulations across various cell types. b, c. Dot plots displaying the fractional difference of Senescent-like cells (y-axis) between the COVID-19 and Control groups (b) and that between Severe and Moderate COVID-19 groups (c) across all fine cell types. Source dataCC BY-NC-ND · PubMed Central
Extended Data Fig. 6 hUSI identifies prognosis-related senescent tumor cells in melanoma. a. The distribution of hUSI across different senescent subpopulations. b. Venn diagram showing the validation of subpopulation of different senescence degrees (Cycling, Transitional and Senescent) by overlapping their specifically highly expressed genes with genes up-regulated in replicative senescent (RS) or growing samples. P-values were calculated by hypergeometric distribution test. c. Heatmap showing the activity values of 89 ICAnet modules across cells, sorted by hUSI value. d. Survival curves of melanoma patients with low or high proportion of Transitional subpopulation in TCGA-SCKM cohort. e. Survival curves of melanoma patients with low or high proportion of Cycling subpopulation in TCGA-SCKM cohort. f. Incoming (left panel) and outgoing (right panel) network in each tumor subpopulation and other cell types, with point size indicating interaction strength and arrow thickness representing weight size. g. River plot showing the outgoing pattern 1 and 6 in three tumor subpopulations (left panel) and the corresponding genes involved in these two patterns were labeled out (right panel). h. Chord plots showing the interaction between Senescent subpopulation and other cell types in tumor microenvironment by CSPG4, CD6, CD46 and CCL signaling pathways, respectively. i-l. Survival curves of melanoma patients with low or high expression of TGFBR2 (i), ACVR1 (j), ALCAM (k), and CCR10 (l) in TCGA-SCKM cohort. Source data
Extended Data Fig. 6 hUSI identifies prognosis-related senescent tumor cells in melanoma. a. The distribution of hUSI across different senescent subpopulations. b. Venn diagram showing the validation of subpopulation of different senescence degrees (Cycling, Transitional and Senescent) by overlapping their specifically highly expressed genes with genes up-regulated in replicative senescent (RS) or growing samples. P-values were calculated by hypergeometric distribution test. c. Heatmap showing the activity values of 89 ICAnet modules across cells, sorted by hUSI value. d. Survival curves of melanoma patients with low or high proportion of Transitional subpopulation in TCGA-SCKM cohort. e. Survival curves of melanoma patients with low or high proportion of Cycling subpopulation in TCGA-SCKM cohort. f. Incoming (left panel) and outgoing (right panel) network in each tumor subpopulation and other cell types, with point size indicating interaction strength and arrow thickness representing weight size. g. River plot showing the outgoing pattern 1 and 6 in three tumor subpopulations (left panel) and the corresponding genes involved in these two patterns were labeled out (right panel). h. Chord plots showing the interaction between Senescent subpopulation and other cell types in tumor microenvironment by CSPG4, CD6, CD46 and CCL signaling pathways, respectively. i-l. Survival curves of melanoma patients with low or high expression of TGFBR2 (i), ACVR1 (j), ALCAM (k), and CCR10 (l) in TCGA-SCKM cohort. Source dataCC BY-NC-ND · PubMed Central

Verification

Claims the paper makes

The claims and statistics of this paper haven’t been checked yet.

Free: it reads the open-access text and checks the first 5 claims that cite a source we can check. Create a free account to check every claim.

A few free checks a day · papers already verified open instantly · results are public

Claims other papers make about this one

Each is checked against this paper’s own text: does it say what the citing paper says it does?

1 more claim about this paper

Create a free account to see every claim other papers make about this one.

See all claims — free account

Self-check

Percentages, sums and reported differences re-computed from the paper’s own numbers.

The self-check needs the paper’s full text.

Citations

Cites

2 retracted

Show all 220 references

Cited by

See all 28

Metadata

Authors
Wang, J., Zhou, X., Yu, P., Yao, J., Guo, P., Xu, Q., Zhao, Y., Wang, G., Li, Q., Zhu, X., Wei, G., Wang, W., & Ni, T.
Affiliations
  • Fudan University (CN)
  • Inner Mongolia University (CN)
Corresponding author
  • Wei, Gang
  • Wang, Weixu
  • Ni, Ting
Venue
Nature Aging
Published
2025-05-29
Volume
5
Issue
6
Pages
1159-1175
ISSN
2662-8465 (ISSN-L)
OpenAlex
W4410866579
Cited by
28
References
220
Citations by year
2026: 21 · 2025: 7
FWCI
18.02
Type
journal article
Language
en
Open access
Licence
Locations
  • Nature Aging (publishedVersion, cc-by-nc-nd)
  • Research Square (acceptedVersion, cc-by)
  • PubMed Central (publishedVersion, cc-by-nc-nd)
  • PubMed (publishedVersion)
Funders
  • National Natural Science Foundation of China (92249302, 32370592)
  • National Key Research and Development Program of China ([2021YFA0909300], 2023YFC3603300)
Topics
  • Life Sciences › Biochemistry, Genetics and Molecular Biology › Cell Biology › Telomeres, Telomerase, and Senescence
  • Life Sciences › Biochemistry, Genetics and Molecular Biology › Aging › Genetics, Aging, and Longevity in Model Organisms
  • Life Sciences › Biochemistry, Genetics and Molecular Biology › Molecular Biology › Single-cell and spatial transcriptomics
Keywords
cellular senescence, transcriptome, senescent cell accumulation, COVID-19 pandemic, melanoma, prognosis, aging, senescence heterogeneity
MeSH terms
COVID-19, SARS-CoV-2, Aging, Humans, Melanoma, Cellular Senescence, Gene Expression Profiling, Transcriptome

About these checks

Registry, retraction, Cites and statistics results are computed, not judged, with one exception: a printed reference that no index lists is read once by a model before it counts as a citation error. Claims are extracted by a model and kept only when their quote appears verbatim in the text; each cited source is then checked, with a model’s help, for whether it says what the claim relies on. Those verdicts can be wrong — read the claim’s quote and the cited source before relying on one.

Statistics and arithmetic are recomputed, not judged.

Confidence bands are shown only for fields calibrated on our annotated test set. None is calibrated yet, so no band is shown.

What counts as a claim ›How we measure confidence ›How we check this ›

Are you an author, or do you see a problem with this page? Request a review

How to cite

Cite CoChat for the checks on this page, and the paper for its own findings.

This page
CoChat. (2026). Citation check: A transcriptome-based human universal senescence index (hUSI) robustly predicts cellular senescence under various conditions. https://app.cochat.ai/papers/10.1038/s43587-025-00886-2
The paper
Wang, J., Zhou, X., Yu, P., Yao, J., Guo, P., Xu, Q., Zhao, Y., Wang, G., Li, Q., Zhu, X., Wei, G., Wang, W., & Ni, T. (2025). A transcriptome-based human universal senescence index (hUSI) robustly predicts cellular senescence under various conditions. Nature Aging. https://doi.org/10.1038/s43587-025-00886-2

Data sources

Bibliographic data: Semantic Scholar, OpenAlex, Crossref.

Contains information from the Semantic Scholar Academic Graph Datasets, made available under the ODC Attribution License (ODC-BY 1.0).

Semantic Scholar’s data is described in: Kinney, R., et al. (2023). The Semantic Scholar Open Data Platform. arXiv:2301.10140.