Cited by 82

The DOI matches its Crossref record; 10 of the 10 references it cites were found in a registry or an index.

Senescent macrophages induce ferroptosis in skeletal muscle and accelerate osteoarthritis-related muscle atrophy

Xiang, Wei, Zhang, Tongyi, Li, Bingfei, Li, Song, Zhang, Bin, Fang, Shunzheng, Chen, Lifeng, Gong, Yunquan, Huang, Bo, Feng, Daibo, Wu, Jinhui, Yuan, Jing, Wu, Yaran, Yan, Xiaojing, Jin, Runze, Zhang, Xiaoqi, Fang, Xiangqin, Lian, Jiqin, Chen, Lin, Zhou, Siru, Ni, Zhenhong·2025·Nature Aging

Overview

The claims and statistics of this paper haven’t been checked yet.

Run the check — free, no account needed. It reads the open-access text and checks the sources it cites.

A few free checks a day · papers already verified open instantly · results are public

Integrity signals

Registry

Crossref · 10.1038/s43587-025-00907-0

Cites

10 of 10 references verified0 citation errors · 0 not checkable

Statistics

Figures

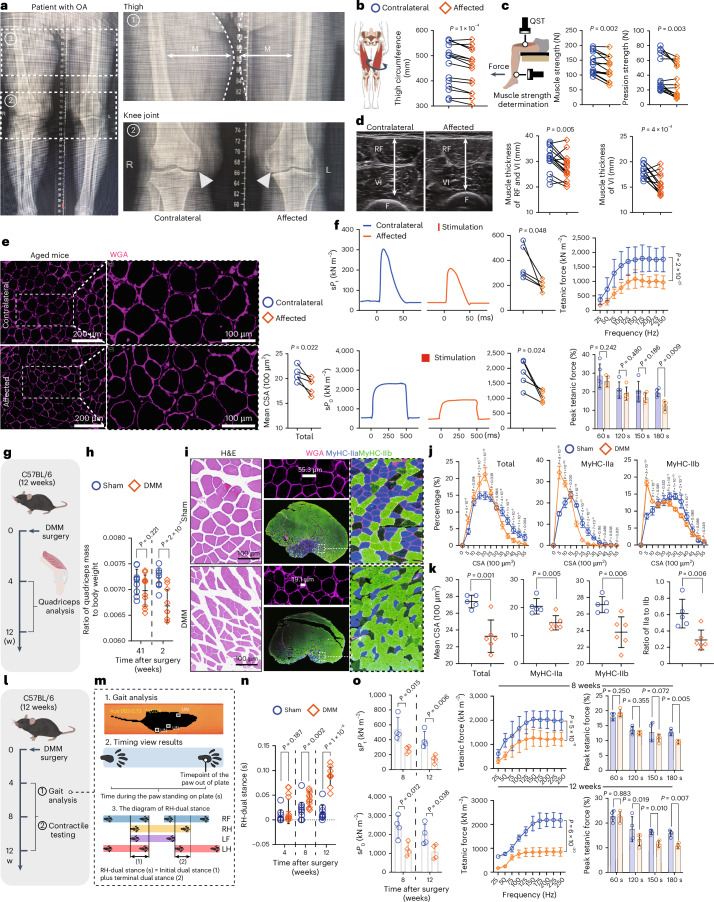
Fig. 1 The muscle mass and function of the quadriceps significantly decline during the progression of OA in the affected joint. a, The X-ray image depicts a patient suffering from severe unilateral OA. M, muscle. b,c, The muscle quality of the quadriceps, including thigh circumference (b) and muscle strength and QST (c), was assessed in both the contralateral and affected sides of patients with unilateral OA (n = 15). d, Musculoskeletal ultrasound analysis of the cross-sectional diameter of RF combined with VI, or VI alone, in patients with severe unilateral OA (n = 15). e, Aged mice (21 months) with spontaneous unilateral OA were used to investigate muscle quality. The CSA of the quadriceps was quantified using WGA staining (n = 5). f, Contractile properties analysis was conducted on aged mice, and data of the normalized single-twitch force (sPt), the maximum isometric tetanic force (sPo) and the tetanic force, as well as the peak tetanic force, are shown (n = 5). g, Illustration of quadriceps quality analysis. h, Mass quantification of quadriceps in mice with DMM (n = 10) or sham (n = 9) surgery. i, H&E staining and immunostaining for the total myofibers, MyHC-IIa fibers and MyHC-IIb fibers of quadriceps cross-sections in mice at 12 weeks after DMM or sham surgery. Represented images were selected from sections of the quadriceps above (n = 6 sham, n = 5 DMM). j,k, Quantification of i, including CSA distribution (j) and mean CSA (k) (n = 6 sham, n = 5 DMM). l, Experimental scheme of gait analysis and contractile testing. m, Scheme of the measurement methodology for RH-dual stance. n, Data of RH-dual stance in mice with DMM or sham surgery (n = 10 sham (4 weeks) and sham (12 weeks), n = 13 sham (8 weeks), n = 11 DMM (8 weeks) and DMM (12 weeks), n = 16 DMM (4 weeks)). o, The contractile properties analysis for mice after DMM (n = 4) or sham (n = 4) surgery. Data are presented as mean ± s.e.m. unless otherwise noted; all statistical tests were two-sided unless otherwise noted; and n represents biological replicates unless otherwise noted. Paired t-test (b,c (muscle strength), d–f (sPt), f (sPo)). Wilcoxon signed-rank test (c (pression strength)). Student’s t-test (h,k,n,o (sPt), o (sPo)). Two-way ANOVA with Bonferroni test (f (peak tetanic force), j,o (peak tetanic force)). Median (25% IQR, 75% IQR; c (pression strength)). IQR, interquartile range; w, weeks; UN, unidentified; LF, left foot; LH, left hand; RF, right hand.
Fig. 1 The muscle mass and function of the quadriceps significantly decline during the progression of OA in the affected joint. a, The X-ray image depicts a patient suffering from severe unilateral OA. M, muscle. b,c, The muscle quality of the quadriceps, including thigh circumference (b) and muscle strength and QST (c), was assessed in both the contralateral and affected sides of patients with unilateral OA (n = 15). d, Musculoskeletal ultrasound analysis of the cross-sectional diameter of RF combined with VI, or VI alone, in patients with severe unilateral OA (n = 15). e, Aged mice (21 months) with spontaneous unilateral OA were used to investigate muscle quality. The CSA of the quadriceps was quantified using WGA staining (n = 5). f, Contractile properties analysis was conducted on aged mice, and data of the normalized single-twitch force (sPt), the maximum isometric tetanic force (sPo) and the tetanic force, as well as the peak tetanic force, are shown (n = 5). g, Illustration of quadriceps quality analysis. h, Mass quantification of quadriceps in mice with DMM (n = 10) or sham (n = 9) surgery. i, H&E staining and immunostaining for the total myofibers, MyHC-IIa fibers and MyHC-IIb fibers of quadriceps cross-sections in mice at 12 weeks after DMM or sham surgery. Represented images were selected from sections of the quadriceps above (n = 6 sham, n = 5 DMM). j,k, Quantification of i, including CSA distribution (j) and mean CSA (k) (n = 6 sham, n = 5 DMM). l, Experimental scheme of gait analysis and contractile testing. m, Scheme of the measurement methodology for RH-dual stance. n, Data of RH-dual stance in mice with DMM or sham surgery (n = 10 sham (4 weeks) and sham (12 weeks), n = 13 sham (8 weeks), n = 11 DMM (8 weeks) and DMM (12 weeks), n = 16 DMM (4 weeks)). o, The contractile properties analysis for mice after DMM (n = 4) or sham (n = 4) surgery. Data are presented as mean ± s.e.m. unless otherwise noted; all statistical tests were two-sided unless otherwise noted; and n represents biological replicates unless otherwise noted. Paired t-test (b,c (muscle strength), d–f (sPt), f (sPo)). Wilcoxon signed-rank test (c (pression strength)). Student’s t-test (h,k,n,o (sPt), o (sPo)). Two-way ANOVA with Bonferroni test (f (peak tetanic force), j,o (peak tetanic force)). Median (25% IQR, 75% IQR; c (pression strength)). IQR, interquartile range; w, weeks; UN, unidentified; LF, left foot; LH, left hand; RF, right hand.CC BY-NC-ND · PubMed Central
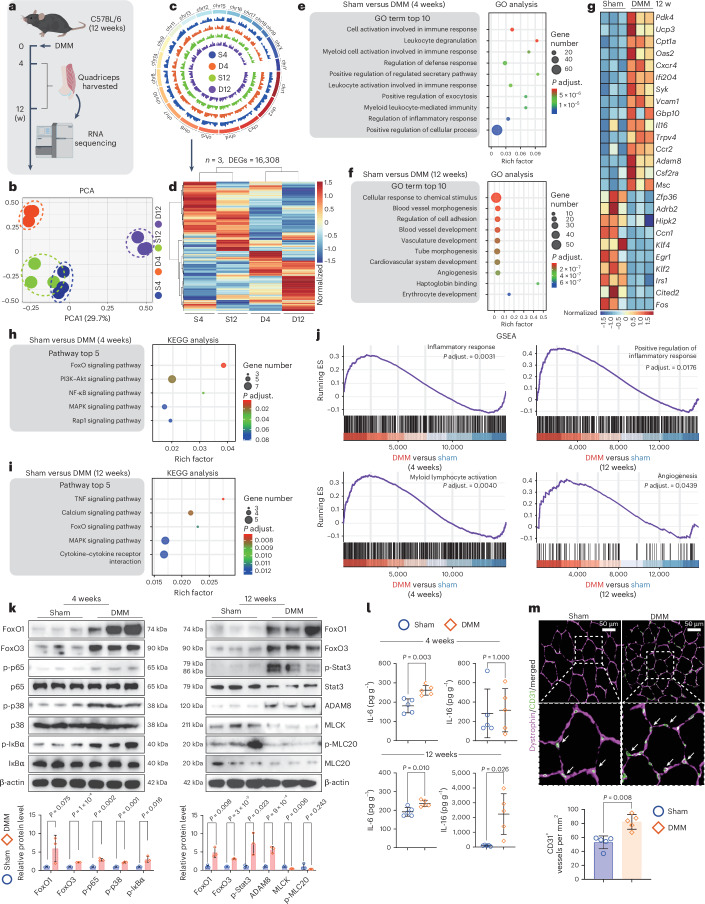
Fig. 2 The main pathological characteristic of quadriceps in OA joints is the presence of chronic inflammation. a, Scheme of transcriptome sequencing in the quadriceps of mice at 4 weeks and 12 weeks after DMM (D4 and D12) or sham (S4 and S12) surgery. Each tested sample was a pool derived from two individual mice. Bioinformatic analysis of the results from RNA-seq. b–d, The PCA (b), genomic localization of sequencing reads (c) and heatmap of DEGs (d) are presented separately (n = 3). e,f, The top enriched terms of GO analysis for significant DEGs in quadriceps of mice between S4 versus D4 (e) and S12 versus D12 (f). g, The top 15 upregulated and 10 downregulated DEGs from f are presented. h,i, The top enriched pathways of KEGG analysis for significant DEGs in quadriceps between S4 versus D4 (h) and S12 versus D12 (i). j, The representative enriched gene sets of GSEA for DEGs in quadriceps of mice between S4 versus D4 and S12 versus D12. k, Immunoblotting analysis for total protein from quadriceps of mice at S4, D4, S12 and D12 (n = 3). l, ELISA analysis for IL-6 and IL-16 levels in the quadriceps of mice at S4, D4, S12 and D12 (n = 5). m, The representative images and the quantitative results of CD31+ vessels in quadriceps cross-sections of mice at S12 and D12 (n = 5). Data are presented as mean ± s.e.m. unless otherwise noted; all statistical tests were two-sided unless otherwise noted; and n represents biological replicates unless otherwise noted. Student’s t-test (k,l (IL-6 of 4 weeks and 12 weeks), l (IL-16 of 12 weeks)). Mann–Whitney U-test (l (IL-16 of 4 weeks), m). Median (25% IQR, 75% IQR; l (IL-16 of 4 weeks), m). ES, enrichment score; adjust., adjusted. Source data
Fig. 2 The main pathological characteristic of quadriceps in OA joints is the presence of chronic inflammation. a, Scheme of transcriptome sequencing in the quadriceps of mice at 4 weeks and 12 weeks after DMM (D4 and D12) or sham (S4 and S12) surgery. Each tested sample was a pool derived from two individual mice. Bioinformatic analysis of the results from RNA-seq. b–d, The PCA (b), genomic localization of sequencing reads (c) and heatmap of DEGs (d) are presented separately (n = 3). e,f, The top enriched terms of GO analysis for significant DEGs in quadriceps of mice between S4 versus D4 (e) and S12 versus D12 (f). g, The top 15 upregulated and 10 downregulated DEGs from f are presented. h,i, The top enriched pathways of KEGG analysis for significant DEGs in quadriceps between S4 versus D4 (h) and S12 versus D12 (i). j, The representative enriched gene sets of GSEA for DEGs in quadriceps of mice between S4 versus D4 and S12 versus D12. k, Immunoblotting analysis for total protein from quadriceps of mice at S4, D4, S12 and D12 (n = 3). l, ELISA analysis for IL-6 and IL-16 levels in the quadriceps of mice at S4, D4, S12 and D12 (n = 5). m, The representative images and the quantitative results of CD31+ vessels in quadriceps cross-sections of mice at S12 and D12 (n = 5). Data are presented as mean ± s.e.m. unless otherwise noted; all statistical tests were two-sided unless otherwise noted; and n represents biological replicates unless otherwise noted. Student’s t-test (k,l (IL-6 of 4 weeks and 12 weeks), l (IL-16 of 12 weeks)). Mann–Whitney U-test (l (IL-16 of 4 weeks), m). Median (25% IQR, 75% IQR; l (IL-16 of 4 weeks), m). ES, enrichment score; adjust., adjusted. Source dataCC BY-NC-ND · PubMed Central
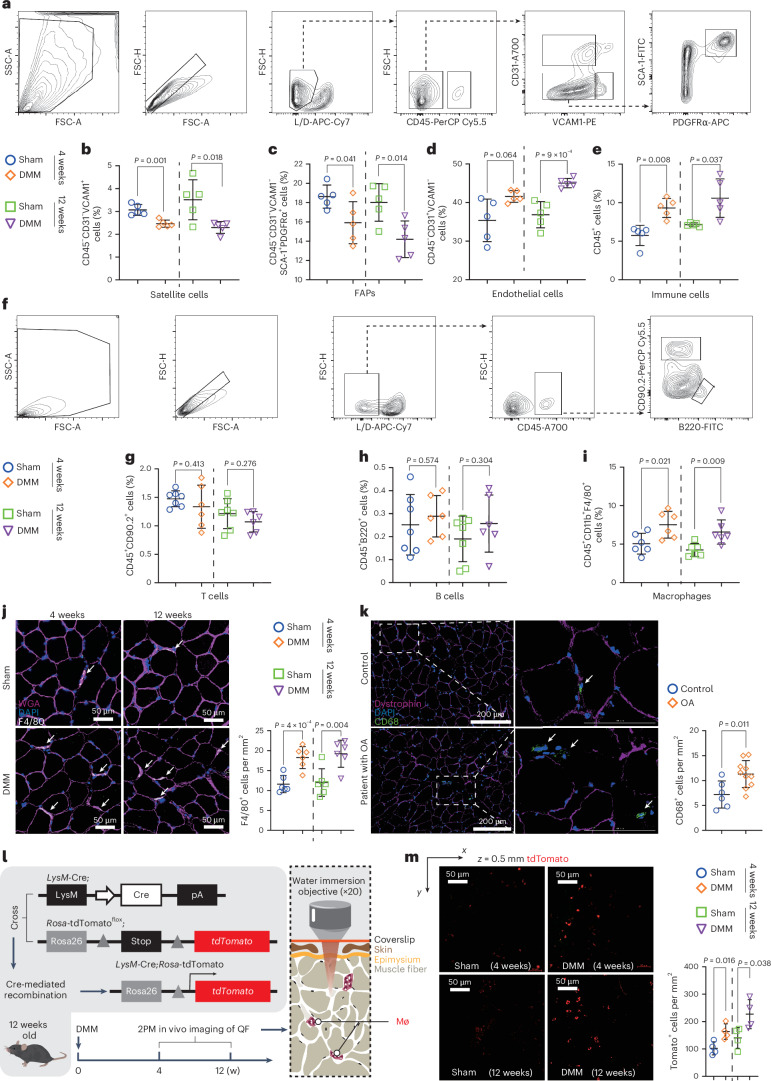
Fig. 3 The macrophage population is significantly increased in the quadriceps of OA joints. a, Flow cytometry analysis strategy for quantifying the abundance of living stromal cells in the quadriceps of mice at D4, D12, S4 and S12. b–e, The proportions of satellite cells (b), FAPs (c), endothelial cells (d) and immune cells (e) within the stromal cell population of quadriceps were determined. Each tested sample was a pool of 3 individual mice (n = 5). f, Flow cytometry analysis strategy for quantifying the abundance of living CD45+ stromal cells in the quadriceps of mice at S4, D4, S12 and D12. g,h, The proportions of T cells (g) and B cells (h) within the CD45+ stromal cell population of quadriceps were determined. Each tested sample was a pool of 3 individual mice (n = 7 sham, n = 6 DMM). i, Macrophages within the CD45+ stromal cell population of quadriceps were quantified (n = 6). j, Immunofluorescence staining and the abundance determinations of F4/80+ cells in the quadriceps of OA mice (n = 6). k, Immunofluorescence staining and quantitative analysis of CD68+ cells in the quadriceps of patients with OA and control subjects (n = 6 control, n = 10 OA). l, Experimental design. Lyz2;ROSA-tdTomato mice were used as a tracer for in vivo imaging of myeloid cells using two-photon microscopy (2PM). m, Representative images and quantitative results of 2PM-captured cells in the quadriceps of OA mice (n = 4). Data are presented as mean ± s.e.m. unless otherwise noted; all statistical tests were two-sided unless otherwise noted; and n represents biological replicates unless otherwise noted. Student’s t-test (b–d,e (12 weeks), g–m). Mann–Whitney U-test (e (4 weeks)). Median (25% IQR, 75% IQR; e (4 weeks)). FSC-A, forward scatter area; FSC-H, forward scatter height; SSC-A, side scatter area; Mø, macrophage; QF, quadriceps.
Fig. 3 The macrophage population is significantly increased in the quadriceps of OA joints. a, Flow cytometry analysis strategy for quantifying the abundance of living stromal cells in the quadriceps of mice at D4, D12, S4 and S12. b–e, The proportions of satellite cells (b), FAPs (c), endothelial cells (d) and immune cells (e) within the stromal cell population of quadriceps were determined. Each tested sample was a pool of 3 individual mice (n = 5). f, Flow cytometry analysis strategy for quantifying the abundance of living CD45+ stromal cells in the quadriceps of mice at S4, D4, S12 and D12. g,h, The proportions of T cells (g) and B cells (h) within the CD45+ stromal cell population of quadriceps were determined. Each tested sample was a pool of 3 individual mice (n = 7 sham, n = 6 DMM). i, Macrophages within the CD45+ stromal cell population of quadriceps were quantified (n = 6). j, Immunofluorescence staining and the abundance determinations of F4/80+ cells in the quadriceps of OA mice (n = 6). k, Immunofluorescence staining and quantitative analysis of CD68+ cells in the quadriceps of patients with OA and control subjects (n = 6 control, n = 10 OA). l, Experimental design. Lyz2;ROSA-tdTomato mice were used as a tracer for in vivo imaging of myeloid cells using two-photon microscopy (2PM). m, Representative images and quantitative results of 2PM-captured cells in the quadriceps of OA mice (n = 4). Data are presented as mean ± s.e.m. unless otherwise noted; all statistical tests were two-sided unless otherwise noted; and n represents biological replicates unless otherwise noted. Student’s t-test (b–d,e (12 weeks), g–m). Mann–Whitney U-test (e (4 weeks)). Median (25% IQR, 75% IQR; e (4 weeks)). FSC-A, forward scatter area; FSC-H, forward scatter height; SSC-A, side scatter area; Mø, macrophage; QF, quadriceps.CC BY-NC-ND · PubMed Central
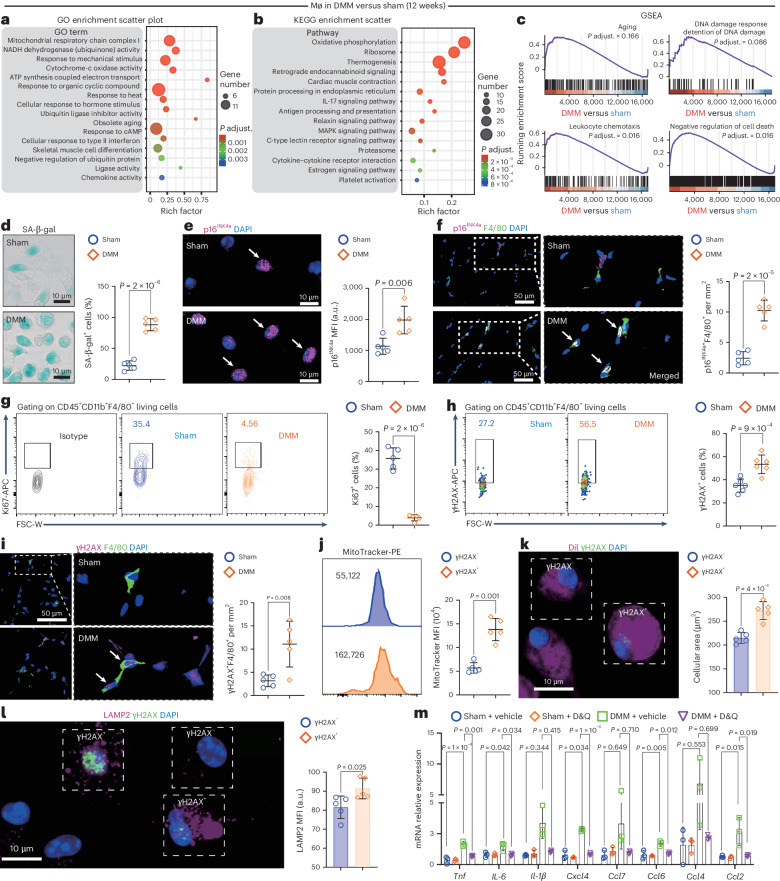
Fig. 4 Macrophages in the quadriceps of OA joints exhibit a senescent phenotype. a, The top enriched terms of GO analysis for the significant DEGs in quadriceps of mice between D12 versus S12. b, The top enriched pathways of KEGG analysis for the significant DEGs in quadriceps of mice between D12 versus S12. c, The representative gene sets of GSEA for the DEGs in quadriceps of mice between D12 versus S12. d,e, Representative images of SA-β-gal+ macrophages and counting result (d), and immunofluorescence staining images of p16INK4a+ macrophages sorted from quadriceps tissue of mice at S12 and D12 and the analysis of MFI (n = 5) (e). f, Representative immunofluorescence images and quantitative results of F4/80+p16INK4a+ cell population in quadriceps cross-sections of mice at S12 and D12 (n = 5). g,h, The flow cytometry profiles and corresponding quantitative results of Ki67+ (g, n = 5) or γH2AX+ (h, n = 6) cells in living CD45+CD11b+F4/80+ macrophages within quadriceps tissue of mice at S12 and D1. i, Representative images and quantification analysis of F4/80+γH2AX+ cell population in quadriceps cross-sections of mice at S12 and D12 (n = 5). j, The flow cytometry profiles and corresponding quantitative results of MitoTracker intensity in γH2AX+ and γH2AX− macrophages isolated from quadriceps tissue of mice at D12 (n = 5). k,l, Representative images and the analysis results of Dil+ area (k) and LAMP2 intensity (l) were compared between γH2AX+ and γH2AX−macrophages isolated from quadriceps of mice at D12 (n = 5). m, Relative mRNA expression levels of SASP in macrophages isolated from quadriceps tissue of mice at S12 and D12 after D&Q treatment. Macrophages from each tested sample were sorted and pooled from a minimum of 10 individual mice (n = 3). Data are presented as mean ± s.e.m. unless otherwise noted; all statistical tests were two-sided unless otherwise noted; and n represents biological replicates unless otherwise noted. Student’s t-test (d–l). One-way ANOVA with Bonferroni test (m (Tnf), m (Il-6), m (Ccl6), m (Ccl2)). One-way ANOVA with Tamhane’s T2 test (m (Il-1β), m (Cxcl4), m (Ccl7), m (Ccl4)).
Fig. 4 Macrophages in the quadriceps of OA joints exhibit a senescent phenotype. a, The top enriched terms of GO analysis for the significant DEGs in quadriceps of mice between D12 versus S12. b, The top enriched pathways of KEGG analysis for the significant DEGs in quadriceps of mice between D12 versus S12. c, The representative gene sets of GSEA for the DEGs in quadriceps of mice between D12 versus S12. d,e, Representative images of SA-β-gal+ macrophages and counting result (d), and immunofluorescence staining images of p16INK4a+ macrophages sorted from quadriceps tissue of mice at S12 and D12 and the analysis of MFI (n = 5) (e). f, Representative immunofluorescence images and quantitative results of F4/80+p16INK4a+ cell population in quadriceps cross-sections of mice at S12 and D12 (n = 5). g,h, The flow cytometry profiles and corresponding quantitative results of Ki67+ (g, n = 5) or γH2AX+ (h, n = 6) cells in living CD45+CD11b+F4/80+ macrophages within quadriceps tissue of mice at S12 and D1. i, Representative images and quantification analysis of F4/80+γH2AX+ cell population in quadriceps cross-sections of mice at S12 and D12 (n = 5). j, The flow cytometry profiles and corresponding quantitative results of MitoTracker intensity in γH2AX+ and γH2AX− macrophages isolated from quadriceps tissue of mice at D12 (n = 5). k,l, Representative images and the analysis results of Dil+ area (k) and LAMP2 intensity (l) were compared between γH2AX+ and γH2AX−macrophages isolated from quadriceps of mice at D12 (n = 5). m, Relative mRNA expression levels of SASP in macrophages isolated from quadriceps tissue of mice at S12 and D12 after D&Q treatment. Macrophages from each tested sample were sorted and pooled from a minimum of 10 individual mice (n = 3). Data are presented as mean ± s.e.m. unless otherwise noted; all statistical tests were two-sided unless otherwise noted; and n represents biological replicates unless otherwise noted. Student’s t-test (d–l). One-way ANOVA with Bonferroni test (m (Tnf), m (Il-6), m (Ccl6), m (Ccl2)). One-way ANOVA with Tamhane’s T2 test (m (Il-1β), m (Cxcl4), m (Ccl7), m (Ccl4)).CC BY-NC-ND · PubMed Central
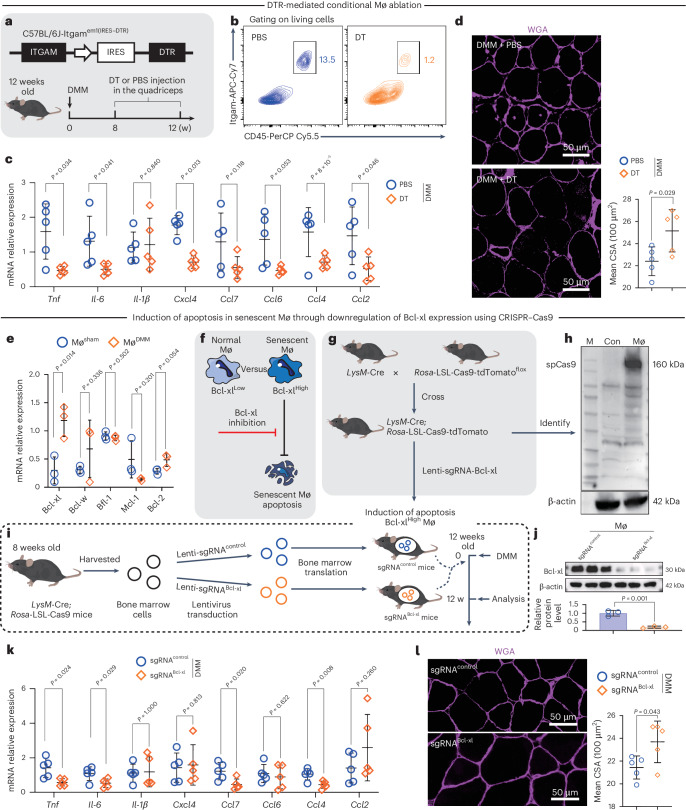
Fig. 5 Macrophages with a senescent phenotype disrupt muscle homeostasis in the quadriceps of OA joints. a, Experimental design for macrophage elimination in OA mice induced by DMM surgery. b, The flow cytometry profiles of living CD45+Itgam+ cells in quadriceps of Itgam–IRES–DTR mice at D12 after DT treatment. c,d, Relative SASP mRNA expression levels (c), representative images of WGA staining and mean CSA analysis of quadriceps tissue in mice at D12 after treatment with DT or PBS (n = 5) (d). e, The relative mRNA expression levels of anti-apoptotic genes in macrophages isolated from quadriceps of mice at S12 and D12 (n = 3). f–i, Depletion of senescent macrophages in vivo. f, Scheme of senescent macrophage depletion. g, Generation of macrophage-specific Cas9 knockin mice. h, Cas9 expression in macrophages. i, Generation of sgRNAcontrol and sgRNABcl-xl mice via bone marrow transplantation. j, Verification of Bcl-xl expression level in macrophages derived from transduced bone marrow (n = 3). k,l, Relative SASP mRNA expression levels (k) and representative images of WGA staining and mean CSA analysis of quadriceps tissue in recipient mice at D12 (n = 5) (l). Data are presented as mean ± s.e.m. unless otherwise noted; all statistical tests were two-sided unless otherwise noted; and n represents biological replicates unless otherwise noted. Student’s t-test (c–e,j,k (Tnf), k (Il-6), k (Cxcl4), k (Ccl7), k (Ccl6), k (Ccl4), k (Ccl2), l). Mann–Whitney U-test (k (Il-1β)). Median (25% IQR, 75% IQR; k (Il-1β)). M, marker; Con, control. Source data
Fig. 5 Macrophages with a senescent phenotype disrupt muscle homeostasis in the quadriceps of OA joints. a, Experimental design for macrophage elimination in OA mice induced by DMM surgery. b, The flow cytometry profiles of living CD45+Itgam+ cells in quadriceps of Itgam–IRES–DTR mice at D12 after DT treatment. c,d, Relative SASP mRNA expression levels (c), representative images of WGA staining and mean CSA analysis of quadriceps tissue in mice at D12 after treatment with DT or PBS (n = 5) (d). e, The relative mRNA expression levels of anti-apoptotic genes in macrophages isolated from quadriceps of mice at S12 and D12 (n = 3). f–i, Depletion of senescent macrophages in vivo. f, Scheme of senescent macrophage depletion. g, Generation of macrophage-specific Cas9 knockin mice. h, Cas9 expression in macrophages. i, Generation of sgRNAcontrol and sgRNABcl-xl mice via bone marrow transplantation. j, Verification of Bcl-xl expression level in macrophages derived from transduced bone marrow (n = 3). k,l, Relative SASP mRNA expression levels (k) and representative images of WGA staining and mean CSA analysis of quadriceps tissue in recipient mice at D12 (n = 5) (l). Data are presented as mean ± s.e.m. unless otherwise noted; all statistical tests were two-sided unless otherwise noted; and n represents biological replicates unless otherwise noted. Student’s t-test (c–e,j,k (Tnf), k (Il-6), k (Cxcl4), k (Ccl7), k (Ccl6), k (Ccl4), k (Ccl2), l). Mann–Whitney U-test (k (Il-1β)). Median (25% IQR, 75% IQR; k (Il-1β)). M, marker; Con, control. Source dataCC BY-NC-ND · PubMed Central
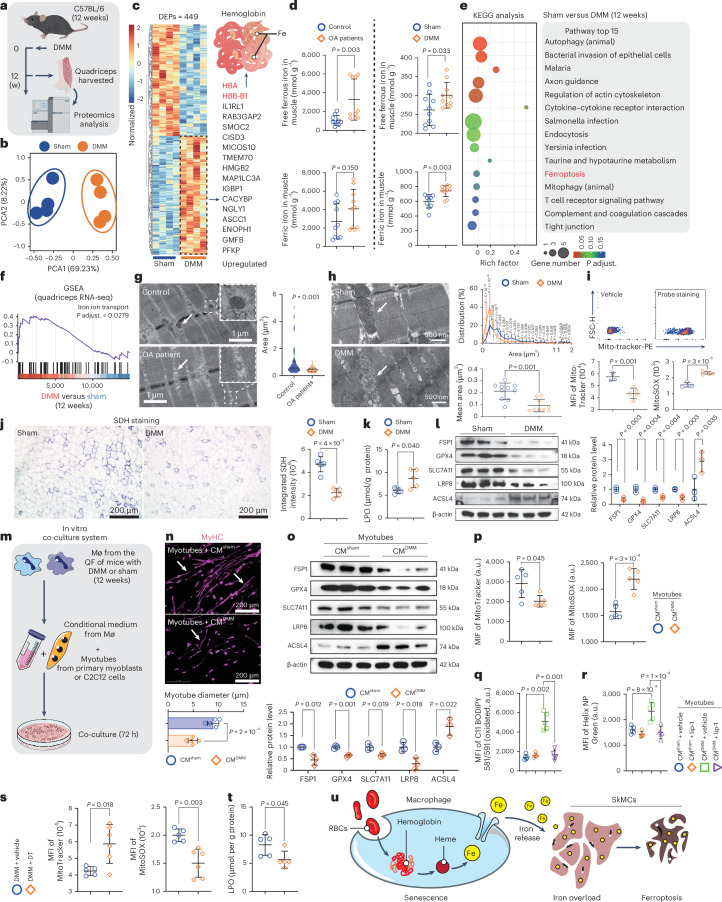
Fig. 6 Senescent macrophages induce ferroptosis of muscle cells through disruption of local iron homeostasis in the quadriceps during OA progression. a, Scheme of proteomic sequencing. b,c, PCA (b) and the heatmap (c) (n = 4). d, The levels of free Fe2+ and Fe3+ in quadriceps of patients with OA and controls (n = 10) and of mice at S12 and D12 (n = 10). e, The top 15 enriched pathways of DEPs. f, Representative enriched sets of DEGs. g,h, Representative TEM images of quadriceps muscles from patients with OA and control subjects (n = 42 control section, from 5 individuals; n = 55 OA section, from 5 individuals) (g) and from mice at S12 and D12 (n = 10 sham, n = 9 DMM) (h). i, Representative flow cytometry profiles of mitochondria and MFI of indicated dyes staining in mitochondria (n = 4 sham, n = 5 DMM). j, Representative images and statistical charts of SDH staining (n = 6 sham, n = 5 DMM). k,l, LPO products level (n = 5) (k) and blots and quantitative results (n = 3) (l). m, Scheme of stimulating myotubes or C2C12 cells with conditioned medium (CM) from macrophages of mice at S12 and D12. n–p, Representative MyHC immunofluorescence staining images and mean diameter (n = 5) (n), blots and quantitative results (n = 3) (o), and MFI of MitoTracker and MitoSOX (n = 5) (p). q,r, MFI of C11 BODIPY 581/591 staining (q) and Helix NP staining (r, n = 5). s,t, Measurement of MFI for the indicated dyes (s) and quantification of LPO levels in indicated mice (n = 5) (t). u, Graphic abstract. Data are presented as mean ± s.e.m. unless otherwise noted; all statistical tests were two-sided unless otherwise noted; and n represents biological replicates unless otherwise noted. Student’s t-test (d (ferric iron of patients), d (free ferrous iron of mice), i–l,n–p,s,t). Mann–Whitney U-test (d (free ferrous iron of patients), d (ferric iron of mice), g,h (mean area)). One-way ANOVA with Bonferroni test (r). One-way ANOVA with Tamhane’s T2 test (q). Two-way ANOVA with Bonferroni test (h (distribution)). Median (25% IQR, 75% IQR; d (free ferrous iron of patients), d (ferric iron of mice), g,h (mean area)). RBCs, red blood cells. Source data
Fig. 6 Senescent macrophages induce ferroptosis of muscle cells through disruption of local iron homeostasis in the quadriceps during OA progression. a, Scheme of proteomic sequencing. b,c, PCA (b) and the heatmap (c) (n = 4). d, The levels of free Fe2+ and Fe3+ in quadriceps of patients with OA and controls (n = 10) and of mice at S12 and D12 (n = 10). e, The top 15 enriched pathways of DEPs. f, Representative enriched sets of DEGs. g,h, Representative TEM images of quadriceps muscles from patients with OA and control subjects (n = 42 control section, from 5 individuals; n = 55 OA section, from 5 individuals) (g) and from mice at S12 and D12 (n = 10 sham, n = 9 DMM) (h). i, Representative flow cytometry profiles of mitochondria and MFI of indicated dyes staining in mitochondria (n = 4 sham, n = 5 DMM). j, Representative images and statistical charts of SDH staining (n = 6 sham, n = 5 DMM). k,l, LPO products level (n = 5) (k) and blots and quantitative results (n = 3) (l). m, Scheme of stimulating myotubes or C2C12 cells with conditioned medium (CM) from macrophages of mice at S12 and D12. n–p, Representative MyHC immunofluorescence staining images and mean diameter (n = 5) (n), blots and quantitative results (n = 3) (o), and MFI of MitoTracker and MitoSOX (n = 5) (p). q,r, MFI of C11 BODIPY 581/591 staining (q) and Helix NP staining (r, n = 5). s,t, Measurement of MFI for the indicated dyes (s) and quantification of LPO levels in indicated mice (n = 5) (t). u, Graphic abstract. Data are presented as mean ± s.e.m. unless otherwise noted; all statistical tests were two-sided unless otherwise noted; and n represents biological replicates unless otherwise noted. Student’s t-test (d (ferric iron of patients), d (free ferrous iron of mice), i–l,n–p,s,t). Mann–Whitney U-test (d (free ferrous iron of patients), d (ferric iron of mice), g,h (mean area)). One-way ANOVA with Bonferroni test (r). One-way ANOVA with Tamhane’s T2 test (q). Two-way ANOVA with Bonferroni test (h (distribution)). Median (25% IQR, 75% IQR; d (free ferrous iron of patients), d (ferric iron of mice), g,h (mean area)). RBCs, red blood cells. Source dataCC BY-NC-ND · PubMed Central
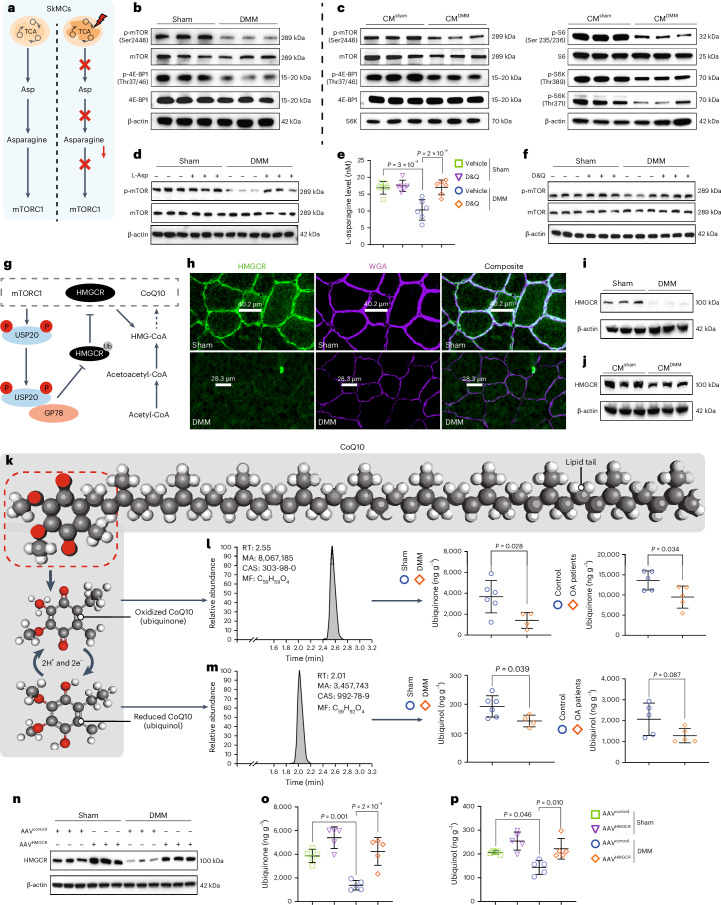
Fig. 7 Repression of the asparagine–mTORC1–HMGCR pathway in SkMCs leads to CoQ10 depletion, thereby contributing to ferroptosis in the quadriceps of OA joints. a, Illustration of crosstalk between mTORC1 and asparagine derived from the tricarboxylic acid (TCA) cycle. b–d, The activity of the mTORC1 signaling pathway is assessed in the quadriceps of mice at S12 and D12 (n = 3) (b), in C2C12 cells stimulated with CMDMM or CMsham (n = 3) (c) and in the quadriceps of mice with or without L-asparagine (L-Asp) supplementation at S12 and D12 (n = 3) (d). e,f, The levels of L-asparagine (n = 6) (e) and the activity of the mTORC1 signaling pathway (n = 3) (f) in the quadriceps of mice with or without administration of D&Q treatment at S12 and D12. g, Illustration of the mTORC1–HMGCR–CoQ10 axis. h, Immunofluorescence staining images. Represented images were selected from sections of quadriceps from mice at S12 and D12 (n = 5 sham, n = 5 DMM). i, Blots and quantitative results (n = 3) of HMGCR in the quadriceps of mice at S12 and D12. j, Blots and quantitative results of HMGCR in C2C12 cells stimulated with CMDMM or CMsham (n = 3). k, Molecular structure diagram depicting CoQ10. l,m, Quantification of ubiquinone (l) and ubiquinol (m) levels in the quadriceps muscle of OA mice and patients with OA using LC–MS analysis (mice, n = 6 sham, n = 4 DMM; patients with OA, n = 5). n, Verifying the delivery efficiency of AAVMHCK7-HMGCR in quadriceps at S12 and D12 by western blotting (n = 3). o,p, The levels of ubiquinone (o) and ubiquinol (p) in the quadriceps of mice with or without AAVMHCK7-HMGCR-mediated gene therapy at S12 and D12 (n = 5). Data are presented as mean ± s.e.m. unless otherwise noted; all statistical tests were two-sided unless otherwise noted; and n represents biological replicates unless otherwise noted. Student’s t-test (l,m). One-way ANOVA with Bonferroni test (e,o,p). RT, retention time; MA, mandatory approval; CAS, Chemical Abstracts Service; MF, molecular formula. Source data
Fig. 7 Repression of the asparagine–mTORC1–HMGCR pathway in SkMCs leads to CoQ10 depletion, thereby contributing to ferroptosis in the quadriceps of OA joints. a, Illustration of crosstalk between mTORC1 and asparagine derived from the tricarboxylic acid (TCA) cycle. b–d, The activity of the mTORC1 signaling pathway is assessed in the quadriceps of mice at S12 and D12 (n = 3) (b), in C2C12 cells stimulated with CMDMM or CMsham (n = 3) (c) and in the quadriceps of mice with or without L-asparagine (L-Asp) supplementation at S12 and D12 (n = 3) (d). e,f, The levels of L-asparagine (n = 6) (e) and the activity of the mTORC1 signaling pathway (n = 3) (f) in the quadriceps of mice with or without administration of D&Q treatment at S12 and D12. g, Illustration of the mTORC1–HMGCR–CoQ10 axis. h, Immunofluorescence staining images. Represented images were selected from sections of quadriceps from mice at S12 and D12 (n = 5 sham, n = 5 DMM). i, Blots and quantitative results (n = 3) of HMGCR in the quadriceps of mice at S12 and D12. j, Blots and quantitative results of HMGCR in C2C12 cells stimulated with CMDMM or CMsham (n = 3). k, Molecular structure diagram depicting CoQ10. l,m, Quantification of ubiquinone (l) and ubiquinol (m) levels in the quadriceps muscle of OA mice and patients with OA using LC–MS analysis (mice, n = 6 sham, n = 4 DMM; patients with OA, n = 5). n, Verifying the delivery efficiency of AAVMHCK7-HMGCR in quadriceps at S12 and D12 by western blotting (n = 3). o,p, The levels of ubiquinone (o) and ubiquinol (p) in the quadriceps of mice with or without AAVMHCK7-HMGCR-mediated gene therapy at S12 and D12 (n = 5). Data are presented as mean ± s.e.m. unless otherwise noted; all statistical tests were two-sided unless otherwise noted; and n represents biological replicates unless otherwise noted. Student’s t-test (l,m). One-way ANOVA with Bonferroni test (e,o,p). RT, retention time; MA, mandatory approval; CAS, Chemical Abstracts Service; MF, molecular formula. Source dataCC BY-NC-ND · PubMed Central
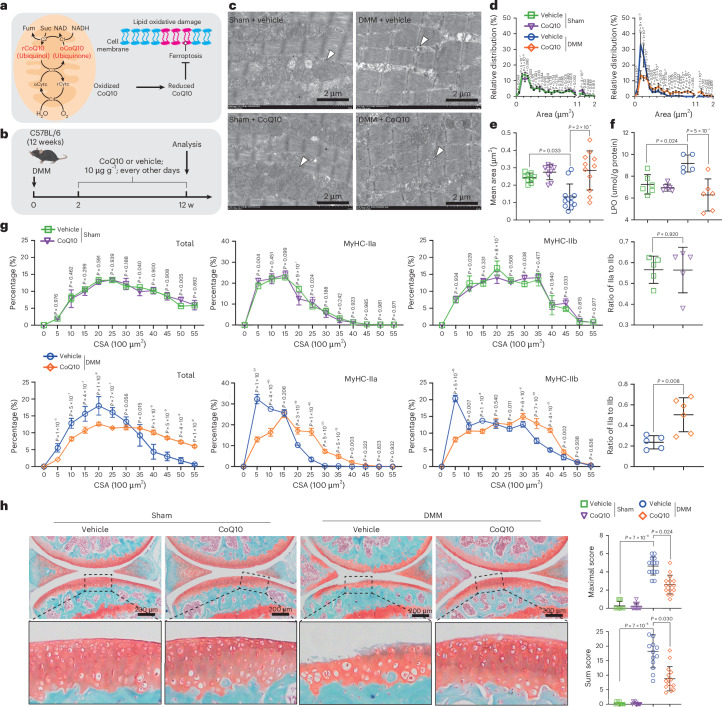
Fig. 8 Systemic supplementation of CoQ10 can enhance quadriceps quality in OA joints of mice and mitigate cartilage damage. a, Illustration of mitochondrial metabolic transformation pathway of CoQ10 and its role in the suppression of ferroptosis. b, Scheme of CoQ10 intervention in DMM-induced OA mice. c–e, Representative TEM images (c), mitochondrial area distribution (d) and mean mitochondrial area (e) of quadriceps from mice with or without CoQ10 intervention (n = 6 sham, n = 12 DMM+vehicle, n = 11 DMM+CoQ10). f,g, The quantification of LPO (n = 6 sham, n = 5 DMM+vehicle, n = 6 DMM+CoQ10) (f) and the distribution and mean CSA analysis of the total, MyHC-IIa and MyHC-IIb myofibers (n = 5 sham, n = 5 DMM+vehicle, n = 6 DMM+CoQ10) (g) in quadriceps of mice with or without CoQ10 intervention. h, Representative Safranine O/Fast Green staining images along OARSI scores of joint cartilage in mice with or without CoQ10 supplementation (n = 11 sham, n = 14 DMM+vehicle, n = 15 DMM+CoQ10). Student’s t-test (g (ratio of IIa to IIb)). Data are presented as mean ± s.e.m. unless otherwise noted; all statistical tests were two-sided unless otherwise noted; and n represents biological replicates unless otherwise noted. One-way ANOVA with Bonferroni test (f). Two-way ANOVA with Bonferroni test (d,g (distribution of CSA)). Kruskal–Wallis test (e,h). Median (25% IQR, 75% IQR; e,h).
Fig. 8 Systemic supplementation of CoQ10 can enhance quadriceps quality in OA joints of mice and mitigate cartilage damage. a, Illustration of mitochondrial metabolic transformation pathway of CoQ10 and its role in the suppression of ferroptosis. b, Scheme of CoQ10 intervention in DMM-induced OA mice. c–e, Representative TEM images (c), mitochondrial area distribution (d) and mean mitochondrial area (e) of quadriceps from mice with or without CoQ10 intervention (n = 6 sham, n = 12 DMM+vehicle, n = 11 DMM+CoQ10). f,g, The quantification of LPO (n = 6 sham, n = 5 DMM+vehicle, n = 6 DMM+CoQ10) (f) and the distribution and mean CSA analysis of the total, MyHC-IIa and MyHC-IIb myofibers (n = 5 sham, n = 5 DMM+vehicle, n = 6 DMM+CoQ10) (g) in quadriceps of mice with or without CoQ10 intervention. h, Representative Safranine O/Fast Green staining images along OARSI scores of joint cartilage in mice with or without CoQ10 supplementation (n = 11 sham, n = 14 DMM+vehicle, n = 15 DMM+CoQ10). Student’s t-test (g (ratio of IIa to IIb)). Data are presented as mean ± s.e.m. unless otherwise noted; all statistical tests were two-sided unless otherwise noted; and n represents biological replicates unless otherwise noted. One-way ANOVA with Bonferroni test (f). Two-way ANOVA with Bonferroni test (d,g (distribution of CSA)). Kruskal–Wallis test (e,h). Median (25% IQR, 75% IQR; e,h).CC BY-NC-ND · PubMed Central
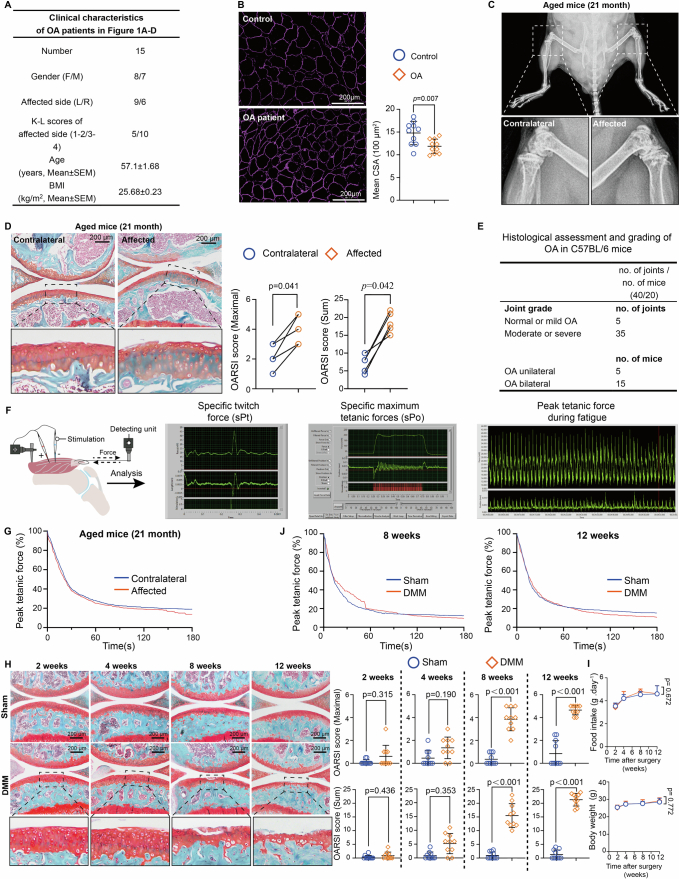
Extended Data Fig. 1 The muscle mass and function of the Quadriceps significantly decline during the progression of OA in the affected joint. (a) Characteristics of volunteer patients with OA in this study. (b) Representative WGA staining and quantitation results of Quadriceps from OA patients or control (n = 10). Scale Bar = 200 μm. (c) X-ray images of aging mice with severe unilateral OA. The contralateral and affected joints are magnified. (d) The representative Safranine O-Fast Green Staining images and OARSI scores of contralateral and affected joints were obtained from mice with spontaneous severe unilateral OA (n = 5). (e) Histological assessment and grading of cartilage degeneration in aged C57BL/6 mice (21 months old). (f) Illustration of force measurements and fatigue analysis. (g) Peak tetanic force of aged mice with severe unilateral OA (n = 5). (h) The representative Safranine O-Fast Green Staining images and OARSI scores of the joints from the mice with DMM or Sham surgery at different time points. (n = 10). (i) Mean food intake and mean body weight of mice at different time points after DMM or Sham surgery. (n = 5). (j) Peak tetanic force of mice after sham and DMM surgery (n = 4). Data are presented as mean±s.e.m. unless otherwise noted, all statistical tests were two-sided unless otherwise noted, and n represented biological replicates unless otherwise noted. Student’s t-test (b). Mann-Whitney U test (h). Wilcoxon signed-rank test (d). Two-way ANOVA (i). median (25% IQR, 75% IQR) (d, h).
Extended Data Fig. 1 The muscle mass and function of the Quadriceps significantly decline during the progression of OA in the affected joint. (a) Characteristics of volunteer patients with OA in this study. (b) Representative WGA staining and quantitation results of Quadriceps from OA patients or control (n = 10). Scale Bar = 200 μm. (c) X-ray images of aging mice with severe unilateral OA. The contralateral and affected joints are magnified. (d) The representative Safranine O-Fast Green Staining images and OARSI scores of contralateral and affected joints were obtained from mice with spontaneous severe unilateral OA (n = 5). (e) Histological assessment and grading of cartilage degeneration in aged C57BL/6 mice (21 months old). (f) Illustration of force measurements and fatigue analysis. (g) Peak tetanic force of aged mice with severe unilateral OA (n = 5). (h) The representative Safranine O-Fast Green Staining images and OARSI scores of the joints from the mice with DMM or Sham surgery at different time points. (n = 10). (i) Mean food intake and mean body weight of mice at different time points after DMM or Sham surgery. (n = 5). (j) Peak tetanic force of mice after sham and DMM surgery (n = 4). Data are presented as mean±s.e.m. unless otherwise noted, all statistical tests were two-sided unless otherwise noted, and n represented biological replicates unless otherwise noted. Student’s t-test (b). Mann-Whitney U test (h). Wilcoxon signed-rank test (d). Two-way ANOVA (i). median (25% IQR, 75% IQR) (d, h).CC BY-NC-ND · PubMed Central
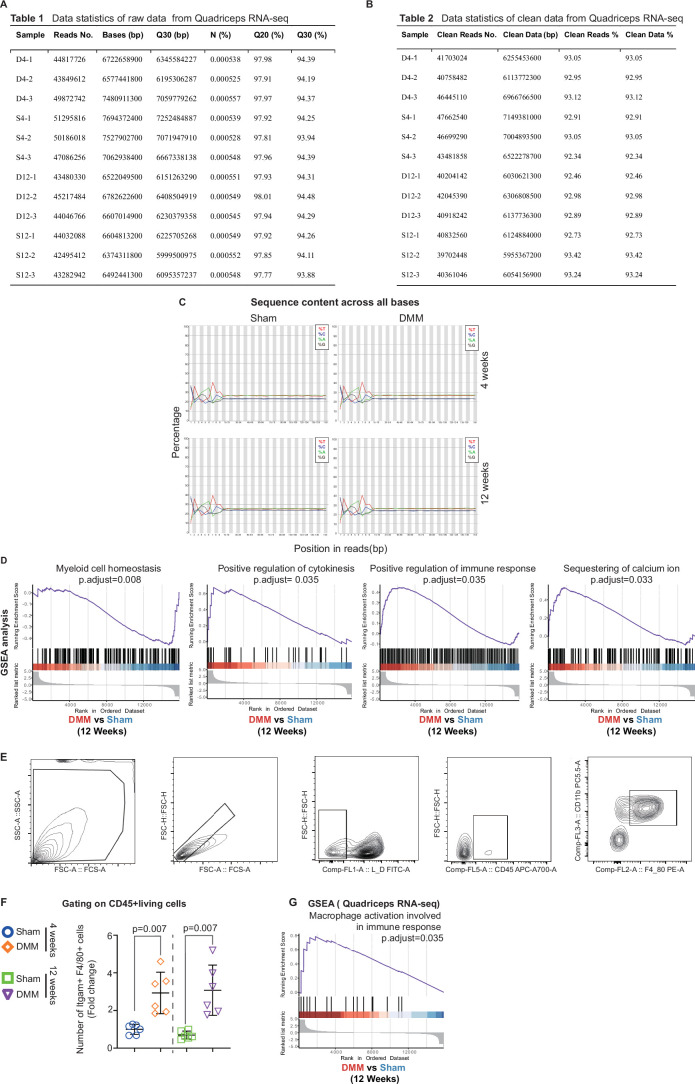
Extended Data Fig. 2 The main pathological characteristic of Quadriceps in OA joints is the presence of chronic inflammation. (a) Data statistics of raw data from Quadriceps RNA-seq. (b) Data statistics of clean data from Quadriceps RNA-seq. (c) Distribution of base content. (d) Representative sets of GSEA for DEGs in Quadriceps between Sham and DMM mice at D12. (e) Strategy of flow cytometry analysis for living Quadriceps CD45 + CD11b + F4/80+ cells. (f) The relative abundance of living CD45 + CD11b + F4/80+ cells in Quadriceps of mice at S4, D4, S12, and D12 (n = 6). (g) Representative sets of GSEA for DEGs in Quadriceps of mice between D12 vs S12. Data are presented as mean±s.e.m. unless otherwise noted, all statistical tests were two-sided unless otherwise noted, and n represented biological replicates unless otherwise noted. Student’s t-test (f).
Extended Data Fig. 2 The main pathological characteristic of Quadriceps in OA joints is the presence of chronic inflammation. (a) Data statistics of raw data from Quadriceps RNA-seq. (b) Data statistics of clean data from Quadriceps RNA-seq. (c) Distribution of base content. (d) Representative sets of GSEA for DEGs in Quadriceps between Sham and DMM mice at D12. (e) Strategy of flow cytometry analysis for living Quadriceps CD45 + CD11b + F4/80+ cells. (f) The relative abundance of living CD45 + CD11b + F4/80+ cells in Quadriceps of mice at S4, D4, S12, and D12 (n = 6). (g) Representative sets of GSEA for DEGs in Quadriceps of mice between D12 vs S12. Data are presented as mean±s.e.m. unless otherwise noted, all statistical tests were two-sided unless otherwise noted, and n represented biological replicates unless otherwise noted. Student’s t-test (f).CC BY-NC-ND · PubMed Central
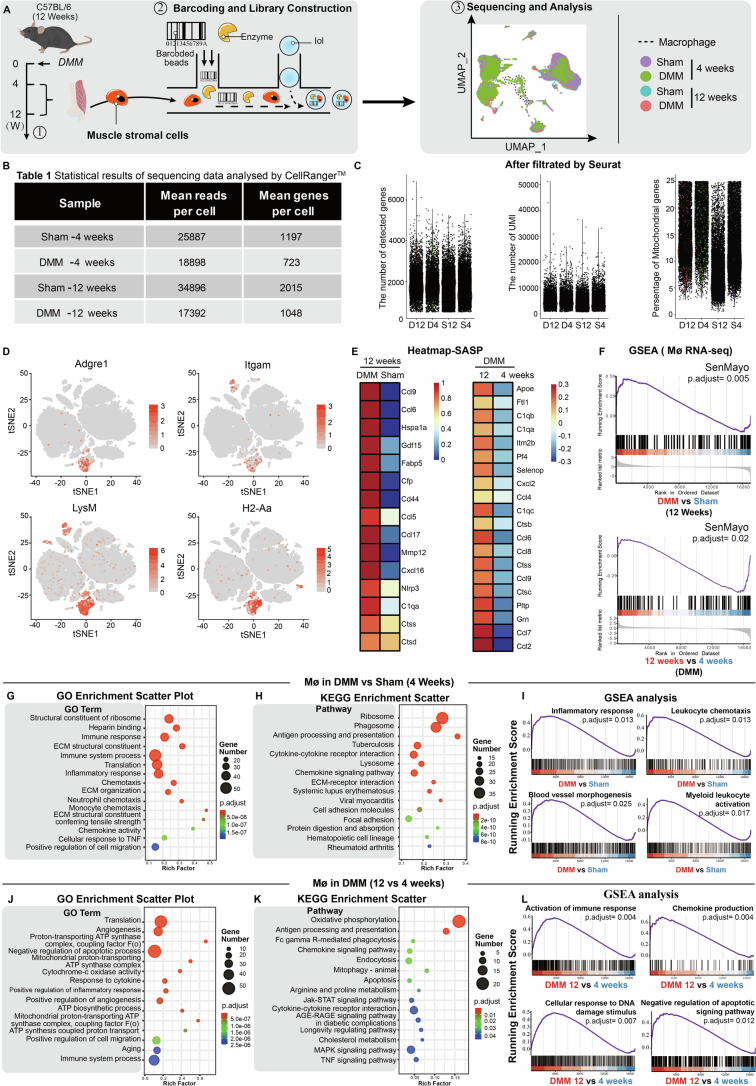
Extended Data Fig. 3 The macrophage population is significantly increased in the Quadriceps of OA joints. (a) Scheme of single-cell RNA sequence (scRNA-seq) of stromal cells driving from Quadriceps. Each tested sample was a pool derived from the Quadriceps of five individual mice. (b) Statistical results of sequencing data analyzed by CellRangerTM. (c) The number of detected genes, the number of UMI, and the percentage of mitochondrial genes in cells after being filtrated by Seurat under a strict quality control threshold. (d) tSNE plot of marker genes for annotated macrophages in sc-RNA seq analysis of Quadriceps stromal cells. (e) TOP 20 significantly up-regulated secreted genes in Quadriceps macrophages of mice between D12 vs S12, and D12 vs D4. (f) GSEA of SenMayo compared to the differential expression genes in Quadriceps macrophages of mice between D12 vs S12, and D12 vs D4. (g-l) Bioinformatic analysis of the results from scRNA-seq. The top enriched terms of GO analysis for the significant DEGs in Quadriceps of mice between (g) D4 vs S4 and (j) D12 vs D4. The top enriched pathways of KEGG analysis for the significant DEGs in Quadriceps of mice between (h) D4 vs S4 and (k) D12 vs D4. The representative gene sets of GSEA for the DEGs in Quadriceps of mice between (i) D4 vs S4 and (l) D12 vs D4.
Extended Data Fig. 3 The macrophage population is significantly increased in the Quadriceps of OA joints. (a) Scheme of single-cell RNA sequence (scRNA-seq) of stromal cells driving from Quadriceps. Each tested sample was a pool derived from the Quadriceps of five individual mice. (b) Statistical results of sequencing data analyzed by CellRangerTM. (c) The number of detected genes, the number of UMI, and the percentage of mitochondrial genes in cells after being filtrated by Seurat under a strict quality control threshold. (d) tSNE plot of marker genes for annotated macrophages in sc-RNA seq analysis of Quadriceps stromal cells. (e) TOP 20 significantly up-regulated secreted genes in Quadriceps macrophages of mice between D12 vs S12, and D12 vs D4. (f) GSEA of SenMayo compared to the differential expression genes in Quadriceps macrophages of mice between D12 vs S12, and D12 vs D4. (g-l) Bioinformatic analysis of the results from scRNA-seq. The top enriched terms of GO analysis for the significant DEGs in Quadriceps of mice between (g) D4 vs S4 and (j) D12 vs D4. The top enriched pathways of KEGG analysis for the significant DEGs in Quadriceps of mice between (h) D4 vs S4 and (k) D12 vs D4. The representative gene sets of GSEA for the DEGs in Quadriceps of mice between (i) D4 vs S4 and (l) D12 vs D4.CC BY-NC-ND · PubMed Central
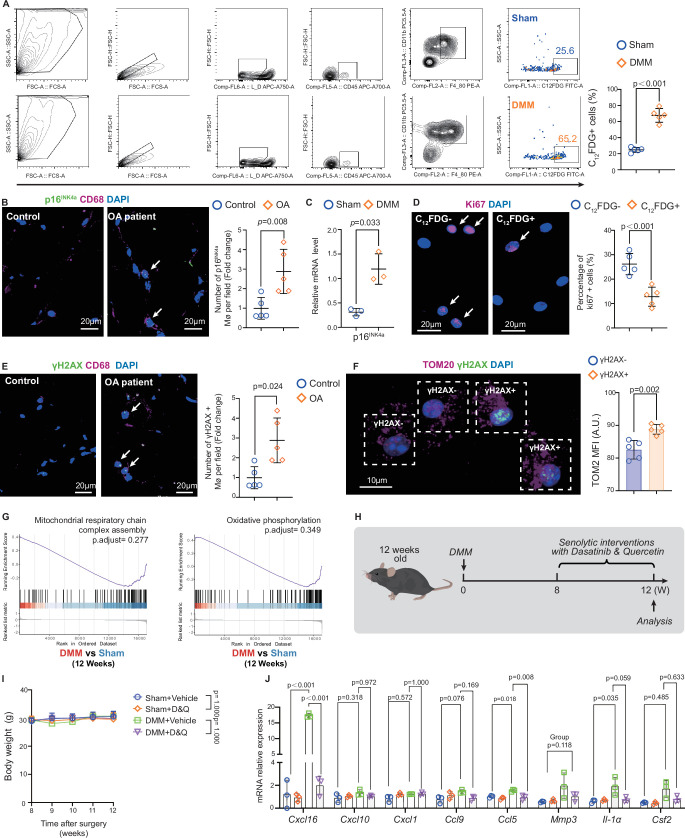
Extended Data Fig. 4 Macrophages in the Quadriceps of OA joints exhibit a senescent phenotype. (a) The strategy, representative profiles, and quantitative results of flow cytometry analysis for living CD45 + CD11b + F4/80 + C12FDG+cells in Quadriceps of mice at S12 and D12 (n = 5). (b) The representative immunofluorescence staining and relative abundance of p16INK4a + CD68+ cells in Quadriceps of OA patents or the control. Scale Bar=20 μm (n = 5). (c) The relative p16INK4a mRNA level of Quadriceps macrophages in mice at S12 and D12 (n = 3). (d) The representative immunofluorescence staining and quantitative results of Ki-67 + cells in C12FDG+/− macrophages sorted from Quadriceps of mice at D12. Scale Bar=20 μm (n = 5). (e) The representative immunofluorescence staining and quantitative results of CD68 + γH2AX+ cells in the quadriceps cross-section of OA patients and the control (n = 5). Scale Bar=20 μm. (f) The representative immunofluorescence staining images and quantitative results of TOM20 in γH2AX+/− macrophages sorted from Quadriceps of mice at D12 (n = 5). Bar=10 μm. (g) Representative enriched sets of GSEA for DEGs in Quadriceps macrophages of mice between D12 vs S12. (h) Experimental scheme of senolytic intervention in mice with Dasatinib and Quercetin (D&Q). (i) Mean body weight of mice with or without D&Q treatment at different time points after DMM or Sham surgery (n = 10). (j) The relative SASP mRNA expression levels in macrophages from Quadriceps of mice with or without D&Q treatment at S12 and D12. (n = 3). Data are presented as mean±s.e.m. unless otherwise noted, all statistical tests were two-sided unless otherwise noted, and n represented biological replicates unless otherwise noted. Student’s t-test (a, c-f). Mann-Whitney U test (B). One-way ANOVA with Bonferroni test (j (Cxcl16), j (Cxcl10), j (Ccl9), j (Ccl5), j (Il-1α)). One-way ANOVA with Tamhane’s T2 test (j (Cxcl1), j (Csf2)). Kruskal-Wallis test (j (Mmp3)). Two-way ANOVA (i). median (25% IQR, 75% IQR) (b, j (Mmp3)).
Extended Data Fig. 4 Macrophages in the Quadriceps of OA joints exhibit a senescent phenotype. (a) The strategy, representative profiles, and quantitative results of flow cytometry analysis for living CD45 + CD11b + F4/80 + C12FDG+cells in Quadriceps of mice at S12 and D12 (n = 5). (b) The representative immunofluorescence staining and relative abundance of p16INK4a + CD68+ cells in Quadriceps of OA patents or the control. Scale Bar=20 μm (n = 5). (c) The relative p16INK4a mRNA level of Quadriceps macrophages in mice at S12 and D12 (n = 3). (d) The representative immunofluorescence staining and quantitative results of Ki-67 + cells in C12FDG+/− macrophages sorted from Quadriceps of mice at D12. Scale Bar=20 μm (n = 5). (e) The representative immunofluorescence staining and quantitative results of CD68 + γH2AX+ cells in the quadriceps cross-section of OA patients and the control (n = 5). Scale Bar=20 μm. (f) The representative immunofluorescence staining images and quantitative results of TOM20 in γH2AX+/− macrophages sorted from Quadriceps of mice at D12 (n = 5). Bar=10 μm. (g) Representative enriched sets of GSEA for DEGs in Quadriceps macrophages of mice between D12 vs S12. (h) Experimental scheme of senolytic intervention in mice with Dasatinib and Quercetin (D&Q). (i) Mean body weight of mice with or without D&Q treatment at different time points after DMM or Sham surgery (n = 10). (j) The relative SASP mRNA expression levels in macrophages from Quadriceps of mice with or without D&Q treatment at S12 and D12. (n = 3). Data are presented as mean±s.e.m. unless otherwise noted, all statistical tests were two-sided unless otherwise noted, and n represented biological replicates unless otherwise noted. Student’s t-test (a, c-f). Mann-Whitney U test (B). One-way ANOVA with Bonferroni test (j (Cxcl16), j (Cxcl10), j (Ccl9), j (Ccl5), j (Il-1α)). One-way ANOVA with Tamhane’s T2 test (j (Cxcl1), j (Csf2)). Kruskal-Wallis test (j (Mmp3)). Two-way ANOVA (i). median (25% IQR, 75% IQR) (b, j (Mmp3)).CC BY-NC-ND · PubMed Central
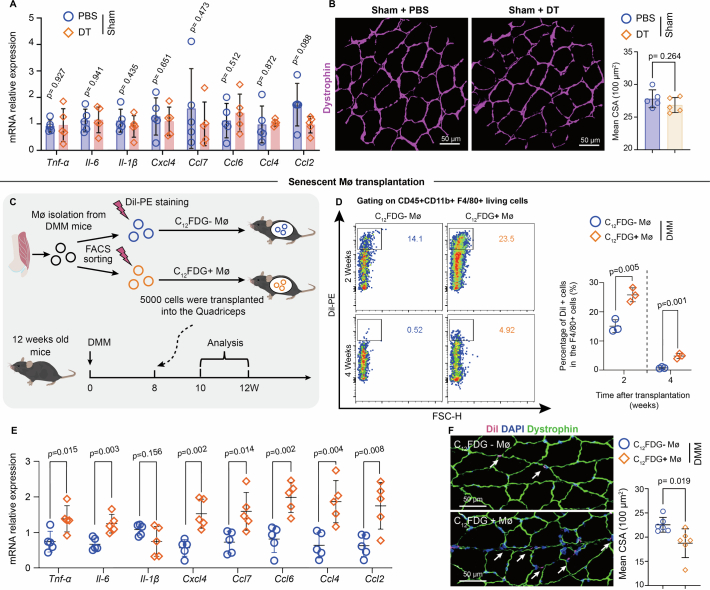
Extended Data Fig. 5 Macrophages with a senescent phenotype disrupt muscle homeostasis in the Quadriceps of OA joints. (a) The relative SASP mRNA expression levels (n = 5). (b) Representative Dystrophin staining images and mean CSA analysis of Quadriceps in mice with or without DT treatment at S12(n = 5). (c) Scheme of C12FDG+/− macrophages transplantation into the Quadriceps of mice in vivo. (d) The flow cytometry profiles and corresponding quantitative results of living C12FDG+/− macrophages at 2- and 4-weeks post-transplantation. (n = 3). (e) The SASP mRNA expression levels, (n = 5), (f) WGA staining and mean CSA analysis of the Quadriceps from C12FDG+/− macrophage recipient mice at D12. (n = 6). Data are presented as mean±s.e.m. unless otherwise noted, all statistical tests were two-sided unless otherwise noted, and n represented biological replicates unless otherwise noted. Scale bar=50 μm. Student’s t-test (a, b, n-p).
Extended Data Fig. 5 Macrophages with a senescent phenotype disrupt muscle homeostasis in the Quadriceps of OA joints. (a) The relative SASP mRNA expression levels (n = 5). (b) Representative Dystrophin staining images and mean CSA analysis of Quadriceps in mice with or without DT treatment at S12(n = 5). (c) Scheme of C12FDG+/− macrophages transplantation into the Quadriceps of mice in vivo. (d) The flow cytometry profiles and corresponding quantitative results of living C12FDG+/− macrophages at 2- and 4-weeks post-transplantation. (n = 3). (e) The SASP mRNA expression levels, (n = 5), (f) WGA staining and mean CSA analysis of the Quadriceps from C12FDG+/− macrophage recipient mice at D12. (n = 6). Data are presented as mean±s.e.m. unless otherwise noted, all statistical tests were two-sided unless otherwise noted, and n represented biological replicates unless otherwise noted. Scale bar=50 μm. Student’s t-test (a, b, n-p).CC BY-NC-ND · PubMed Central
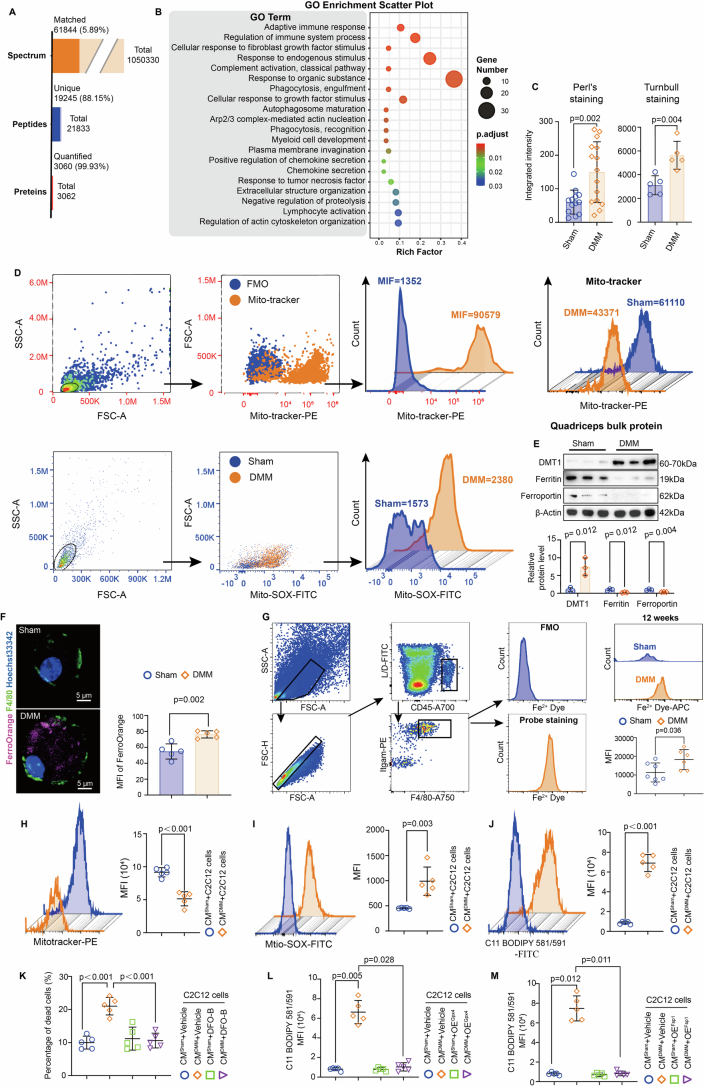
Extended Data Fig. 6 Senescent macrophages induce Ferroptosis of muscle cells through disruption of local iron homeostasis in the Quadriceps during OA progression. (a) Data statistics of raw data from Quadriceps Proteomics analysis. (b) The integrated intensity of Perl’s staining (n = 13 sham, n = 15 DMM) and Turnbull’s staining (n = 5) in the Quadriceps muscle of mice at S12 and D12 was quantified. Perl’s staining was utilized for the measurement of ferric iron content, while Turnbull’s staining was employed to assess ferrous iron content. (c) The top enriched terms of GO analysis for significant DEPs of Quadriceps in mice between D12 vs S12. (d) The strategies and representative profiles of flow cytometry analysis for indicted dyes staining on mitochondria in Quadriceps of mice at S12 and D12. FMO: Fluorescence Minus One. (e) Blots and quantitative results of iron metabolism regulators in quadriceps of mice at S12 and D12 (n = 3). (f) Representative FerroOrange staining images and MFI analysis of macrophages from the Quadriceps of mice at S12 and D12. (n = 5). Scale bar=5 μm. (g) The flow cytometry strategy, representative images, and quantitative results of Fe2+ Dye intensity in macrophage from Quadriceps of mice at S12 and D12, (n = 7 Sham, n = 6 DMM). (h–j) Representative flow cytometry profiles and MFI of indicated dye staining on C2C12 cells stimulating with the conditional medium of macrophages (n = 5). (k) The percentage of dead C2C12 cells under conditional medium stimulation with or without Deferoxamine-B treatment. PI dye staining was employed to identify dead cells (n = 5). (l-m) The MFI of C11 BODIPY 581/591 staining on C2C12 cells under conditional medium stimulation with or without (l) Gpx4 and (m) Fsp1 over-expression. (n = 5). Data are presented as mean±s.e.m. unless otherwise noted, all statistical tests were two-sided unless otherwise noted, and n represented biological replicates unless otherwise noted. Student’s t-test (b, d, e, f, g, h, i, j). One-way ANOVA with Bonferroni test (k). One-way ANOVA with Tamhane’s T2 test (m). Kruskal- Wallis test (l). median (25% IQR, 75% IQR) (l). Source data
Extended Data Fig. 6 Senescent macrophages induce Ferroptosis of muscle cells through disruption of local iron homeostasis in the Quadriceps during OA progression. (a) Data statistics of raw data from Quadriceps Proteomics analysis. (b) The integrated intensity of Perl’s staining (n = 13 sham, n = 15 DMM) and Turnbull’s staining (n = 5) in the Quadriceps muscle of mice at S12 and D12 was quantified. Perl’s staining was utilized for the measurement of ferric iron content, while Turnbull’s staining was employed to assess ferrous iron content. (c) The top enriched terms of GO analysis for significant DEPs of Quadriceps in mice between D12 vs S12. (d) The strategies and representative profiles of flow cytometry analysis for indicted dyes staining on mitochondria in Quadriceps of mice at S12 and D12. FMO: Fluorescence Minus One. (e) Blots and quantitative results of iron metabolism regulators in quadriceps of mice at S12 and D12 (n = 3). (f) Representative FerroOrange staining images and MFI analysis of macrophages from the Quadriceps of mice at S12 and D12. (n = 5). Scale bar=5 μm. (g) The flow cytometry strategy, representative images, and quantitative results of Fe2+ Dye intensity in macrophage from Quadriceps of mice at S12 and D12, (n = 7 Sham, n = 6 DMM). (h–j) Representative flow cytometry profiles and MFI of indicated dye staining on C2C12 cells stimulating with the conditional medium of macrophages (n = 5). (k) The percentage of dead C2C12 cells under conditional medium stimulation with or without Deferoxamine-B treatment. PI dye staining was employed to identify dead cells (n = 5). (l-m) The MFI of C11 BODIPY 581/591 staining on C2C12 cells under conditional medium stimulation with or without (l) Gpx4 and (m) Fsp1 over-expression. (n = 5). Data are presented as mean±s.e.m. unless otherwise noted, all statistical tests were two-sided unless otherwise noted, and n represented biological replicates unless otherwise noted. Student’s t-test (b, d, e, f, g, h, i, j). One-way ANOVA with Bonferroni test (k). One-way ANOVA with Tamhane’s T2 test (m). Kruskal- Wallis test (l). median (25% IQR, 75% IQR) (l). Source dataCC BY-NC-ND · PubMed Central
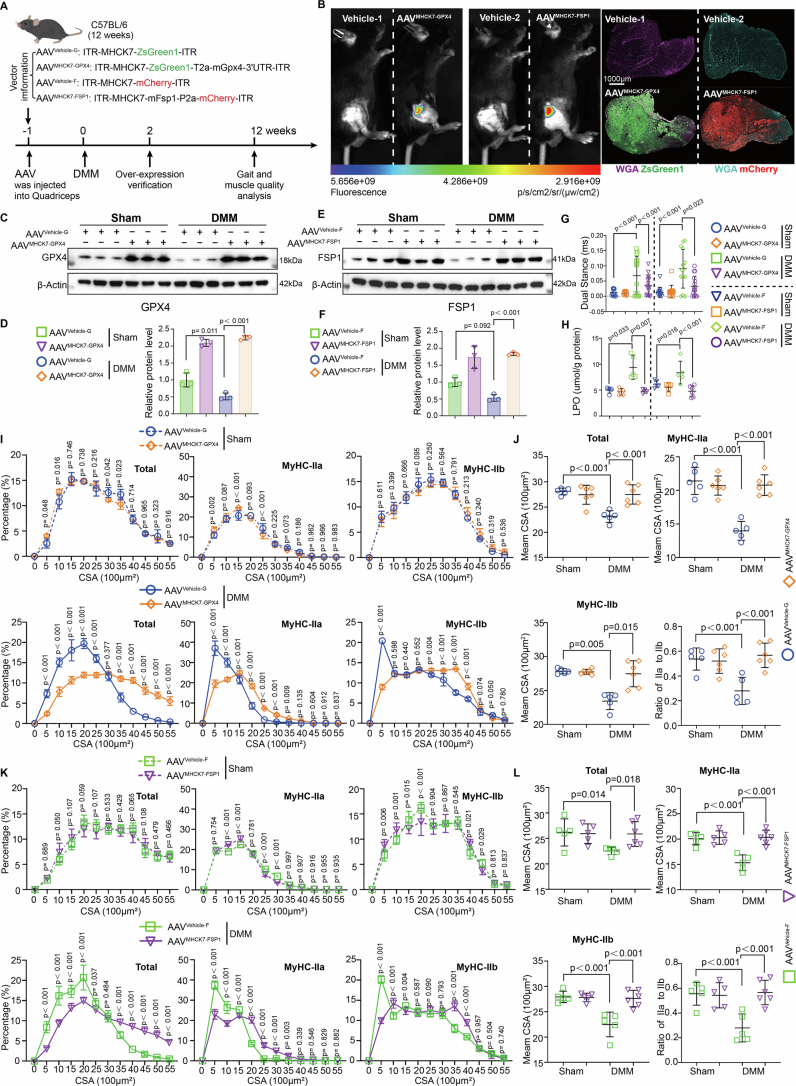
Extended Data Fig. 7 The inhibition of Ferroptosis partially ameliorates the muscle mass and function of Quadriceps in OA joints. (a) Experimental design for targeted delivery of anti-ferroptosis genes into Quadriceps using adeno-associated virus (AAV). (B-F) The assessment of AAV delivery efficiency was performed at 3 weeks post-AAV-mediated gene therapy using (b) an in vivo imaging system and (c–f) western blotting analysis and quantitative results at D12 (n = 3). (g) Data of RH-Dual Stance in mice with or without AAV treatment at S12 and D12. (n = 12 Sham-AAVControl-G, n = 13 Sham-AAVMHCK7-GPX4, n = 12 Sham-AAVControl-F, n = 11 Sham-AAVMHCK7-FSP1, n = 13 DMM-AAVControl-G, n = 15 DMM-AAVMHCK7-GPX4, n = 13 DMM-AAVControl-F, n = 15 DMM-AAVMHCK7-FSP1). (h) Quantification of lipid peroxidation (LPO) levels in the Quadriceps of mice with or without AAV treatment at S12 and D12. (n = 5 Sham, n = 5 DMM-AAVControl-G, n = 4 DMM-AAVMHCK7-GPX4, n = 5 DMM-AAVControl-F, n = 6 DMM-AAVMHCK7-FSP1). (i-l) The distribution and mean CSA of the total, MyHC-IIa, and MyHC-IIb myofibers in the Quadriceps of mice with or without AAV treatment at S12 and D12 (n = 5 Sham-AAVControl-G, n = 6 Sham-AAVControl-G, n = 5 DMM-AAVControl-G, n = 6 DMM-AAVMHCK7-GPX4; n = 5 Sham, n = 5 DMM-AAVControl-F, n = 6 DMM-AAVMHCK7-FSP1). Data are presented as mean±s.e.m. unless otherwise noted, all statistical tests were two-sided unless otherwise noted, and n represented biological replicates unless otherwise noted. One-way ANOVA with Bonferroni test (g, h (FSP1 over-expression), j (Total), j (IIa), j (Ratio of IIa to IIb), l). One-way ANOVA with Tamhane’s T2 test (j (IIb)). Kruskal-Wallis test (h (GPX over-expression)). Two-way ANOVA with Bonferroni test (i, k). median (25% IQR, 75% IQR) (h (GPX over-expression)). Source data
Extended Data Fig. 7 The inhibition of Ferroptosis partially ameliorates the muscle mass and function of Quadriceps in OA joints. (a) Experimental design for targeted delivery of anti-ferroptosis genes into Quadriceps using adeno-associated virus (AAV). (B-F) The assessment of AAV delivery efficiency was performed at 3 weeks post-AAV-mediated gene therapy using (b) an in vivo imaging system and (c–f) western blotting analysis and quantitative results at D12 (n = 3). (g) Data of RH-Dual Stance in mice with or without AAV treatment at S12 and D12. (n = 12 Sham-AAVControl-G, n = 13 Sham-AAVMHCK7-GPX4, n = 12 Sham-AAVControl-F, n = 11 Sham-AAVMHCK7-FSP1, n = 13 DMM-AAVControl-G, n = 15 DMM-AAVMHCK7-GPX4, n = 13 DMM-AAVControl-F, n = 15 DMM-AAVMHCK7-FSP1). (h) Quantification of lipid peroxidation (LPO) levels in the Quadriceps of mice with or without AAV treatment at S12 and D12. (n = 5 Sham, n = 5 DMM-AAVControl-G, n = 4 DMM-AAVMHCK7-GPX4, n = 5 DMM-AAVControl-F, n = 6 DMM-AAVMHCK7-FSP1). (i-l) The distribution and mean CSA of the total, MyHC-IIa, and MyHC-IIb myofibers in the Quadriceps of mice with or without AAV treatment at S12 and D12 (n = 5 Sham-AAVControl-G, n = 6 Sham-AAVControl-G, n = 5 DMM-AAVControl-G, n = 6 DMM-AAVMHCK7-GPX4; n = 5 Sham, n = 5 DMM-AAVControl-F, n = 6 DMM-AAVMHCK7-FSP1). Data are presented as mean±s.e.m. unless otherwise noted, all statistical tests were two-sided unless otherwise noted, and n represented biological replicates unless otherwise noted. One-way ANOVA with Bonferroni test (g, h (FSP1 over-expression), j (Total), j (IIa), j (Ratio of IIa to IIb), l). One-way ANOVA with Tamhane’s T2 test (j (IIb)). Kruskal-Wallis test (h (GPX over-expression)). Two-way ANOVA with Bonferroni test (i, k). median (25% IQR, 75% IQR) (h (GPX over-expression)). Source dataCC BY-NC-ND · PubMed Central
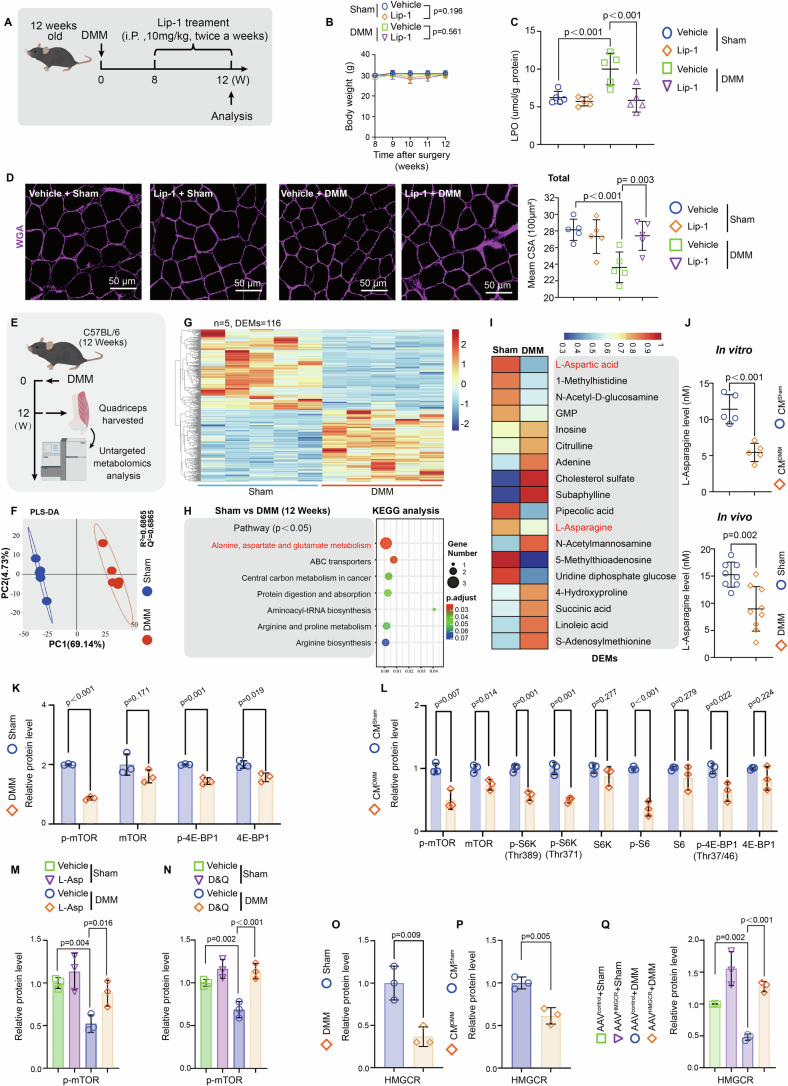
Extended Data Fig. 8 Repression of the Asparagine-mTORC1-HMGCR pathway in SkMCs leads to Coenzyme Q10 depletion, thereby contributing to Ferroptosis in the Quadriceps of OA joints. (a) Scheme of Ferroptosis inhibitor Liproxstatin-1 intervention on mice. (b) Mean body weight of mice with or without Liproxstatin-1 treatment at different time points after DMM or Sham surgery (n = 10). (c) The LPO level of Quadriceps in mice with or without Liproxstatin-1 treatment at S12 and D12. (n = 5). (d) WGA staining and mean CSA analysis of Quadriceps in mice with or without Lip-1 treatment at S12 and D12 (n = 5). Scale bar=50 μm. (e) Scheme of untargeted metabolomics sequencing of Quadriceps. (f) The PLS-DA and (g) the heat map of the differential abundant metabolites (DAMs). (n = 5). (h) The top enriched signaling pathways of significantly differentially regulated metabolomics (DRMs) in the Quadriceps of mice between D12 vs S12. (i) The heat map of significantly different DAMs (p < 0.05). (j) Quantification of L-Asparagine in C2C12 cells stimulated with conditioned culture medium in vitro (n = 5), and in the Quadriceps of mice at S12 and D12 in vivo (n = 9 Sham, n = 8 DMM). (k-l) The quantitative results of western blotting analysis for the members involved in the mTOR single pathway in (k) the Quadriceps of mice at S12 and D12, and in (l) C2C12 cells under conditional medium stimulation. (n = 3). (m-n) The quantification of p-mTOR expression in western blotting analysis for quadriceps of mice with or without (m) L-Asp supplementation, or (n) D&Q intervention at S12 and D12. (n = 3). (o, p) The quantification of HMGCR expression in western blotting analysis for (o) Quadriceps of mice at S12 and D12, for (p) C2C12 cells under stimulation of conditional medium form macrophages, and for (q) Quadriceps of mice with or without HMGCR over-expression at S12 and D12 (n = 3). Data are presented as mean±s.e.m. unless otherwise noted, all statistical tests were two-sided unless otherwise noted, and n represented biological replicates unless otherwise noted. Student’s t-test (j, k, l, o, p). One-way ANOVA with Bonferroni test (b, c, d, m, n, q). Two-way ANOVA (b).
Extended Data Fig. 8 Repression of the Asparagine-mTORC1-HMGCR pathway in SkMCs leads to Coenzyme Q10 depletion, thereby contributing to Ferroptosis in the Quadriceps of OA joints. (a) Scheme of Ferroptosis inhibitor Liproxstatin-1 intervention on mice. (b) Mean body weight of mice with or without Liproxstatin-1 treatment at different time points after DMM or Sham surgery (n = 10). (c) The LPO level of Quadriceps in mice with or without Liproxstatin-1 treatment at S12 and D12. (n = 5). (d) WGA staining and mean CSA analysis of Quadriceps in mice with or without Lip-1 treatment at S12 and D12 (n = 5). Scale bar=50 μm. (e) Scheme of untargeted metabolomics sequencing of Quadriceps. (f) The PLS-DA and (g) the heat map of the differential abundant metabolites (DAMs). (n = 5). (h) The top enriched signaling pathways of significantly differentially regulated metabolomics (DRMs) in the Quadriceps of mice between D12 vs S12. (i) The heat map of significantly different DAMs (p < 0.05). (j) Quantification of L-Asparagine in C2C12 cells stimulated with conditioned culture medium in vitro (n = 5), and in the Quadriceps of mice at S12 and D12 in vivo (n = 9 Sham, n = 8 DMM). (k-l) The quantitative results of western blotting analysis for the members involved in the mTOR single pathway in (k) the Quadriceps of mice at S12 and D12, and in (l) C2C12 cells under conditional medium stimulation. (n = 3). (m-n) The quantification of p-mTOR expression in western blotting analysis for quadriceps of mice with or without (m) L-Asp supplementation, or (n) D&Q intervention at S12 and D12. (n = 3). (o, p) The quantification of HMGCR expression in western blotting analysis for (o) Quadriceps of mice at S12 and D12, for (p) C2C12 cells under stimulation of conditional medium form macrophages, and for (q) Quadriceps of mice with or without HMGCR over-expression at S12 and D12 (n = 3). Data are presented as mean±s.e.m. unless otherwise noted, all statistical tests were two-sided unless otherwise noted, and n represented biological replicates unless otherwise noted. Student’s t-test (j, k, l, o, p). One-way ANOVA with Bonferroni test (b, c, d, m, n, q). Two-way ANOVA (b).CC BY-NC-ND · PubMed Central
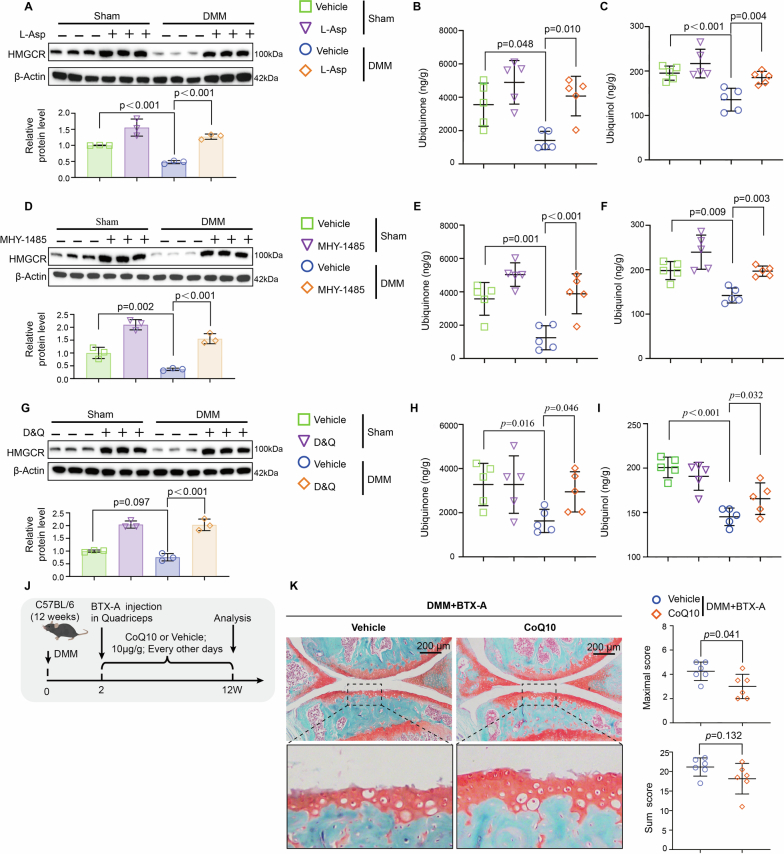
Extended Data Fig. 9 Systemic supplementation of CoQ10 can enhance Quadriceps quality in OA joints of mice and mitigate cartilage damage. (a) The HMGCR expression and quantification results of western blotting analysis (n = 3), and (b) the level of ubiquinone (n = 5), and (c) the quantification of ubiquinol (n = 5) in Quadriceps of mice with or without L-Asp supplementation at S12 and D12. (d) The HMGCR expression and quantification results of western blotting analysis (n = 3), and (e) the level of ubiquinone (n = 5), and (f) the quantification of ubiquinol (n = 5) in Quadriceps of mice with or without MHY-1485 intervention at S12 and D12. (g) The HMGCR expression and quantification results of western blotting analysis (n = 3), and (h) the level of ubiquinone (n = 5), and (i) the quantification of ubiquinol (n = 5) in Quadriceps of mice with or without D&Q intervention at S12 and D12. (j) Scheme of D&Q intervention in DMM mice with or without dysfunction of Quadriceps under BTX-A injection. (k) Representative Safranine O-Fast Green Staining images along with OARSI scores of joint cartilage in DMM mice with or without D&Q intervention and dysfunction of Quadriceps. (n = 6). Data are presented as mean±s.e.m. unless otherwise noted, all statistical tests were two-sided unless otherwise noted, and n represented biological replicates unless otherwise noted. Data are presented as mean±s.e.m. unless otherwise noted, all statistical tests were two-sided unless otherwise noted, and n represented biological replicates unless otherwise noted. Mann-Whitney U test (k). One-way ANOVA (a, c-e, g-i). One-way ANOVA with Tamhane’s T2 test (f). Kruskal-Wallis test (b). median (25% IQR, 75% IQR) (b, k). Source data
Extended Data Fig. 9 Systemic supplementation of CoQ10 can enhance Quadriceps quality in OA joints of mice and mitigate cartilage damage. (a) The HMGCR expression and quantification results of western blotting analysis (n = 3), and (b) the level of ubiquinone (n = 5), and (c) the quantification of ubiquinol (n = 5) in Quadriceps of mice with or without L-Asp supplementation at S12 and D12. (d) The HMGCR expression and quantification results of western blotting analysis (n = 3), and (e) the level of ubiquinone (n = 5), and (f) the quantification of ubiquinol (n = 5) in Quadriceps of mice with or without MHY-1485 intervention at S12 and D12. (g) The HMGCR expression and quantification results of western blotting analysis (n = 3), and (h) the level of ubiquinone (n = 5), and (i) the quantification of ubiquinol (n = 5) in Quadriceps of mice with or without D&Q intervention at S12 and D12. (j) Scheme of D&Q intervention in DMM mice with or without dysfunction of Quadriceps under BTX-A injection. (k) Representative Safranine O-Fast Green Staining images along with OARSI scores of joint cartilage in DMM mice with or without D&Q intervention and dysfunction of Quadriceps. (n = 6). Data are presented as mean±s.e.m. unless otherwise noted, all statistical tests were two-sided unless otherwise noted, and n represented biological replicates unless otherwise noted. Data are presented as mean±s.e.m. unless otherwise noted, all statistical tests were two-sided unless otherwise noted, and n represented biological replicates unless otherwise noted. Mann-Whitney U test (k). One-way ANOVA (a, c-e, g-i). One-way ANOVA with Tamhane’s T2 test (f). Kruskal-Wallis test (b). median (25% IQR, 75% IQR) (b, k). Source dataCC BY-NC-ND · PubMed Central
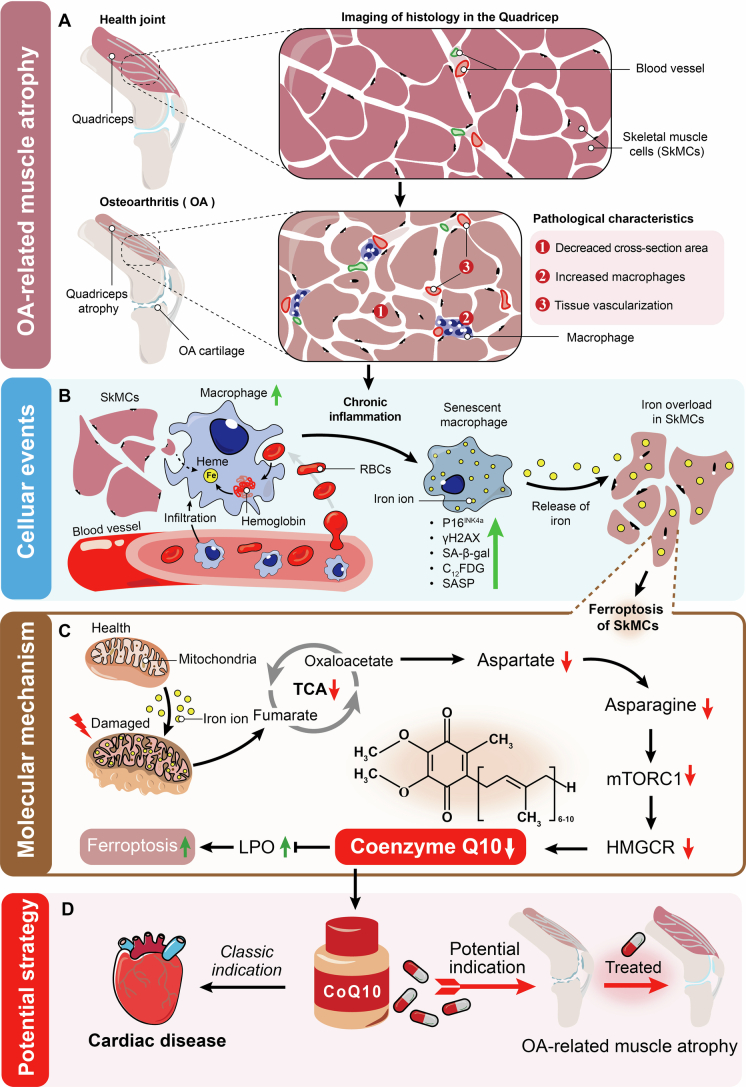
Extended Data Fig. 10 Proposed Model. (a) The muscle atrophy of the Quadriceps around OA joints is commonly accompanied by cartilage degeneration in clinical settings during the progression of OA. The pathological characteristics of Quadriceps muscle atrophy can be summarized as a reduction in CSA, an increase in immune cells, particularly macrophages, and enhanced tissue vascularization. (b) In the chronic inflammatory microenvironment of quadriceps muscle atrophy, macrophages gradually infiltrate skeletal muscle cells (SkMCs) tissues, where they may phagocytose both red blood cells and SkMCs to degrade hemoglobin into heme within the cells. The senescent macrophage exhibits an accumulation of iron ions in the tissue environment and facilitates ferroptosis of SkMCs through iron overload. (c) Mechanistically, iron overload induces mitochondrial damage in SkMCs, leading to a decrease in Asparagine metabolites and subsequent inhibition of the mTORC1-HMGCR signaling pathway, thereby impairing CoQ10 synthesis and ultimately compromising ferroptosis defense systems. (d) CoQ10 has been extensively utilized in the treatment of cardiac diseases due to its myocardial nourishing properties and ability to enhance myocardial function. Based on our findings, systemic supplementation of CoQ10 effectively inhibits ferroptosis in SkMCs within the Quadriceps of OA joints, thereby reducing muscle atrophy and mitigating articular cartilage lesions during OA progression. This perspective offers a potential strategy for addressing OA-related muscle atrophy.
Extended Data Fig. 10 Proposed Model. (a) The muscle atrophy of the Quadriceps around OA joints is commonly accompanied by cartilage degeneration in clinical settings during the progression of OA. The pathological characteristics of Quadriceps muscle atrophy can be summarized as a reduction in CSA, an increase in immune cells, particularly macrophages, and enhanced tissue vascularization. (b) In the chronic inflammatory microenvironment of quadriceps muscle atrophy, macrophages gradually infiltrate skeletal muscle cells (SkMCs) tissues, where they may phagocytose both red blood cells and SkMCs to degrade hemoglobin into heme within the cells. The senescent macrophage exhibits an accumulation of iron ions in the tissue environment and facilitates ferroptosis of SkMCs through iron overload. (c) Mechanistically, iron overload induces mitochondrial damage in SkMCs, leading to a decrease in Asparagine metabolites and subsequent inhibition of the mTORC1-HMGCR signaling pathway, thereby impairing CoQ10 synthesis and ultimately compromising ferroptosis defense systems. (d) CoQ10 has been extensively utilized in the treatment of cardiac diseases due to its myocardial nourishing properties and ability to enhance myocardial function. Based on our findings, systemic supplementation of CoQ10 effectively inhibits ferroptosis in SkMCs within the Quadriceps of OA joints, thereby reducing muscle atrophy and mitigating articular cartilage lesions during OA progression. This perspective offers a potential strategy for addressing OA-related muscle atrophy.CC BY-NC-ND · PubMed Central

Verification

Claims the paper makes

The claims and statistics of this paper haven’t been checked yet.

Run the check — free, no account needed. It reads the open-access text and checks the sources it cites.

A few free checks a day · papers already verified open instantly · results are public

Claims other papers make about this one

Each is checked against this paper’s own text: does it say what the citing paper says it does?

Self-check

Percentages, sums and reported differences re-computed from the paper’s own numbers.

The self-check needs the paper’s full text.

Citations

Cites

Research works printed but not linked: 58

  1. Katz, J. N., Arant, K. R. & Loeser, R. F. Diagnosis and treatment of hip and knee osteoarthritis: a review. JAMA 325, 568–578 (2021). · DOI
  2. Reid, K. F. et al. Muscle power is an independent determinant of pain and quality of life in knee osteoarthritis. Arthritis Rheumatol. 67, 3166–3173 (2015). · DOI
  3. Pigeolet, M., Jayaram, A., Park, K. B. & Meara, J. G. Osteoarthritis in 2020 and beyond. Lancet 397, 1059–1060 (2021). · DOI
  4. Oiestad, B. E., Juhl, C. B., Culvenor, A. G., Berg, B. & Thorlund, J. B. Knee extensor muscle weakness is a risk factor for the development of knee osteoarthritis: an updated systematic review and meta-analysis including 46 819 men and women. Br. J. Sports Med. 56, 349–355 (2022). · DOI
  5. He, S. & Sharpless, N. E. Senescence in health and disease. Cell 169, 1000–1011 (2017). · DOI · Paper page
  6. Kedlian, V. R. et al. Human skeletal muscle aging atlas. Nat. Aging 4, 727–744 (2024). · DOI · Paper page
  7. Lai, Y. et al. Multimodal cell atlas of the ageing human skeletal muscle. Nature 629, 154–164 (2024). · DOI
  8. Nolt, G. L. et al. Inhibition of p53–MDM2 binding reduces senescent cell abundance and improves the adaptive responses of skeletal muscle from aged mice. Geroscience 46, 2153–2176 (2024). · DOI
  9. Liu, L. et al. Reduction of senescent fibro-adipogenic progenitors in progeria-aged muscle by senolytics rescues the function of muscle stem cells. J. Cachexia Sarcopenia Muscle 13, 3137–3148 (2022). · DOI
  10. Alves, F. M., Ayton, S., Bush, A. I., Lynch, G. S. & Koopman, R. Age-related changes in skeletal muscle iron homeostasis. J Gerontol. A 78, 16–24 (2023). · DOI
  11. Ding, H. et al. Transferrin receptor 1 ablation in satellite cells impedes skeletal muscle regeneration through activation of ferroptosis. J. Cachexia Sarcopenia Muscle 12, 746–768 (2021). · DOI
  12. Wang, D. et al. LCN2 secreted by tissue-infiltrating neutrophils induces the ferroptosis and wasting of adipose and muscle tissues in lung cancer cachexia. J. Hematol. Oncol. 16, 30 (2023). · DOI
  13. Martin, S. D. et al. Class IIa HDACs inhibit cell death pathways and protect muscle integrity in response to lipotoxicity. Cell Death Dis. 14, 787 (2023). · DOI · Paper page
  14. Bersuker, K. et al. The CoQ oxidoreductase FSP1 acts parallel to GPX4 to inhibit ferroptosis. Nature 575, 688–692 (2019). · DOI · Paper page
  15. Doll, S. et al. FSP1 is a glutathione-independent ferroptosis suppressor. Nature 575, 693–698 (2019). · DOI · Paper page
  16. Deshwal, S. et al. Mitochondria regulate intracellular coenzyme Q transport and ferroptotic resistance via STARD7. Nat. Cell Biol. 25, 246–257 (2023).
  17. Sacconi, S. et al. Coenzyme Q10 is frequently reduced in muscle of patients with mitochondrial myopathy. Neuromuscul. Disord. 20, 44–48 (2010). · DOI
  18. Chang, P. S., Yen, C. H., Huang, Y. Y., Chiu, C. J. & Lin, P. T. Associations between coenzyme Q10 status, oxidative stress, and muscle strength and endurance in patients with osteoarthritis. Antioxidants 9, 1275 (2020). · DOI
  19. Liu, M. et al. Mapping the causal associations of cytokines with sarcopenia and aging traits: evidence from bidirectional Mendelian randomization. J. Cachexia Sarcopenia Muscle 15, 1121–1133 (2024). · DOI
  20. Dimri, G. P. et al. A biomarker that identifies senescent human cells in culture and in aging skin in vivo. Proc. Natl Acad. Sci. USA 92, 9363–9367 (1995). · DOI · Paper page
  21. Debacq-Chainiaux, F., Erusalimsky, J. D., Campisi, J. & Toussaint, O. Protocols to detect senescence-associated beta-galactosidase (SA-βgal) activity, a biomarker of senescent cells in culture and in vivo. Nat. Protoc. 4, 1798–1806 (2009). · DOI · Paper page
  22. Bancaro, N. et al. Apolipoprotein E induces pathogenic senescent-like myeloid cells in prostate cancer. Cancer Cell 41, 602–619 e611 (2023). · DOI
  23. Mas-Bargues, C., Borras, C. & Vina, J. Bcl-xL as a modulator of senescence and aging. Int. J. Mol. Sci. 22, 1527 (2021). · DOI
  24. Alves, F. M. et al. Iron accumulation in skeletal muscles of old mice is associated with impaired regeneration after ischaemia-reperfusion damage. J. Cachexia Sarcopenia Muscle 12, 476–492 (2021). · DOI
  25. Humar, R., Schaer, D. J. & Vallelian, F. Erythrophagocytes in hemolytic anemia, wound healing, and cancer. Trends Mol. Med. 28, 906–915 (2022). · DOI
  26. Baker, J. M. et al. Red blood cell-derived iron alters macrophage function in COPD. Biomedicines 9, 1939 (2021). · DOI
  27. Corna, G. et al. The repair of skeletal muscle requires iron recycling through macrophage ferroportin. J. Immunol. 197, 1914–1925 (2016). · DOI · Paper page
  28. Krall, A. S. et al. Asparagine couples mitochondrial respiration to ATF4 activity and tumor growth. Cell Metab. 33, 1013–1026 (2021). · DOI
  29. Xu, Y. et al. Asparagine reinforces mTORC1 signaling to boost thermogenesis and glycolysis in adipose tissues. EMBO J. 40, e108069 (2021). · DOI
  30. Bodine, S. C. The role of mTORC1 in the regulation of skeletal muscle mass. Fac. Rev. 11, 32 (2022). · DOI
  31. Lu, X. Y. et al. Feeding induces cholesterol biosynthesis via the mTORC1–USP20–HMGCR axis. Nature 588, 479–484 (2020). · DOI
  32. Kurashige, T. Anti-HMGCR myopathy: clinical and histopathological features, and prognosis. Curr. Opin. Rheumatol. 33, 554–562 (2021). · DOI
  33. Prieto, L. I. et al. Senescent alveolar macrophages promote early-stage lung tumorigenesis. Cancer Cell 41, 1261–1275 (2023). · DOI · Paper page
  34. Sene, A. et al. Impaired cholesterol efflux in senescent macrophages promotes age-related macular degeneration. Cell Metab. 17, 549–561 (2013). · DOI · Paper page
  35. Minhas, P. S. et al. Restoring metabolism of myeloid cells reverses cognitive decline in ageing. Nature 590, 122–128 (2021). · DOI · Paper page
  36. Liu, L. et al. Senolytic elimination of senescent macrophages restores muscle stem cell function in severely dystrophic muscle. Aging 14, 7650–7661 (2022). · DOI
  37. Tonge, D. P., Bardsley, R. G., Parr, T., Maciewicz, R. A. & Jones, S. W. Evidence of changes to skeletal muscle contractile properties during the initiation of disease in the ageing guinea pig model of osteoarthritis. Longev. Healthspan 2, 15 (2013). · DOI
  38. Gammella, E., Buratti, P., Cairo, G. & Recalcati, S. Macrophages: central regulators of iron balance. Metallomics 6, 1336–1345 (2014). · DOI
  39. Back, M. Macrophage erythrophagocytosis and iron-handling in the resolution of inflammation. Am. J. Hematol. 98, 998–999 (2023). · DOI
  40. Ikeda, Y. et al. Iron accumulation causes impaired myogenesis correlated with MAPK signaling pathway inhibition by oxidative stress. FASEB J. 33, 9551–9564 (2019). · DOI
  41. Altun, M. et al. Iron load and redox stress in skeletal muscle of aged rats. Muscle Nerve 36, 223–233 (2007). · DOI
  42. Zhao, H. et al. Destabilizing heterochromatin by APOE mediates senescence. Nat. Aging 2, 303–316 (2022). · DOI
  43. Raihan, O. et al. SFRS11 loss leads to aging-associated cognitive decline by modulating LRP8 and ApoE. Cell Rep. 31, 107713 (2020). · DOI
  44. Belaidi, A. A. et al. Apolipoprotein E potently inhibits ferroptosis by blocking ferritinophagy. Mol. Psychiatry 29, 211–220 (2024). · DOI
  45. Alborzinia, H. et al. LRP8-mediated selenocysteine uptake is a targetable vulnerability in MYCN-amplified neuroblastoma. EMBO Mol. Med. 15, e18014 (2023). · DOI · Paper page
  46. Thompson, P. D., Panza, G., Zaleski, A. & Taylor, B. Statin-associated side effects. J. Am. Coll. Cardiol. 67, 2395–2410 (2016). · DOI
  47. Yogev, Y. et al. Limb girdle muscular disease caused by HMGCR mutation and statin myopathy treatable with mevalonolactone. Proc. Natl Acad. Sci. USA 120, e2217831120 (2023). · DOI
  48. Marcoff, L. & Thompson, P. D. The role of coenzyme Q10 in statin-associated myopathy: a systematic review. J. Am. Coll. Cardiol. 49, 2231–2237 (2007). · DOI · Paper page
  49. Stefely, J. A. & Pagliarini, D. J. Biochemistry of mitochondrial coenzyme Q biosynthesis. Trends Biochem. Sci. 42, 824–843 (2017). · DOI
  50. Fernandez-Del-Rio, L. & Clarke, C. F. Coenzyme Q biosynthesis: an update on the origins of the benzenoid ring and discovery of new ring precursors. Metabolites 11, 385 (2021). · DOI
  51. Li, Y. et al. 7-Dehydrocholesterol dictates ferroptosis sensitivity. Nature 626, 411–418 (2024). · DOI
  52. Yamada, N. et al. Inhibition of 7-dehydrocholesterol reductase prevents hepatic ferroptosis under an active state of sterol synthesis. Nat. Commun. 15, 2195 (2024). · DOI
  53. Freitas, F. P. et al. 7-Dehydrocholesterol is an endogenous suppressor of ferroptosis. Nature 626, 401–410 (2024). · DOI
  54. Kellgren, J. H. & Lawrence, J. S. Radiological assessment of osteo-arthrosis. Ann. Rheum. Dis. 16, 494–502 (1957). · DOI
  55. Riddle, D. L. & Stratford, P. W. Unilateral vs bilateral symptomatic knee osteoarthritis: associations between pain intensity and function. Rheumatology 52, 2229–2237 (2013). · DOI
  56. Baczynska, A. M. et al. Human vastus lateralis skeletal muscle biopsy using the Weil–Blakesley conchotome. J. Vis. Exp. e53075 (2016). · DOI
  57. Rolke, R. et al. Quantitative sensory testing: a comprehensive protocol for clinical trials. Eur. J. Pain 10, 77–88 (2006). · DOI
  58. Smith, L. R. & Barton, E. R. SMASH—semi-automatic muscle analysis using segmentation of histology: a MATLAB application. Skelet. Muscle 4, 21 (2014). · DOI

Cited by

Sorted by citations

See all 82

Metadata

Authors
Xiang, W., Zhang, T., Li, B., Li, S., Zhang, B., Fang, S., Chen, L., Gong, Y., Huang, B., Feng, D., Wu, J., Yuan, J., Wu, Y., Yan, X., Jin, R., Zhang, X., Fang, X., Lian, J., Chen, L., Zhou, S., & Ni, Z.
Venue
Nature Aging
Published
2025-06-27
Volume
5
Issue
7
Pages
1295-1316
ISSN
2662-8465
Cited by
82
References
10
Language
en

About these checks

Registry, retraction, Cites and statistics results are computed, not judged, with one exception: a printed reference that no index lists is read once by a model before it counts as a citation error. Claims are extracted by a model and kept only when their quote appears verbatim in the text; each cited source is then checked, with a model’s help, for whether it says what the claim relies on. Those verdicts can be wrong — read the claim’s quote and the cited source before relying on one.

Statistics and arithmetic are recomputed, not judged.

Confidence bands are shown only for fields calibrated on our annotated test set. None is calibrated yet, so no band is shown.

What counts as a claim ›How we measure confidence ›How we check this ›

Are you an author, or do you see a problem with this page? Request a review