

The DOI matches its Crossref record; 57 of the 58 references it cites were found in a registry or an index; 15 of the 26 sources its claims cite were checked for support.
Integrated algorithm combining plasma biomarkers and cognitive assessments accurately predicts brain β-amyloid pathology
Open accessAbstract
BACKGROUND: Accurate prediction of cerebral amyloidosis with easily available indicators is urgently needed for diagnosis and treatment of Alzheimer's disease (AD). METHODS: We examined plasma Aβ42, Aβ40, T-tau, P-tau181, and NfL, with APOE genotypes, cognitive test scores and key demographics in a large Chinese cohort (N = 609, aged 40 to 84 years) covering full AD spectrum. Data-driven integrated computational models were developed to predict brain β-amyloid (Aβ) pathology. RESULTS: Our computational models accurately predict brain Aβ positivity (area under the ROC curves (AUC) = 0.94). The results are validated in Alzheimer's Disease Neuroimaging Initiative (ADNI) cohort. Particularly, the models have the highest prediction power (AUC = 0.97) in mild cognitive impairment (MCI) participants. Three levels of models are designed with different accuracies and complexities. The model which only consists of plasma biomarkers can predict Aβ positivity in amnestic MCI (aMCI) patients with AUC = 0.89. Generally the models perform better in participants without comorbidities or family histories. CONCLUSIONS: The innovative integrated models provide opportunity to assess Aβ pathology in a non-invasive and cost-effective way, which might facilitate AD-drug development, early screening, clinical diagnosis and prognosis evaluation.
Overview
CoChat Summary
## TL;DR
This study built data-driven decision-tree models combining plasma biomarkers, APOE genotype, cognitive tests, and demographics to predict brain β-amyloid (Aβ) pathology in a Chinese cohort of 609 participants. The best performance was in MCI, especially aMCI, and the models were validated in an independent ADNI cohort.
## Key findings
- In the full Chinese cohort (N = 609), the integrated model predicted brain Aβ positivity with an AUC of 0.94; the simplified “best model” had an AUC of 0.83, and the 3-step refined model had an AUC of 0.71.
- Performance was highest in the MCI subgroup, with an AUC of 0.93 for the best model; subgroup AUCs were 0.82 for CN, 0.82 for SCD, and 0.86 for dementia.
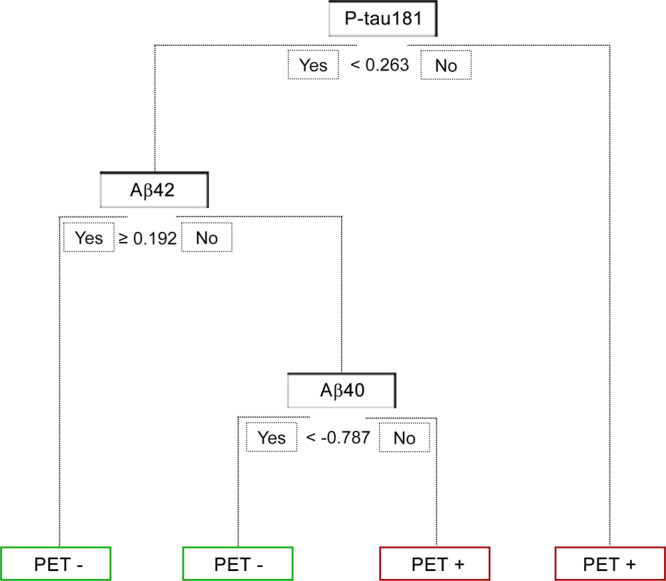
- In aMCI, the model performed especially well: AUCs were 0.97 (full), 0.96 (best), and 0.89 (refined); the refined aMCI model used only plasma P-tau181, Aβ40, and Aβ42.
- In the ADNI validation cohort (284 cases), performance remained similar: AUCs of 0.96 (full), 0.88 (best), and 0.75 (refined) in the whole dataset, with 0.95/0.93/0.87 in MCI.
## Methods
- Consecutive participants were enrolled from Shanghai Sixth People’s Hospital; 609 individuals aged 40 to 84/85 years with blood tests, MRI, and 18F-florbetapir PET within 3 months of blood sampling were included.
- The study measured plasma Aβ42, Aβ40, T-tau, P-tau181, and NfL, plus APOE genotypes, cognitive screening scores (MMSE, MoCA-BC, ACE-III-CV) and neuropsychological tests; diagnoses included CN, SCD, MCI (including aMCI), Alzheimer’s disease dementia, and non-Alzheimer’s disease dementia.
- The main analysis used data-driven recursive partitioning/decision tree models with cross-validation, model simplification by variable reduction, and AUC/ROC evaluation; models were also validated in the ADNI cohort (284 cases).
## Limitations
- The paper explicitly states that, although the sample was the largest in China to their knowledge, it was smaller than some American and European studies such as ADNI and BioFINDER.
- Evident from the text: the Chinese cohort was from one hospital in Shanghai, so generalizability beyond this setting may be limited.
- Evident from the text: not all participants completed all neuropsychological assessments, which the authors note when justifying decision-tree methods’ tolerance for missing values.
Model-written summary. Check it against the paper before relying on it.
Integrity signals
Registry
Cites
Statistics
Figures




Verification
Claims the paper makes
6 Valid · 1 Not valid · 8 Not checked · 36 Own results and interpretations
The cited sources support only part of this claim — read each source’s verdict below.
In the paper
“Among the existing plasma biomarkers, P-tau has shown the highest predictive accuracy for Aβ positivity11,12.”
§ Integrated algorithm combining plasma biomarkers and cognitive assessments accurately predicts brain β-amyloid pathology > Introduction
What the sources say
- Partly supportedcites [11] Palmqvist, S. et al. Prediction of future Alzheimer’s disease dementia using plasma phospho-tau combined with other accessible measures. Nat. Med. 27, 1034–1042 (2021). sourceExperimental — accuracy not yet measured
The Discussion (page unavailable) says plasma P-tau reflects Aβ pathology, supporting an association with Aβ status. But the paper’s reported prediction accuracies concern progression to Alzheimer’s dementia, not Aβ positivity; it does not establish that P-tau has the highest accuracy among plasma biomarkers for predicting Aβ positivity. (LLM, conf=0.84)
- Partly supportedcites [12] Karikari, T. K. et al. Blood phosphorylated tau 181 as a biomarker for Alzheimer’s disease: a diagnostic performance and prediction modelling study using data from four prospective cohorts. Lancet Neurol. 19, 422–433 (2020). sourceExperimental — accuracy not yet measured
The Findings (page not provided) report that plasma p-tau181 outperformed the other plasma biomarkers tested in predicting Aβ PET positivity. The claim extends that comparison to all existing plasma biomarkers, whereas the Discussion (page not provided) describes its performance as comparable to high-performance mass spectrometry-based plasma Aβ assays. (LLM, conf=0.86)
plainstates an association- Asserted: passes — The authors put it forward as true.
- Checkable: passes — It can be checked against evidence.
- Load-bearing: passes — The paper’s conclusions depend on it.
- Based: passes — The paper gives a reason why it holds.
- Partly supported
The cited sources support only part of this claim — read each source’s verdict below.
In the paper
“Previous research attempted to develop algorithms combining multiple factors and showed better and more robust performance in predicting Aβ positivity of Alzheimer’s disease.”
§ Integrated algorithm combining plasma biomarkers and cognitive assessments accurately predicts brain β-amyloid pathology > Introduction
What the sources say
- Partly supportedcites [11] Palmqvist, S. et al. Prediction of future Alzheimer’s disease dementia using plasma phospho-tau combined with other accessible measures. Nat. Med. 27, 1034–1042 (2021). sourceExperimental — accuracy not yet measured
The Discussion reports that an algorithm combining plasma P-tau, cognitive measures and APOE genotype performed robustly across two cohorts. But its predicted outcome was progression to Alzheimer’s disease dementia, not Aβ positivity; the Cross-validation section likewise describes the algorithm as estimating dementia risk within four years. Aβ-related measures appear as predictors or proxies, not as the outcome claimed. (LLM, conf=0.88)
- Supportedcites [13] Palmqvist, S. et al. Accurate risk estimation of beta-amyloid positivity to identify prodromal Alzheimer’s disease: Cross-validation study of practical algorithms. Alzheimers Dement. 15, 194–204 (2019). source
The Discussion (page not available) says the models combined age, APOE genotype, and cognitive testing, achieved AUCs of 0.81–0.83, and performed similarly in an independent validation population. It also reports lower AUCs for a previous approach and says validation across the independent population and eight subgroups confirmed the models’ robustness. (LLM, conf=0.89)
- Supportedcites [14] Janelidze, S. et al. Detecting amyloid positivity in early Alzheimer’s disease using combinations of plasma Abeta42/Abeta40 and p-tau. Alzheimers Dement. 18, 283–293 (2022). source
The cited paper is itself prior research that built combination algorithms for Aβ positivity: the Discussion states 'this is the first study to demonstrate in CU participants that the combination of Aβ42/Aβ40 and plasma p-tau217 improved discriminative accuracy with AUCs reaching 0.83 to 0.86 in the two independent cohorts,' against single-biomarker AUCs of 0.79 (Aβ42/Aβ40) and 0.73–0.81 (p-tau217). Robustness is evidenced by replication across BioFINDER-1 and BioFINDER-2 and consistency with CSF Aβ42/Aβ40 and Aβ-PET as outcomes (Sections 3.6 and 4), and the models were implemented as a predictive application (Section 3.5). The bounding qualifier is that the AUC gain over a single marker was shown in cognitively unimpaired participants, whereas in MCI the combination mainly improved model fit (AIC) rather than AUC (Abstract, Sections 3.3.2/4). (LLM, conf=0.82)
boostedstates an association- Asserted: passes — The authors put it forward as true.
- Checkable: passes — It can be checked against evidence.
- Load-bearing: passes — The paper’s conclusions depend on it.
- Based: passes — The paper gives a reason why it holds.
- Partly supported
The cited sources that could be checked couldn’t confirm or dispute this claim.
In the paper
“Most anti-Aβ drugs showed the best efficacy on Aβ-positive MCI patients in clinical trials and real-world studies52.”
§ Integrated algorithm combining plasma biomarkers and cognitive assessments accurately predicts brain β-amyloid pathology > Discussion
What the sources say
- Could not verifycites [52] Petersen, R. C. et al. Practice guideline update summary: Mild cognitive impairment: Report of the Guideline Development, Dissemination, and Implementation Subcommittee of the American Academy of Neurology. Neurology 90, 126–135 (2018). sourceExperimental — accuracy not yet measured
The pharmacologic-treatment table and Recommendations discuss MCI treatments but do not assess anti-Aβ drugs or compare outcomes in Aβ-positive patients. The Suggestions for future research call for biomarker-defined treatment studies; our copy does not report the claimed efficacy in clinical trials or real-world studies. No page numbers are provided in the indexed passages. (LLM, conf=0.76)
plainstates an association- Asserted: passes — The authors put it forward as true.
- Checkable: passes — It can be checked against evidence.
- Load-bearing: passes — The paper’s conclusions depend on it.
- Based: passes — The paper gives a reason why it holds.
- Could not verify
Every source the paper cites for this claim was checked and supports it.
In the paper
“The diagnostic power of the biomarkers also varied in different studies49,50.”
§ Integrated algorithm combining plasma biomarkers and cognitive assessments accurately predicts brain β-amyloid pathology > Discussion
What the sources say
- Supportedcites [49] Cheng, L. et al. Plasma Abeta as a biomarker for predicting Abeta-PET status in Alzheimer’s diseasea systematic review with meta-analysis. J. Neurol. Neurosurg. Psychiatry. 93, 513–520 (2022). source
The Introduction describes conflicting findings across studies on whether the plasma Aβ42/Aβ40 ratio distinguishes PET-positive from PET-negative patients. The Results also report substantial heterogeneity across studies, supporting the claim that biomarker diagnostic performance varied. Page numbers are not provided in our copy. (LLM, conf=0.92)
- Supportedcites [50] Ashton, N. J. et al. The validation status of blood biomarkers of amyloid and phospho-tau assessed with the 5-phase development framework for AD biomarkers. Eur. J. Nucl. Med. Mol. Imaging. 48, 2140–2156 (2021). source
The Results (Phase 2: clinical assay development for clinical disease) report different ranges of diagnostic accuracy across studies and assay types. For example, reported accuracies for Aβ42/Aβ40 range from 80–97% in IPMS studies, while commercially available Simoa assays have reported accuracies of 60–68%. (LLM, conf=0.93)
plain- Asserted: passes — The authors put it forward as true.
- Checkable: passes — It can be checked against evidence.
- Load-bearing: passes — The paper’s conclusions depend on it.
- Based: passes — The paper gives a reason why it holds.
- Supported
The cited sources support only part of this claim — read each source’s verdict below.
In the paper
“Several studies have demonstrated that plasma Aβ40, Aβ42, phosphorylated tau (P-tau) and neurofilament light (NfL) are to some extent correlated with PET scan and CSF detection results6–8.”
§ Integrated algorithm combining plasma biomarkers and cognitive assessments accurately predicts brain β-amyloid pathology > Introduction
What the sources say
- Partly supportedcites [6] Hampel, H. et al. Blood-based biomarkers for Alzheimer disease: mapping the road to the clinic. Nat. Rev. Neurol. 14, 639–652 (2018). sourceExperimental — accuracy not yet measured
The Introduction’s “Current landscape” section (page unavailable) reports weak but significant plasma–CSF correlations for Aβ40 and Aβ42, an association between plasma amyloid measures and amyloid PET results, and a strong serum–CSF correlation for NfL. It discusses plasma tau and later PET-measured hypometabolism, but does not establish the claimed PET or CSF correlations for phosphorylated tau specifically. (LLM, conf=0.88)
- Partly supportedcites [7] Hansson, O. et al. Blood-based NfL: A biomarker for differential diagnosis of parkinsonian disorder. Neurology 88, 930–937 (2017). sourceExperimental — accuracy not yet measured
The Results section ('Correlations between the levels of NfL in CSF and blood'; page unavailable) reports a strong correlation between blood and CSF NfL. The section on correlations with other CSF biomarkers also reports an association between blood NfL and CSF Aβ42, but not CSF p-tau. This paper does not establish the claimed correlations for plasma Aβ40, Aβ42 or P-tau, or correlations with PET results. (LLM, conf=0.88)
- Supportedcites [8] Mattsson, N., Cullen, N. C., Andreasson, U., Zetterberg, H. & Blennow, K. Association Between Longitudinal Plasma Neurofilament Light and Neurodegeneration in Patients With Alzheimer Disease. JAMA Neurol. 76, 791–799 (2019). source
The Results section ('Plasma NfL by Baseline Biomarkers, Imaging Findings, and Cognition') reports associations between plasma NfL and CSF Aβ42, t-tau, and p-tau, as well as FDG-PET findings. This supports the NfL portion of the multi-citation sentence; this paper does not need to establish the claims about the other plasma markers. (LLM, conf=0.88)
boostedstates an association- Asserted: passes — The authors put it forward as true.
- Checkable: passes — It can be checked against evidence.
- Load-bearing: passes — The paper’s conclusions depend on it.
- Based: passes — The paper gives a reason why it holds.
- Partly supported
24 more claims
Create a free account to see all 51 claims and to verify the 2 references still open.
- Probably not a substantial claim. 14
- It may state two separate claims as one. 9
- The quote only partly states this claim. 2
Citations
Cites
McKhann, G. M., Knopman, D. S., Chertkow, H., Hyman, B. T., Jack, C. R., Kawas, C. H., Klunk, W. E., Koroshetz, W. J., Manly, J. J., Mayeux, R., et al. (2011) · Alzheimer's & Dementia · doi:10.1016/j.jalz.2011.03.005 · Cited by 18,657 · cited 1×
“Participants with cognitive symptoms but not met the diagnostic criteria for dementia were classi fi ed as MCI if they met the actuarial neuropsychological criteria put forward by Jak and Bondi 34 .”
Jessen, F., Amariglio, R. E., van Boxtel, M., Breteler, M., Ceccaldi, M., Chételat, G., Dubois, B., Dufouil, C., Ellis, K. A., van der Flier, W. M., et al. (2014) · Alzheimer's & Dementia · doi:10.1016/j.jalz.2014.01.001 · Cited by 3,014 · cited 1×
“Standard uptake value ratios (SUVR) were calculated for the cortical regions of interest (ROIs) using cerebellar crus as a reference 36 .”
Measurement of Functional Activities in Older Adults in the Community
Pfeffer, R. I., Kurosaki, T. T., Harrah, C. H., Chance, J. M., & Filos, S. (1982) · Journal of Gerontology · doi:10.1093/geronj/37.3.323 · Cited by 2,972 · cited 3×
“Different cognitive domains were assessed by a battery of standardized neuropsychological tests, including Auditory Verbal Learning Test (AVLT) 29 20 min delayed free recall and AVLT recognition for memory, Boston Naming Test (BNT) 30 and Animal Verbal Flu-ency Test (AFT) 31 for language, Shape Trail Test Part A and B…”
Influential2020 Alzheimer's disease facts and figures
(2020) · Alzheimer's & Dementia · doi:10.1002/alz.12068 · Cited by 2,353
(2018) · Neurology · doi:10.1212/wnl.0000000000004826 · Cited by 2,183 · cited 1×
“Most anti-A β drugs showed the best ef fi cacy on A β -positive MCI patients in clinical trials and real-world studies 52 .”
Donanemab in Early Alzheimer’s Disease
Mintun, M. A., Lo, A. C., Duggan Evans, C., Wessels, A. M., Ardayfio, P. A., Andersen, S. W., Shcherbinin, S., Sparks, J., Sims, J. R., Brys, M., et al. (2021) · New England Journal of Medicine · doi:10.1056/nejmoa2100708 · Cited by 1,728 · cited 1×
“A lzheimer ’ s disease becomes an ever-growing burden on public health 1 . effective Most existing treatments and ongoing clinical trials of innovative medicines all appeared more on MCI or early Alzheimer ’ s disease patients, especially those who had abnormal levels of brain A β 2,3 .”
High performance plasma amyloid-β biomarkers for Alzheimer's disease
Nakamura, A., Kaneko, N., Villemagne, V. L., Kato, T., Doecke, J., Doré, V., Fowler, C., Li, Q.-X., Martins, R., Rowe, C., et al. (2018) · Nature · doi:10.1038/nature25456 · Cited by 1,681
Karikari, T. K., Pascoal, T. A., Ashton, N. J., Janelidze, S., Benedet, A. L., Rodriguez, J. L., Chamoun, M., Savard, M., Kang, M. S., Therriault, J., et al. (2020) · The Lancet Neurology · doi:10.1016/s1474-4422(20)30071-5 · Cited by 1,316 · cited 1×
“Among the existing plasma biomarkers, P-tau has shown the highest predictive accuracy for A β positivity 11,12 .”
Rajan, K. B., Weuve, J., Barnes, L. L., McAninch, E. A., Wilson, R. S., & Evans, D. A. (2021) · Alzheimer's & Dementia · doi:10.1002/alz.12362 · Cited by 1,268 · cited 1×
“The increasing prevalence of AD calls urgent attention to both treatment and diagnosis 15 .”
Blood-based biomarkers for Alzheimer's disease: towards clinical implementation
Teunissen, C. E., Verberk, I. M. W., Thijssen, E. H., Vermunt, L., Hansson, O., Zetterberg, H., van der Flier, W. M., Mielke, M. M., & del Campo, M. (2022) · The Lancet Neurology · doi:10.1016/s1474-4422(21)00361-6 · Cited by 1,045 · cited 2×
“Blood-based biomarkers have the advantages of being less invasive, more cost-effective and better feasibility 5 .”
Cited by
Challenges in the practical implementation of blood biomarkers for Alzheimer’s disease
Schöll, M., Verberk, I. M. W., del Campo, M., Delaby, C., Therriault, J., Chong, J. R., Palmqvist, S., & Alcolea, D. A. (2024) · The Lancet Healthy Longevity · doi:10.1016/j.lanhl.2024.07.013 · Cited by 161
Accurate prediction of biliary atresia with an integrated model using MMP-7 levels and bile acids
Han, Y., Hu, S., Zhu, J. Q., et al. (2023) · World Journal of Pediatrics · doi:10.1007/s12519-023-00779-7 · Cited by 18
Self-citationPan, F., Huang, Q., Huang, C., Lu, Y. W., Cui, L., Huang, L., Guan, Y., Xie, F., & Guo, Q. (2025) · Alzheimer s & Dementia · doi:10.1002/alz.70005 · Cited by 14
Self-citationConsensus on rapid screening for prodromal Alzheimer’s disease in China
Huang, L., Li, Q., Lu, Y., Pan, F., Cui, L., Wang, Y., Miao, Y., Chen, T., Li, Y., Wu, J., et al. (2024) · General Psychiatry · doi:10.1136/gpsych-2023-101310 · Cited by 17
“73 Lipid metabolism indicators such as oxidised low-density lipoprotein, serum inflammatory-based indicators such as advanced oxidation protein products and transforming growth factor-β , and platelet-related markers such as β -secretase all showed significant differences between cognitively normal…”
BackgroundSelf-citationPredicting brain amyloid load with digital and blood-based biomarkers
Chen, W., Liao, Y., Shi, X., Su, F., Kong, H., Fang, Y., Zheng, Y., Zhou, J., Liu, G., Zhou, X., et al. (2025) · Alzheimer s Research & Therapy · doi:10.1186/s13195-025-01801-y · Cited by 9
Metadata
- Authors
- Pan, F., Huang, Y., Cai, X., Wang, Y., Guan, Y., Deng, J., Yang, D., Zhu, J., Zhao, Y., Xie, F., Fang, Z., & Guo, Q.
- Affiliations
- Shanghai Jiao Tong University (CN)
- Fudan University (CN)
- Corresponding author
- Xie, Fang
- Fang, Zhuo
- Guo, Qihao
- Venue
- Communications Medicine
- Published
- 2023-05-10
- Volume
- 3
- Issue
- 1
- Pages
- 65-65
- ISSN
- 2730-664X (ISSN-L)
- PMC
- PMC10172320
- OpenAlex
- W4376113744
- Semantic Scholar
- d445bc2a71b7530238f55a7930ad1d4bc6825fb8
- Cited by
- 27
- References
- 58
- Citations by year
- 2026: 11 · 2025: 8 · 2024: 6 · 2023: 2
- FWCI
- 5.47
- Type
- journal article
- Language
- en
- Open access
- gold
- doi.org
- Licence
- cc-by
- creativecommons.org/licenses/by/4.0 (tdm)
- creativecommons.org/licenses/by/4.0 (vor)
- Locations
- Communications Medicine (publishedVersion, cc-by)
- PubMed Central (publishedVersion, cc-by)
- PubMed (publishedVersion)
- DOAJ (DOAJ: Directory of Open Access Journals) (submittedVersion, cc-by-sa)
- Funders
- National Natural Science Foundation of China (2018B030336001, 82171198, 2018SHZDZX01)
- Topics
- Health Sciences › Medicine › Psychiatry and Mental health › Dementia and Cognitive Impairment Research
- Life Sciences › Neuroscience › Cellular and Molecular Neuroscience › Alzheimer's disease research and treatments
- Health Sciences › Medicine › Oncology › Cancer-related cognitive impairment studies
- Keywords
- Alzheimer's disease, cerebral amyloidosis, plasma biomarkers, amyloid-beta 42, Aβ40, tau protein, phosphorylated tau, neurofilament light chain, APOE genotype, cognitive assessment, mild cognitive impairment, amnestic MCI, prediction model, early diagnosis
About these checks
Registry, retraction, Cites and statistics results are computed, not judged, with one exception: a printed reference that no index lists is read once by a model before it counts as a citation error. Claims are extracted by a model and kept only when their quote appears verbatim in the text; each cited source is then checked, with a model’s help, for whether it says what the claim relies on. Those verdicts can be wrong — read the claim’s quote and the cited source before relying on one.
The claim verdicts this report counts are experimental: their accuracy is not yet measured.
A language model drew the claims from the paper on 2026-10-10, under version 3 of the claim definition (model deepseek-v4.1-flash, prompt extract-v3).
A second model labelled each claim on 2026-10-10 (model jev-1.13-20260917, definition revision gold-guideline-v0.2).
Cited sources are checked with a language model’s help (gpt-6-sol and qwen3.8-omni-flash).
Statistics and arithmetic are recomputed, not judged.
Confidence bands are shown only for fields calibrated on our annotated test set. None is calibrated yet, so no band is shown.
What counts as a claim ›How we measure confidence ›How we check this ›
Are you an author, or do you see a problem with this page? Request a review
How to cite
Cite CoChat for the checks on this page, and the paper for its own findings.
- This page
- CoChat. (2026). Citation check: Integrated algorithm combining plasma biomarkers and cognitive assessments accurately predicts brain β-amyloid pathology. https://app.cochat.ai/papers/10.1038/s43856-023-00295-9
- The paper
- Pan, F., Huang, Y., Cai, X., Wang, Y., Guan, Y., Deng, J., Yang, D., Zhu, J., Zhao, Y., Xie, F., Fang, Z., & Guo, Q. (2023). Integrated algorithm combining plasma biomarkers and cognitive assessments accurately predicts brain β-amyloid pathology. Communications Medicine. https://doi.org/10.1038/s43856-023-00295-9
Data sources
Bibliographic data: Semantic Scholar, OpenAlex, Crossref.
Contains information from the Semantic Scholar Academic Graph Datasets, made available under the ODC Attribution License (ODC-BY 1.0).
Semantic Scholar’s data is described in: Kinney, R., et al. (2023). The Semantic Scholar Open Data Platform. arXiv:2301.10140.
