Student or educator? Sign up with your school email and get 6 months of Pro free.
Cited by 5Nuclear Structure and FunctionMicrotubule and mitosis dynamicsFungal and yeast genetics research

The DOI matches its Crossref record; 43 of the 43 references it cites were found in a registry or an index.

Multifunctional roles of Brl1-Brr6 in nuclear envelope fusion during nuclear pore complex biogenesis

Open access

Published version of a preprint

Abstract

Brl1 and Brr6 are integral membrane proteins of the yeast nuclear envelope (NE) that transiently associate with nuclear pore complexes (NPCs). The exact roles of Brl1 and Brr6 during NPC assembly are unclear. Here, we demonstrate that Brr6 operates at both early and late stages of NPC assembly. Its early function is supported by amphipathic α-helix mutants, which impact nucleoporin recruitment without nuclear envelope deformation, whereas mutations in conserved cysteine residues result in NE deformation accompanied by defective NE fusion. The N-terminus of Brl1 interacts with the nucleoporin Nic96, promoting Nic96 recruitment to early assembly sites. AlphaFold predictions, the essential role of the conserved PAL motif, and the inhibition of NE fusion upon overexpression of PAL mutants together suggest that the perinuclear domains of Brl1 and Brr6 interact across the perinuclear space. Extending the length of the perinuclear-space regions of Brl1 and Brr6 causes uncontrolled NE fusion, as indicated by nuclear envelope disintegration dependent on the conserved cysteine residues. Together, Brl1 and Brr6 promote NE fusion by bridging the perinuclear space through PAL motif interactions, followed by nuclear envelope fusion and NPC insertion.

Overview

The claims and statistics of this paper haven’t been checked yet.

Run the check — free, no account needed. It reads the open-access text and checks the sources it cites.

A few free checks a day · papers already verified open instantly · results are public

Integrity signals

Registry

Crossref · 10.1038/s44318-026-00718-y

Cites

43 of 43 references verified0 citation errors · 0 not checkable

Statistics

Figures

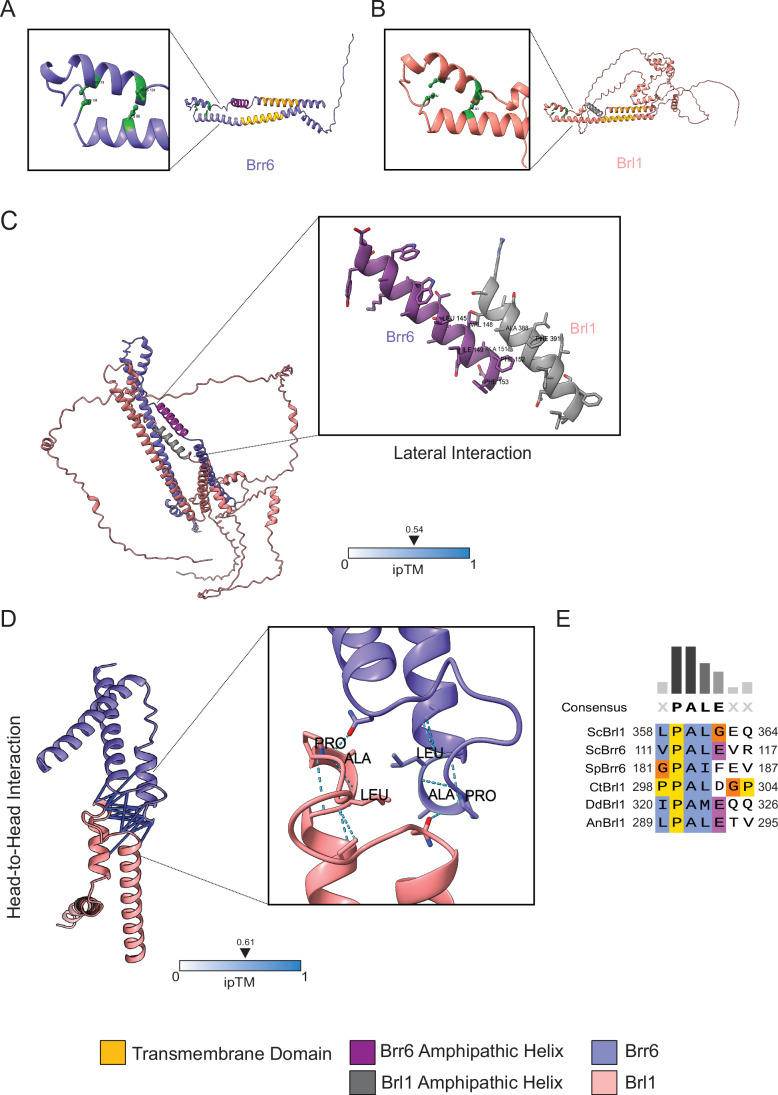
Figure 1 Brl1 and Brr6 interactions. (A) Domain organization of Brr6. An AαH (magenta) is flanked by two transmembrane (TM) domains (yellow). Two disulfide bonds are highlighted in green in the enlargement. The long N-terminal domain localizes to either the nucleoplasm or the cytoplasm, depending on whether Brr6 is associated with the INM or the ONM, respectively. (B) Domain organization of Brl1. The AαH is in dark gray, and the four cysteine residues are shown in light green (enlargement). The two TMs are shown in yellow. (C) AlphaFold2 prediction of the Brl1–Brr6 interaction of full-length Brr6 and Brl1. It predicts interactions between the hydrophobic surfaces of the two AαHs. (D) The interaction surface between the head-to-head domains of both Brr6 and Brl1 predicated using AlphaFold2. The interactions at the tip of the DAH, which contains the conserved PAL sequence, are shown in the enlargement. (E) Sequence alignment of the conserved PAL motif across the indicated Brl1 and Brr6 homologs. ScBrl1 and ScBrr6: Brl1 and Brr6 from S. cerevisiae; SpBrr6: S. pombe Brr6: CtBrl1: Chaetomium thermophilum Brl1; DbBrl1: Dictyostelium discoideum Brl1; AnBrl1: Aspergillus nidulans Brl1. Sequence alignment was performed using the Clustal Omega program (Madeira et al, 2024).
Figure 1 Brl1 and Brr6 interactions. (A) Domain organization of Brr6. An AαH (magenta) is flanked by two transmembrane (TM) domains (yellow). Two disulfide bonds are highlighted in green in the enlargement. The long N-terminal domain localizes to either the nucleoplasm or the cytoplasm, depending on whether Brr6 is associated with the INM or the ONM, respectively. (B) Domain organization of Brl1. The AαH is in dark gray, and the four cysteine residues are shown in light green (enlargement). The two TMs are shown in yellow. (C) AlphaFold2 prediction of the Brl1–Brr6 interaction of full-length Brr6 and Brl1. It predicts interactions between the hydrophobic surfaces of the two AαHs. (D) The interaction surface between the head-to-head domains of both Brr6 and Brl1 predicated using AlphaFold2. The interactions at the tip of the DAH, which contains the conserved PAL sequence, are shown in the enlargement. (E) Sequence alignment of the conserved PAL motif across the indicated Brl1 and Brr6 homologs. ScBrl1 and ScBrr6: Brl1 and Brr6 from S. cerevisiae; SpBrr6: S. pombe Brr6: CtBrl1: Chaetomium thermophilum Brl1; DbBrl1: Dictyostelium discoideum Brl1; AnBrl1: Aspergillus nidulans Brl1. Sequence alignment was performed using the Clustal Omega program (Madeira et al, 2024).CC BY · PubMed Central
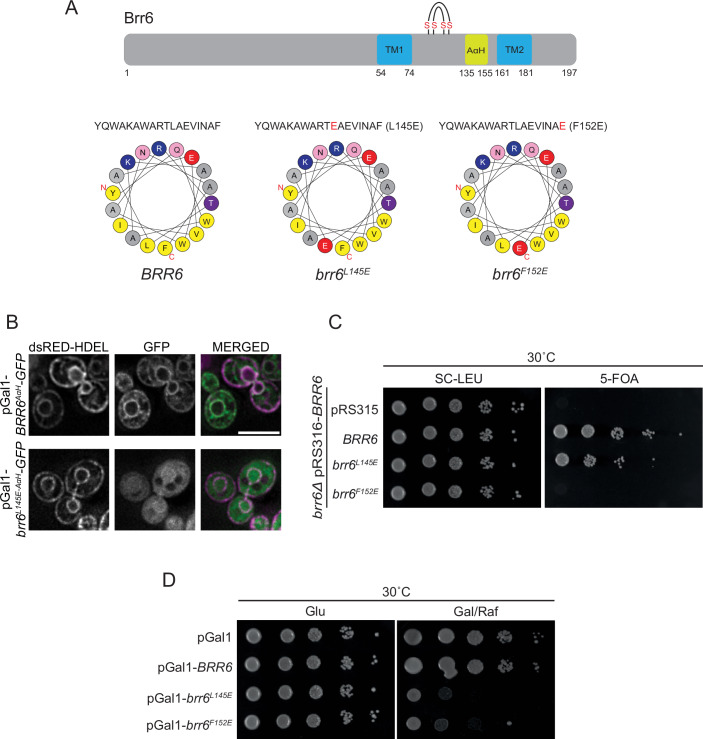
Figure 2 AαH of Brr6 performs an essential function required for yeast viability. (A) AαH predictions for the wild-type and mutant sequences of Brr6 were generated using HeliQuest (Gautier et al, 2008). The upper cartoon illustrates the domain organization of Brr6, highlighting the two transmembrane (TM) domains, the AαH, and the four conserved cysteine residues. Amino acid positions are indicated. (B) Subcellular localization of GFP-tagged Brr6 wild-type and brr6L145E AαH region. The pGal1 promoter was expressed for 3 h by the addition of galactose. Fluorescence microscopy was performed to assess localization. dsRed-HDEL was used as NE and ER marker (Madrid et al, 2006). Size bar: 5 µm. Representative image from three independent repeats. (C) Growth assay of the BRR6 shuffle strain carrying the empty LEU2-based plasmid pRS315 or pRS315 containing the indicated BRR6 alleles (BRR6, brr6L145E, and brr6F152E). Tenfold serial dilutions were spotted onto SC–LEU and 5-FOA plates and incubated at 30 °C for 2 days. Growth on 5-FOA plates selects for cells that have lost the URA3 plasmid, thereby testing whether the LEU2-based plasmid alone can support viability in the absence of wild-type BRR6. One representative of three independent experiments is shown. (D) Wild-type yeast cells carrying the indicated pGal1 plasmids were spotted in tenfold serial dilutions onto glucose (Glu) or galactose/raffinose (Gal/Raf) plates and incubated at 30 °C. One representative of three independent experiments is shown.
Figure 2 AαH of Brr6 performs an essential function required for yeast viability. (A) AαH predictions for the wild-type and mutant sequences of Brr6 were generated using HeliQuest (Gautier et al, 2008). The upper cartoon illustrates the domain organization of Brr6, highlighting the two transmembrane (TM) domains, the AαH, and the four conserved cysteine residues. Amino acid positions are indicated. (B) Subcellular localization of GFP-tagged Brr6 wild-type and brr6L145E AαH region. The pGal1 promoter was expressed for 3 h by the addition of galactose. Fluorescence microscopy was performed to assess localization. dsRed-HDEL was used as NE and ER marker (Madrid et al, 2006). Size bar: 5 µm. Representative image from three independent repeats. (C) Growth assay of the BRR6 shuffle strain carrying the empty LEU2-based plasmid pRS315 or pRS315 containing the indicated BRR6 alleles (BRR6, brr6L145E, and brr6F152E). Tenfold serial dilutions were spotted onto SC–LEU and 5-FOA plates and incubated at 30 °C for 2 days. Growth on 5-FOA plates selects for cells that have lost the URA3 plasmid, thereby testing whether the LEU2-based plasmid alone can support viability in the absence of wild-type BRR6. One representative of three independent experiments is shown. (D) Wild-type yeast cells carrying the indicated pGal1 plasmids were spotted in tenfold serial dilutions onto glucose (Glu) or galactose/raffinose (Gal/Raf) plates and incubated at 30 °C. One representative of three independent experiments is shown.CC BY · PubMed Central
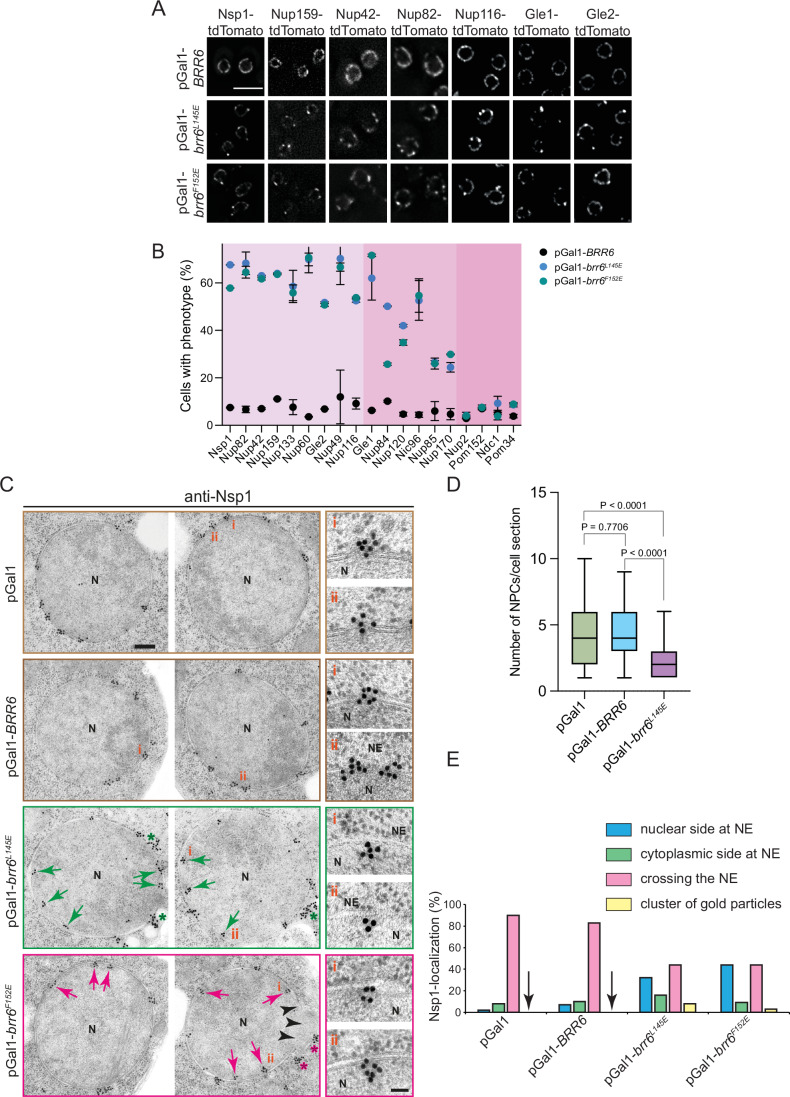
Figure 3 The AαH of Brr6 is needed in early NPC assembly. (A) Overexpression of brr6L145E alters NE localization of Nups. BRR6, brr6L145E, and brr6F152E were overexpressed for 3 h in yeast cells expressing fluorescently tagged (tdTomato) components of the NPC. Three independent experiments. Note, the NSP1-tdTomato pGal1-brr6F152E cells (first column) are identical to the cells used in the line scan in Fig. EV2C (top). Size bar: 5 µm. (B) Quantification of the mis-localization phenotype across different tagged Nups. The graph shows the percentage of cells exhibiting mis-localization upon overexpression of pGal1-BRR6, pGal1-brr6L145E, and pGal1-brr6F152E. 150 cells were analyzed per Nup-tdTomato/Nup–GFP strain and for each expression plasmid and experiment. Three independent experiments. Nup-tdTomato and Nup–GFP constructs (also see Fig. EV2) showing defects in 50–70% of cells were classified as strongly affected (light pink), those in 20–50% as intermediate (pink), and those in less than 20% as not affected (darker pink). n = 3; data show mean (indicated by dots) with standard deviation (SD). (C) Immuno-electron micrographs of wild-type cells with pGal1 (control plasmid), pGal1-BRR6, pGal1-brr6L145E, or pGal1-brr6F152E for 3 h, stained with anti-Nsp1 antibodies and protein A–gold conjugated with 15 nm gold. Each panel shows two representative cells for each plasmid. Red and green arrows indicate the Nsp1 signal below the INM. Green and red asterisks highlight clusters (10 and more) of gold particles. N nucleus, NE nuclear envelope. Size bar: 200 nm. Enlarged views of selected regions marked with i and ii are shown to the right. Size bar: 50 nm. (D) Quantification of NPCs per EM section. The quantification of NPCs was done based on Nsp1 signals at the NPCs. The number of NPCs per section was analyzed in the cells from (C). n = 68 for pGal1; n = 70 for pGal1-BRR6; n = 67 for pGal1-brr6L145E. Statistical test: unpaired t test; Box and whisker plots represent the median with interquartile range. P = 7.3E-8 for the statistical significance between pGal1 and pGal1-brr6L145E condition; P = 2.5E-10 for the statistical significance between pGal1-BRR6 and pGal1-brr6L145E condition. (E) Quantification of the localization of gold particles from (C). Only clusters of more than 2 gold particles were counted. Clusters containing ≥10 gold particles were counted as clusters of gold particles, as these likely correspond to the intense Nsp1 fluorescence foci observed in Fig. EV2. n = 35 cell sections per plasmid type. Arrowheads indicate the absence of gold particle clusters in pGal1 and pGal1–BRR6 cells. Source data are available online for this figure.
Figure 3 The AαH of Brr6 is needed in early NPC assembly. (A) Overexpression of brr6L145E alters NE localization of Nups. BRR6, brr6L145E, and brr6F152E were overexpressed for 3 h in yeast cells expressing fluorescently tagged (tdTomato) components of the NPC. Three independent experiments. Note, the NSP1-tdTomato pGal1-brr6F152E cells (first column) are identical to the cells used in the line scan in Fig. EV2C (top). Size bar: 5 µm. (B) Quantification of the mis-localization phenotype across different tagged Nups. The graph shows the percentage of cells exhibiting mis-localization upon overexpression of pGal1-BRR6, pGal1-brr6L145E, and pGal1-brr6F152E. 150 cells were analyzed per Nup-tdTomato/Nup–GFP strain and for each expression plasmid and experiment. Three independent experiments. Nup-tdTomato and Nup–GFP constructs (also see Fig. EV2) showing defects in 50–70% of cells were classified as strongly affected (light pink), those in 20–50% as intermediate (pink), and those in less than 20% as not affected (darker pink). n = 3; data show mean (indicated by dots) with standard deviation (SD). (C) Immuno-electron micrographs of wild-type cells with pGal1 (control plasmid), pGal1-BRR6, pGal1-brr6L145E, or pGal1-brr6F152E for 3 h, stained with anti-Nsp1 antibodies and protein A–gold conjugated with 15 nm gold. Each panel shows two representative cells for each plasmid. Red and green arrows indicate the Nsp1 signal below the INM. Green and red asterisks highlight clusters (10 and more) of gold particles. N nucleus, NE nuclear envelope. Size bar: 200 nm. Enlarged views of selected regions marked with i and ii are shown to the right. Size bar: 50 nm. (D) Quantification of NPCs per EM section. The quantification of NPCs was done based on Nsp1 signals at the NPCs. The number of NPCs per section was analyzed in the cells from (C). n = 68 for pGal1; n = 70 for pGal1-BRR6; n = 67 for pGal1-brr6L145E. Statistical test: unpaired t test; Box and whisker plots represent the median with interquartile range. P = 7.3E-8 for the statistical significance between pGal1 and pGal1-brr6L145E condition; P = 2.5E-10 for the statistical significance between pGal1-BRR6 and pGal1-brr6L145E condition. (E) Quantification of the localization of gold particles from (C). Only clusters of more than 2 gold particles were counted. Clusters containing ≥10 gold particles were counted as clusters of gold particles, as these likely correspond to the intense Nsp1 fluorescence foci observed in Fig. EV2. n = 35 cell sections per plasmid type. Arrowheads indicate the absence of gold particle clusters in pGal1 and pGal1–BRR6 cells. Source data are available online for this figure.CC BY · PubMed Central
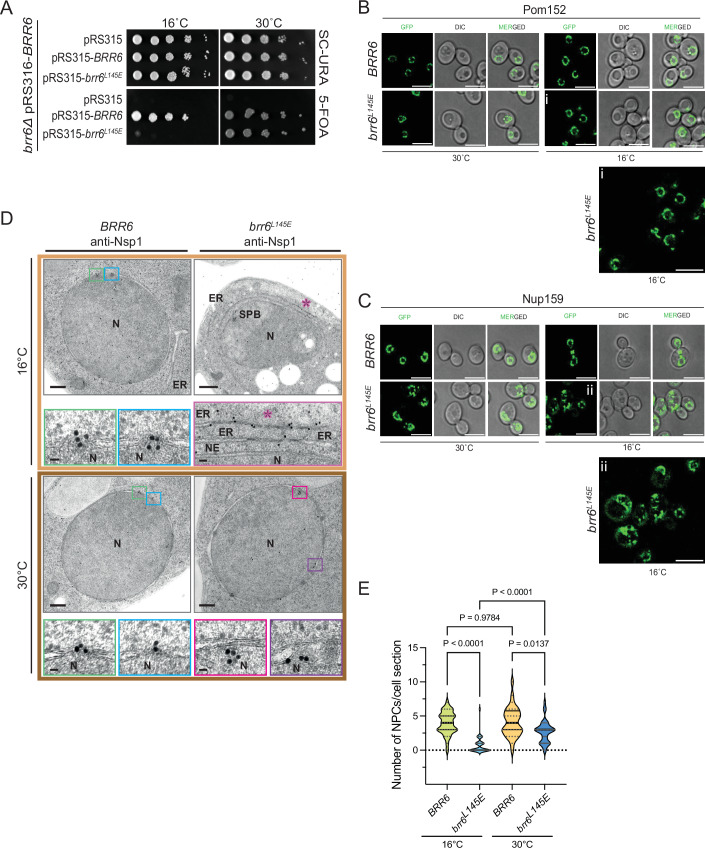
Figure 4 Cold-sensitive brr6L145E cells are devoid of NPCs. (A) The brr6L145E mutant exhibits cold-sensitive growth. To assess functionality at 16 °C, ∆brr6 cells carrying the URA3-based plasmid pRS316-BRR6 were transformed with the indicated LEU2-based plasmids. Transformants were grown at both 16 °C and 30 °C. One representative of three independent experiments is shown. (B, C) Phenotypic analysis of brr6L145E cells. The brr6L145E allele was genomically integrated into ∆brr6 pRS316-BRR6 cells, followed by counterselection on 5-FOA. POM152 (B) and NUP159 (C) were tagged with GFP using genomic integration (Janke et al, 2004). Cold-sensitive brr6L145E cells were incubated at 16 °C overnight and imaged by fluorescence microscopy. The enlargements (i) and (ii) at the bottom of (B, C) show brr6L145E cells grown at 16 °C. Three independent experiments. Size bar: 5 µm. (D) brr6L145E cells analyzed by immuno-electron microscopy using anti-Nsp1 antibodies. In wild-type cells, Nsp1 was predominantly detected at the NPCs. In brr6L145E mutant cells, the Nsp1 signal was observed below the INM. Additionally, brr6L145E cells accumulated electron-dense regions within the ER that were specifically labeled by Nsp1 antibodies. The purple asterisk indicates expanded ER structures containing electron-dense material labeled by anti-Nsp1 antibodies. N nucleus, NE nuclear envelope, ER endoplasmic reticulum, SPB spindle pole body. Size bar: 200 nm; enlargements: 25 nm (NPC or NE) and 50 nm (ER structures). (E) Quantification of NPCs per EM section from (D). The quantification of NPCs was done based on Nsp1 signals at the NPCs. BRR6 (16 °C): n = 31; brr6L145E (16 °C): n = 32; BRR6 (30 °C): n = 31; brr6L145E (30 °C): n = 35 sections were analyzed per strain and condition. Statistical test: One-way ANOVA. Plot shows the median with quartiles. The single dots indicate the individual values of the measurements. P = 3.8E-10 for the statistical significance between BRR6 (16 °C) and brr6L145E (16 °C) condition; P = 4.4E-7 for the statistical significance between brr6L145E (16 °C) and brr6L145E (30 °C) condition. Source data are available online for this figure.
Figure 4 Cold-sensitive brr6L145E cells are devoid of NPCs. (A) The brr6L145E mutant exhibits cold-sensitive growth. To assess functionality at 16 °C, ∆brr6 cells carrying the URA3-based plasmid pRS316-BRR6 were transformed with the indicated LEU2-based plasmids. Transformants were grown at both 16 °C and 30 °C. One representative of three independent experiments is shown. (B, C) Phenotypic analysis of brr6L145E cells. The brr6L145E allele was genomically integrated into ∆brr6 pRS316-BRR6 cells, followed by counterselection on 5-FOA. POM152 (B) and NUP159 (C) were tagged with GFP using genomic integration (Janke et al, 2004). Cold-sensitive brr6L145E cells were incubated at 16 °C overnight and imaged by fluorescence microscopy. The enlargements (i) and (ii) at the bottom of (B, C) show brr6L145E cells grown at 16 °C. Three independent experiments. Size bar: 5 µm. (D) brr6L145E cells analyzed by immuno-electron microscopy using anti-Nsp1 antibodies. In wild-type cells, Nsp1 was predominantly detected at the NPCs. In brr6L145E mutant cells, the Nsp1 signal was observed below the INM. Additionally, brr6L145E cells accumulated electron-dense regions within the ER that were specifically labeled by Nsp1 antibodies. The purple asterisk indicates expanded ER structures containing electron-dense material labeled by anti-Nsp1 antibodies. N nucleus, NE nuclear envelope, ER endoplasmic reticulum, SPB spindle pole body. Size bar: 200 nm; enlargements: 25 nm (NPC or NE) and 50 nm (ER structures). (E) Quantification of NPCs per EM section from (D). The quantification of NPCs was done based on Nsp1 signals at the NPCs. BRR6 (16 °C): n = 31; brr6L145E (16 °C): n = 32; BRR6 (30 °C): n = 31; brr6L145E (30 °C): n = 35 sections were analyzed per strain and condition. Statistical test: One-way ANOVA. Plot shows the median with quartiles. The single dots indicate the individual values of the measurements. P = 3.8E-10 for the statistical significance between BRR6 (16 °C) and brr6L145E (16 °C) condition; P = 4.4E-7 for the statistical significance between brr6L145E (16 °C) and brr6L145E (30 °C) condition. Source data are available online for this figure.CC BY · PubMed Central
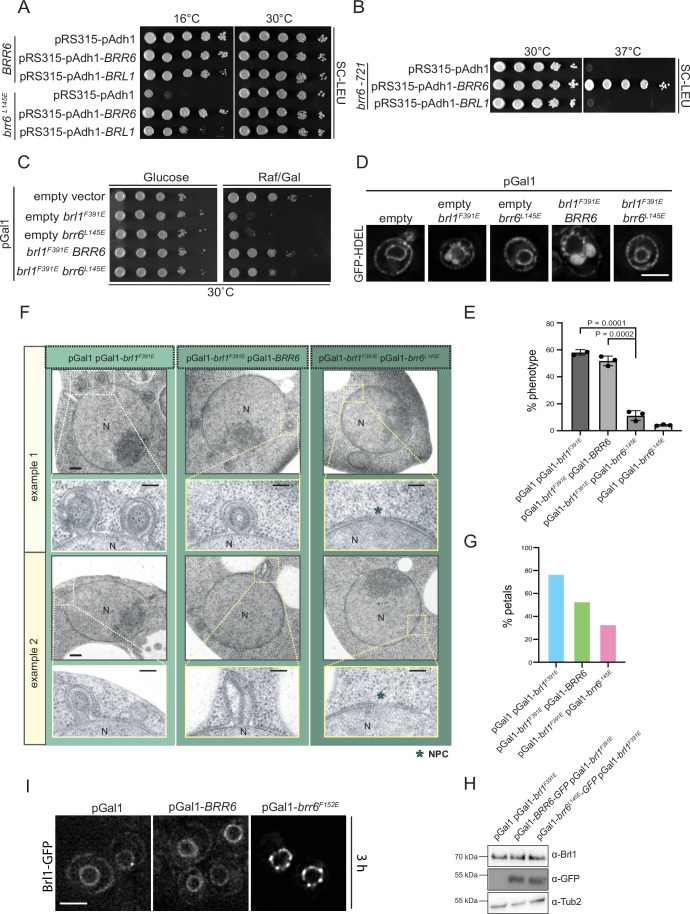
Figure 5 BRL1 and BRR6 interdependencies indicate functional cooperation between early steps of NPC assembly. (A) The growth defect of the cold-sensitive brr6L145E cells was suppressed by pAdh1-BRL1, consistent with the role of the mutated helix in lateral Brl1–Brr6 interactions. (B) The growth defect of the DAH mutant brr6-721 (C124R) was not suppressed by pAdh1-BRL1 overexpression. (A,B) Three independent experiments. (C) Overexpression of the brr6L145E AαH mutant reduces the toxicity of the brl1F391E AαH mutant. Tenfold serial dilutions of wild-type yeast cells carrying the indicated plasmids, along with the empty pGal1 plasmid, were grown on glucose or galactose/raffinose plates at 30 °C for 2 days. One representative of three independent experiments is shown. (D) Cells expressing the ER marker GFP-HDEL and the indicated plasmids were imaged by fluorescence microscopy after a 3 h induction with galactose. Petal-like structures are indicated as larger GFP-HDEL blobs at the NE. Three independent experiments. “Empty” indicates the pGal1 plasmid without an insert. Size bar: 3 µm. (E) Quantification of cells with NE petal-like structures upon overexpression, based on data from (D). Data represent the mean ± SD from three independent experiments (n = 3, 50 cells each condition). Statistical test: One-way ANOVA. Data show mean with SD. (F) Electron micrographs of cells overexpressing the indicated plasmids for 3 h at 30 °C. Size bar: 200 nm in overviews and 100 nm in enlargements. Blue asterisks indicate NPCs. N nucleus. (G) Quantification of the petal-like phenotype observed in (F). n = 40 sections were analyzed per plasmid combination. (H) Immunoblot showing expression levels of brl1F391E-GFP, BRR6-GFP, and brr6L145E-GFP using the indicated antibodies. Tub2 was used as a loading control. One representative of three independent experiments is shown. (I) BRL1-GFP cells carrying the indicated pGal1 plasmids were incubated for 3 h at 30 °C after the addition of galactose and imaged under a fluorescence microscope. Three independent experiments. Size bar: 3 µm. Source data are available online for this figure.
Figure 5 BRL1 and BRR6 interdependencies indicate functional cooperation between early steps of NPC assembly. (A) The growth defect of the cold-sensitive brr6L145E cells was suppressed by pAdh1-BRL1, consistent with the role of the mutated helix in lateral Brl1–Brr6 interactions. (B) The growth defect of the DAH mutant brr6-721 (C124R) was not suppressed by pAdh1-BRL1 overexpression. (A,B) Three independent experiments. (C) Overexpression of the brr6L145E AαH mutant reduces the toxicity of the brl1F391E AαH mutant. Tenfold serial dilutions of wild-type yeast cells carrying the indicated plasmids, along with the empty pGal1 plasmid, were grown on glucose or galactose/raffinose plates at 30 °C for 2 days. One representative of three independent experiments is shown. (D) Cells expressing the ER marker GFP-HDEL and the indicated plasmids were imaged by fluorescence microscopy after a 3 h induction with galactose. Petal-like structures are indicated as larger GFP-HDEL blobs at the NE. Three independent experiments. “Empty” indicates the pGal1 plasmid without an insert. Size bar: 3 µm. (E) Quantification of cells with NE petal-like structures upon overexpression, based on data from (D). Data represent the mean ± SD from three independent experiments (n = 3, 50 cells each condition). Statistical test: One-way ANOVA. Data show mean with SD. (F) Electron micrographs of cells overexpressing the indicated plasmids for 3 h at 30 °C. Size bar: 200 nm in overviews and 100 nm in enlargements. Blue asterisks indicate NPCs. N nucleus. (G) Quantification of the petal-like phenotype observed in (F). n = 40 sections were analyzed per plasmid combination. (H) Immunoblot showing expression levels of brl1F391E-GFP, BRR6-GFP, and brr6L145E-GFP using the indicated antibodies. Tub2 was used as a loading control. One representative of three independent experiments is shown. (I) BRL1-GFP cells carrying the indicated pGal1 plasmids were incubated for 3 h at 30 °C after the addition of galactose and imaged under a fluorescence microscope. Three independent experiments. Size bar: 3 µm. Source data are available online for this figure.CC BY · PubMed Central
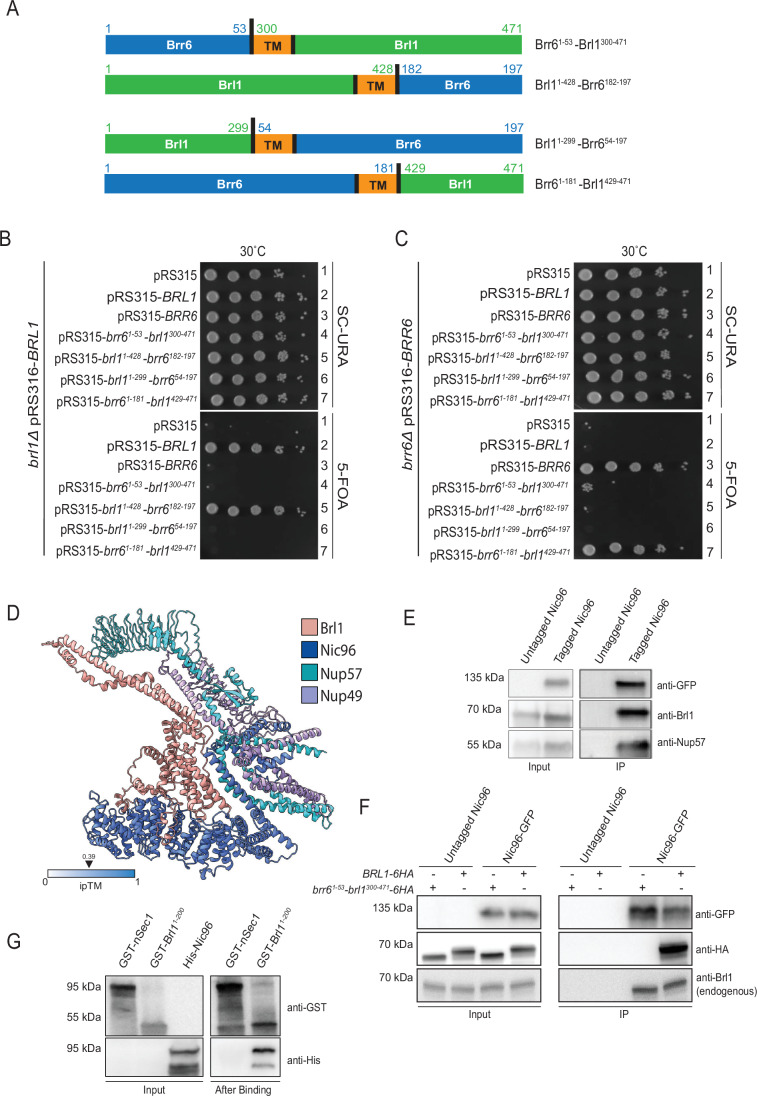
Figure 6 The N-terminus of Brl1 fulfills an essential function and interacts with the Nic96 complex. (A) Schematic representation of Brl1-Brr6 fusion proteins and their nomenclature. The amino acid numbers at the fusion junctions are indicated. The cartoon also depicts the TM domains of Brl1 and Brr6. (B, C) BRL1, BRR6, and brl1-brr6 fusion constructs were expressed from their respective endogenous promoters using the LEU2-based pRS315 plasmid and transformed into BRL1 (B) or BRR6 (C) shuffle strains. Tenfold serial dilutions of transformants were grown at 30 °C on SC–URA and 5-FOA plates. The brl11-428-brr6182-197 construct was functional for BRL1, while the fusion containing BRL1 with the N-terminus of BRR6 (brr61-53-brl1300-471) was non-functional (B, rows 5 and 4, respectively), indicating an essential role of the N-terminus of Brl1. Similarly, brl11-299-brr654-197 failed to complement BRR6 function, while brr61-181-brl1429-471 was functional (C, rows 6 and 7). One representative of three independent experiments is shown. (D) AlphaFold prediction showing a potential interaction between the N-terminus of Brl1 and nucleoporins Nic96, Nup57, and Nup49. Nsp1 is not shown in this model to reduce complexity. The prediction of the Brl1-Nic96-Nsp1-Nup57-Nup49 interaction is shown in Appendix Fig. S3B. (E) Co-immunoprecipitation of Brl1 with Nic96 and Nup57. Cells expressing either NIC96 or NIC96-GFP, both with pAdh1-BRL1, were lysed, and Nic96-GFP was immunoprecipitated using GFP nanobody beads. Eluted proteins were analyzed by immunoblotting with the indicated antibodies. Brl1 and Nup57 were specifically enriched in the Nic96-GFP pulldown. Three independent experiments. (F) Co-immunoprecipitation of Brl1-HA, but not Brr6¹-⁵³–Brl1³⁰⁰-⁴⁷¹-HA, with Nic96-GFP. Yeast cells expressing either untagged NIC96 or NIC96-GFP were transformed with pGal1-BRL1-HA or pGal1-Brr6¹-⁵³–Brl1³⁰⁰-⁴⁷¹-HA. Expression from the pGal1 promoter was induced by the addition of galactose for 3 h. Shown is a GFP-binder immunoprecipitation analyzed by immunoblotting with the indicated antibodies. Note that Brr6¹-⁵³–Brl1³⁰⁰-⁴⁷¹-HA is not recognized by anti-Brl1 antibodies, as these antibodies were raised against the N-terminus of Brl1, which is absent in this construct. Data are representative of three independent experiments. (G) Binding of recombinant 6His-Nic96 to GST-Brl11–200. GST-nSec1 was used as a negative control. GST-nSec1, GST-Brl11-200, and 6His-Nic96 were expressed in E.coli (Input). GST-nSec1 and GST-Brl11-200 were bound to glutathione beads. Cell lysates from E. coli expressing 6His-Nic96 were incubated with the glutathione beads. Bound proteins were analyzed by immunoblotting using GST and 6His antibodies. Results are from three independent experiments, and a representative image is shown. Source data are available online for this figure.
Figure 6 The N-terminus of Brl1 fulfills an essential function and interacts with the Nic96 complex. (A) Schematic representation of Brl1-Brr6 fusion proteins and their nomenclature. The amino acid numbers at the fusion junctions are indicated. The cartoon also depicts the TM domains of Brl1 and Brr6. (B, C) BRL1, BRR6, and brl1-brr6 fusion constructs were expressed from their respective endogenous promoters using the LEU2-based pRS315 plasmid and transformed into BRL1 (B) or BRR6 (C) shuffle strains. Tenfold serial dilutions of transformants were grown at 30 °C on SC–URA and 5-FOA plates. The brl11-428-brr6182-197 construct was functional for BRL1, while the fusion containing BRL1 with the N-terminus of BRR6 (brr61-53-brl1300-471) was non-functional (B, rows 5 and 4, respectively), indicating an essential role of the N-terminus of Brl1. Similarly, brl11-299-brr654-197 failed to complement BRR6 function, while brr61-181-brl1429-471 was functional (C, rows 6 and 7). One representative of three independent experiments is shown. (D) AlphaFold prediction showing a potential interaction between the N-terminus of Brl1 and nucleoporins Nic96, Nup57, and Nup49. Nsp1 is not shown in this model to reduce complexity. The prediction of the Brl1-Nic96-Nsp1-Nup57-Nup49 interaction is shown in Appendix Fig. S3B. (E) Co-immunoprecipitation of Brl1 with Nic96 and Nup57. Cells expressing either NIC96 or NIC96-GFP, both with pAdh1-BRL1, were lysed, and Nic96-GFP was immunoprecipitated using GFP nanobody beads. Eluted proteins were analyzed by immunoblotting with the indicated antibodies. Brl1 and Nup57 were specifically enriched in the Nic96-GFP pulldown. Three independent experiments. (F) Co-immunoprecipitation of Brl1-HA, but not Brr6¹-⁵³–Brl1³⁰⁰-⁴⁷¹-HA, with Nic96-GFP. Yeast cells expressing either untagged NIC96 or NIC96-GFP were transformed with pGal1-BRL1-HA or pGal1-Brr6¹-⁵³–Brl1³⁰⁰-⁴⁷¹-HA. Expression from the pGal1 promoter was induced by the addition of galactose for 3 h. Shown is a GFP-binder immunoprecipitation analyzed by immunoblotting with the indicated antibodies. Note that Brr6¹-⁵³–Brl1³⁰⁰-⁴⁷¹-HA is not recognized by anti-Brl1 antibodies, as these antibodies were raised against the N-terminus of Brl1, which is absent in this construct. Data are representative of three independent experiments. (G) Binding of recombinant 6His-Nic96 to GST-Brl11–200. GST-nSec1 was used as a negative control. GST-nSec1, GST-Brl11-200, and 6His-Nic96 were expressed in E.coli (Input). GST-nSec1 and GST-Brl11-200 were bound to glutathione beads. Cell lysates from E. coli expressing 6His-Nic96 were incubated with the glutathione beads. Bound proteins were analyzed by immunoblotting using GST and 6His antibodies. Results are from three independent experiments, and a representative image is shown. Source data are available online for this figure.CC BY · PubMed Central
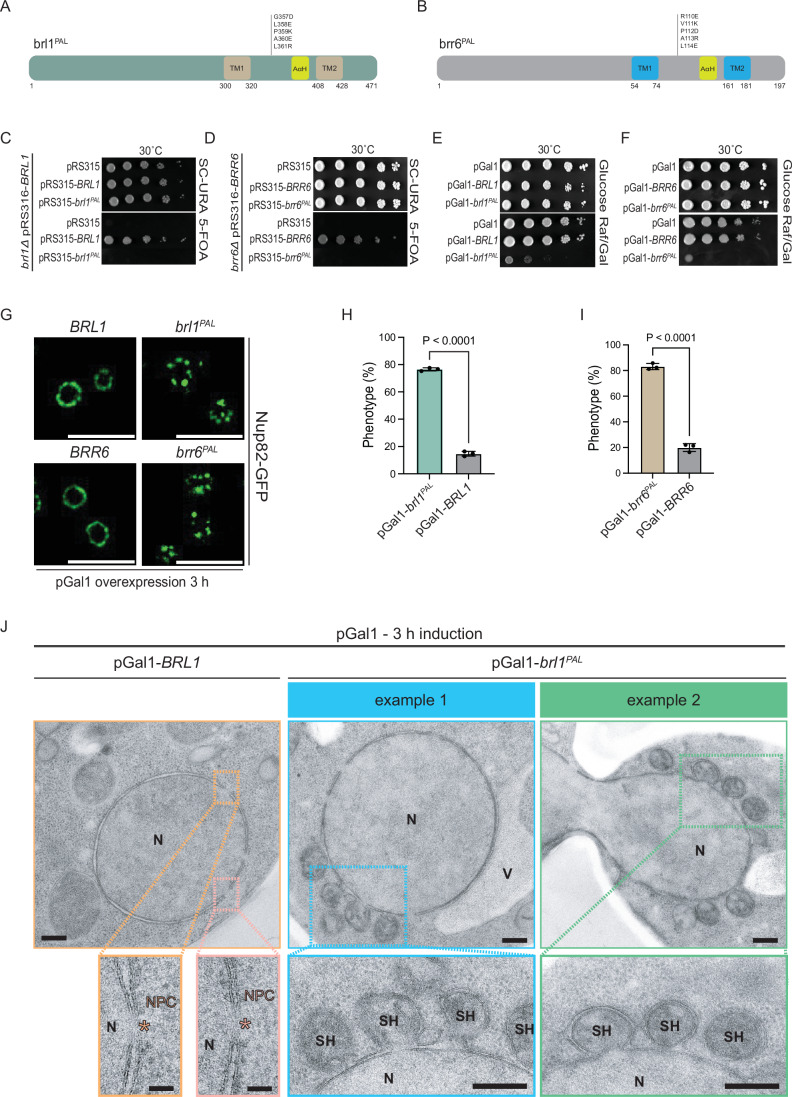
Figure 7 The PAL motif of Brl1 and Brr6 is essential for INM and ONM fusion. (A, B) Summary of the mutations that were introduced in the Brl1 and Brr6 PAL mutant proteins. (C, D) The brl1PAL and brr6PAL mutants are non-functional. BRL1 and BRR6 shuffle strains were transformed with the indicated LEU2-based pRS315 plasmids. Tenfold serial dilutions of transformants were tested for growth on SC–URA and 5-FOA plates. Three independent experiments; one representative image is shown. (E, F) The indicated pGal1 plasmids were transformed into wild-type yeast cells. Tenfold serial dilutions of transformants were grown with the repressing glucose or the inducing galactose at 30 °C, respectively. One representative of three independent experiments is shown. (G) Expression of pGal1-BRL1, pGal1-brl1PAL, pGal1-BRR6, or pGal1-brr6PAL were induced in yeast strains carrying NUP82-GFP for 3 h at 30 °C by the addition of galactose and analyzed by fluorescence microscopy. Images are representative of three independent experiments. Size bar: 5 µm. (H, I) Quantification of the fluorescence data shown in (G). Data are pooled from three independent experiments; the total number of analyzed cells are 177 and 182 for pGal1-BRL1 and pGal1-brl1PAL, respectively (H); the total number of analyzed cells are 195 and 224 for pGal1-BRR6 and pGal1-brr6PAL, respectively (I). Statistical test: unpaired two-tailed t test. Data shows mean with SD. P = 8.4E-7 for the statistical significance between pGal1-brl1PAL and pGal1-BRL1 condition (H); P = 9.6E-6 for the statistical significance between pGal1-brr6PAL and pGal1-BRR6 condition (I). (J) EM analysis of cells expressing pGal1-BRL1 or pGal1-brl1PAL using the same conditions as in (G) revealed accumulation of superherniations at the NE. The pGal1-BRR6 and pGal1-brr6PAL data are shown in Fig. EV3. Representative EM images are shown. Size Bars: 200 nm in the row showing nuclei; 50 nm in the enlargements with the NPCs; 200 nm in the enlargements showing the superherniations (SH). The pink asterisks highlight NPCs in pGal1-BRL1 cells. N nucleus, V vacuole, NPC nuclear pore complex, SH superherniation. Source data are available online for this figure.
Figure 7 The PAL motif of Brl1 and Brr6 is essential for INM and ONM fusion. (A, B) Summary of the mutations that were introduced in the Brl1 and Brr6 PAL mutant proteins. (C, D) The brl1PAL and brr6PAL mutants are non-functional. BRL1 and BRR6 shuffle strains were transformed with the indicated LEU2-based pRS315 plasmids. Tenfold serial dilutions of transformants were tested for growth on SC–URA and 5-FOA plates. Three independent experiments; one representative image is shown. (E, F) The indicated pGal1 plasmids were transformed into wild-type yeast cells. Tenfold serial dilutions of transformants were grown with the repressing glucose or the inducing galactose at 30 °C, respectively. One representative of three independent experiments is shown. (G) Expression of pGal1-BRL1, pGal1-brl1PAL, pGal1-BRR6, or pGal1-brr6PAL were induced in yeast strains carrying NUP82-GFP for 3 h at 30 °C by the addition of galactose and analyzed by fluorescence microscopy. Images are representative of three independent experiments. Size bar: 5 µm. (H, I) Quantification of the fluorescence data shown in (G). Data are pooled from three independent experiments; the total number of analyzed cells are 177 and 182 for pGal1-BRL1 and pGal1-brl1PAL, respectively (H); the total number of analyzed cells are 195 and 224 for pGal1-BRR6 and pGal1-brr6PAL, respectively (I). Statistical test: unpaired two-tailed t test. Data shows mean with SD. P = 8.4E-7 for the statistical significance between pGal1-brl1PAL and pGal1-BRL1 condition (H); P = 9.6E-6 for the statistical significance between pGal1-brr6PAL and pGal1-BRR6 condition (I). (J) EM analysis of cells expressing pGal1-BRL1 or pGal1-brl1PAL using the same conditions as in (G) revealed accumulation of superherniations at the NE. The pGal1-BRR6 and pGal1-brr6PAL data are shown in Fig. EV3. Representative EM images are shown. Size Bars: 200 nm in the row showing nuclei; 50 nm in the enlargements with the NPCs; 200 nm in the enlargements showing the superherniations (SH). The pink asterisks highlight NPCs in pGal1-BRL1 cells. N nucleus, V vacuole, NPC nuclear pore complex, SH superherniation. Source data are available online for this figure.CC BY · PubMed Central
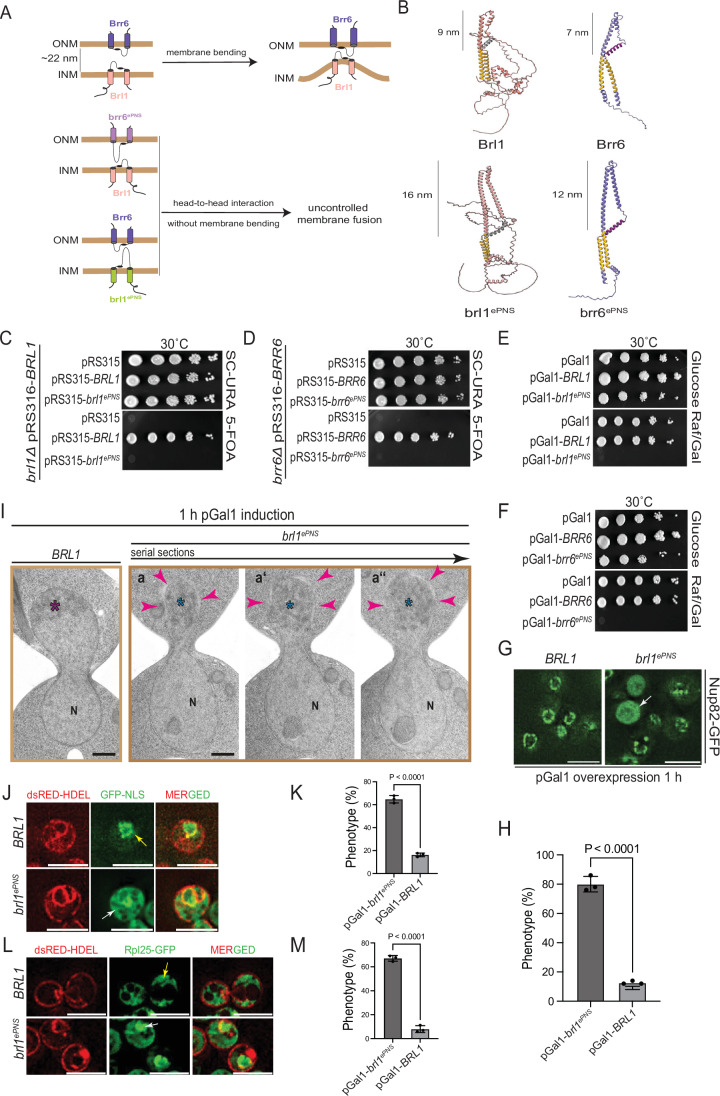
Figure 8 Brl1 and Brr6 promote NE fusion. (A) Model illustrating the length-dependent interaction of the DAHs of Brl1 and Brr6 bridging the perinuclear space region. (B) AlphaFold structural predictions of the extended regions of Brl1 (brl1ePNS) and Brr6 (brr6ePNS) in comparison to wild-type Brl1 and Brr6. The lengths of the PNS domains were determined using AlphaFold predictions. (C, D) brl1ePNS and brr6ePNS constructs are non-functional in a plasmid shuffle assay at 30 °C, whereas wild-type BRL1 and BRR6 are functional. Tenfold serial dilutions; three independent experiments. (E, F) Overexpression of pGal1-brl1ePNS and pGal1-brr6ePNS is toxic to cells, while overexpression of wild-type BRL1 and BRR6 does not affect cell growth. Tenfold serial dilutions; three independent experiments. (G) pGal1-BRL1 and pGal1-brl1ePNS were expressed in NUP82-GFP cells following 1 h galactose induction. Localization of Nup82-GFP was analyzed by fluorescence microscopy. The arrow highlights a cell with uniform Nup82-GFP staining. Three independent experiments. Size bars: 5 µm. Note, the corresponding experiment with pGal1-brr6ePNS and pGal1-BRR6 is shown in Fig. EV5. (H) Quantification of (G). Total number of analyzed cells: 150 each for both pGal1-BRL1 and pGal1-brl1ePNS; statistical test: unpaired two-tailed t test. Data show mean with SD; (P = 2.7E-5). (I) EM analysis of cells expressing pGal1-BRL1 or pGal1-brl1ePNS after 1 h of galactose induction. (a–a”) show 80 nm serial sections of the same anaphase cell. Arrowheads indicate regions of the NE undergoing disintegration. Purple asterisk marks compact chromatin; blue asterisks denote decondensed chromatin adjacent to disintegrating NE regions. N nucleus. Size bar: 500 nm. The corresponding experiment with pGal1-BRR6 and pGal1-brr6ePNS is shown in Fig. EV5C. Fig. EV5D shows EM analysis of pGal1-BRL1, pGal1-brl1ePNS, pGal1-BRR6 and pGal1-brr6ePNS cells in interphase. (J) pGal1-brl1ePNS overexpression affects localization of GFP–NLS in the nucleus. dsRED-HDEL GFP-NLS cells with pGal1-BRL1 or pGal1-brl1ePNS were incubated for 1 h with galactose. Localization of GFP–NLS was analyzed by fluorescence microscopy. The yellow arrow indicates nuclear localization of GFP–NLS; the white arrowhead indicates cytoplasmic localization. (K) Cells from (J) were quantified for the localization of GFP–NLS. Three independent experiments with total number of analyzed cells 224 and 221 for pGal1-BRL1 and pGal1-brl1ePNS, respectively; Statistical test: unpaired two-tailed t test. Data shows mean with SD (P = 2.1E-5). (L) As (J) but with dsRED-HDEL RPL25-GFP cells. The yellow arrow indicates cytoplasmic Rpl25–GFP; the white arrow indicates nuclear Rpl25–GFP. (M) Cells from (L) were quantified for the localization of Rpl25–GFP. Three independent experiments with total no. of analyzed cells 238 and 272 for pGal1-BRL1 and pGal1-brl1ePNS, respectively; Statistical test: unpaired two-tailed t test. Data shows mean with SD (P = 1.0E-5). Source data are available online for this figure.
Figure 8 Brl1 and Brr6 promote NE fusion. (A) Model illustrating the length-dependent interaction of the DAHs of Brl1 and Brr6 bridging the perinuclear space region. (B) AlphaFold structural predictions of the extended regions of Brl1 (brl1ePNS) and Brr6 (brr6ePNS) in comparison to wild-type Brl1 and Brr6. The lengths of the PNS domains were determined using AlphaFold predictions. (C, D) brl1ePNS and brr6ePNS constructs are non-functional in a plasmid shuffle assay at 30 °C, whereas wild-type BRL1 and BRR6 are functional. Tenfold serial dilutions; three independent experiments. (E, F) Overexpression of pGal1-brl1ePNS and pGal1-brr6ePNS is toxic to cells, while overexpression of wild-type BRL1 and BRR6 does not affect cell growth. Tenfold serial dilutions; three independent experiments. (G) pGal1-BRL1 and pGal1-brl1ePNS were expressed in NUP82-GFP cells following 1 h galactose induction. Localization of Nup82-GFP was analyzed by fluorescence microscopy. The arrow highlights a cell with uniform Nup82-GFP staining. Three independent experiments. Size bars: 5 µm. Note, the corresponding experiment with pGal1-brr6ePNS and pGal1-BRR6 is shown in Fig. EV5. (H) Quantification of (G). Total number of analyzed cells: 150 each for both pGal1-BRL1 and pGal1-brl1ePNS; statistical test: unpaired two-tailed t test. Data show mean with SD; (P = 2.7E-5). (I) EM analysis of cells expressing pGal1-BRL1 or pGal1-brl1ePNS after 1 h of galactose induction. (a–a”) show 80 nm serial sections of the same anaphase cell. Arrowheads indicate regions of the NE undergoing disintegration. Purple asterisk marks compact chromatin; blue asterisks denote decondensed chromatin adjacent to disintegrating NE regions. N nucleus. Size bar: 500 nm. The corresponding experiment with pGal1-BRR6 and pGal1-brr6ePNS is shown in Fig. EV5C. Fig. EV5D shows EM analysis of pGal1-BRL1, pGal1-brl1ePNS, pGal1-BRR6 and pGal1-brr6ePNS cells in interphase. (J) pGal1-brl1ePNS overexpression affects localization of GFP–NLS in the nucleus. dsRED-HDEL GFP-NLS cells with pGal1-BRL1 or pGal1-brl1ePNS were incubated for 1 h with galactose. Localization of GFP–NLS was analyzed by fluorescence microscopy. The yellow arrow indicates nuclear localization of GFP–NLS; the white arrowhead indicates cytoplasmic localization. (K) Cells from (J) were quantified for the localization of GFP–NLS. Three independent experiments with total number of analyzed cells 224 and 221 for pGal1-BRL1 and pGal1-brl1ePNS, respectively; Statistical test: unpaired two-tailed t test. Data shows mean with SD (P = 2.1E-5). (L) As (J) but with dsRED-HDEL RPL25-GFP cells. The yellow arrow indicates cytoplasmic Rpl25–GFP; the white arrow indicates nuclear Rpl25–GFP. (M) Cells from (L) were quantified for the localization of Rpl25–GFP. Three independent experiments with total no. of analyzed cells 238 and 272 for pGal1-BRL1 and pGal1-brl1ePNS, respectively; Statistical test: unpaired two-tailed t test. Data shows mean with SD (P = 1.0E-5). Source data are available online for this figure.CC BY · PubMed Central
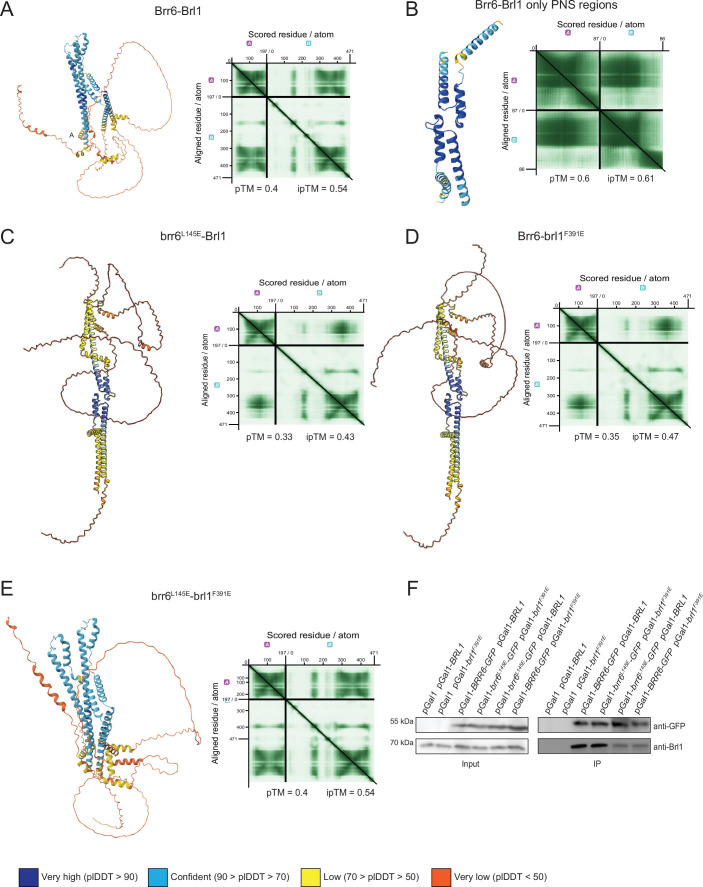
Figure EV1 AlphaFold predictions of Brr6-Brl1 interactions. Extension of Fig. 1. (A) AlphaFold predicts full-lenh Brr6–Brl1 interactions mediated by the two AαH domains. The pTM and ipTM scores are indicated. (B) AlphaFold using the PNS domains predicts DAH/PAL region Brr6–Brl1 interactions. The pTM and ipTM scores are indicated. (C) AlphaFold predicts full-length brr6L145E–Brl1 interactions via DAH/PAL but not the AαH domains. The pTM and ipTM scores are indicated. (D) AlphaFold predicts full-length Brr6–brl1F391E interactions via DAH/PAL but not the AαH domains. The pTM and ipTM scores are indicated. (E) AlphaFold predicts full-length brr6L145E–brl1F391E interactions mediated by the two AαH domains. The pTM and pTM scores are indicated. (F) Immunoprecipitation experiment of brl1 and brr6 mutant proteins. Cells expressing the indicated BRL1 and BRR6 constructs were lysed and the Brl1-Brr6 interaction was analyzed by immunoprecipitation using GFP-binder. The immunoprecipitation was analyzed by immunoblotting with the indicated antibodies. Three independent experiments, one representative is shown. Source data are available online for this figure.
Figure EV1 AlphaFold predictions of Brr6-Brl1 interactions. Extension of Fig. 1. (A) AlphaFold predicts full-lenh Brr6–Brl1 interactions mediated by the two AαH domains. The pTM and ipTM scores are indicated. (B) AlphaFold using the PNS domains predicts DAH/PAL region Brr6–Brl1 interactions. The pTM and ipTM scores are indicated. (C) AlphaFold predicts full-length brr6L145E–Brl1 interactions via DAH/PAL but not the AαH domains. The pTM and ipTM scores are indicated. (D) AlphaFold predicts full-length Brr6–brl1F391E interactions via DAH/PAL but not the AαH domains. The pTM and ipTM scores are indicated. (E) AlphaFold predicts full-length brr6L145E–brl1F391E interactions mediated by the two AαH domains. The pTM and pTM scores are indicated. (F) Immunoprecipitation experiment of brl1 and brr6 mutant proteins. Cells expressing the indicated BRL1 and BRR6 constructs were lysed and the Brl1-Brr6 interaction was analyzed by immunoprecipitation using GFP-binder. The immunoprecipitation was analyzed by immunoblotting with the indicated antibodies. Three independent experiments, one representative is shown. Source data are available online for this figure.CC BY · PubMed Central
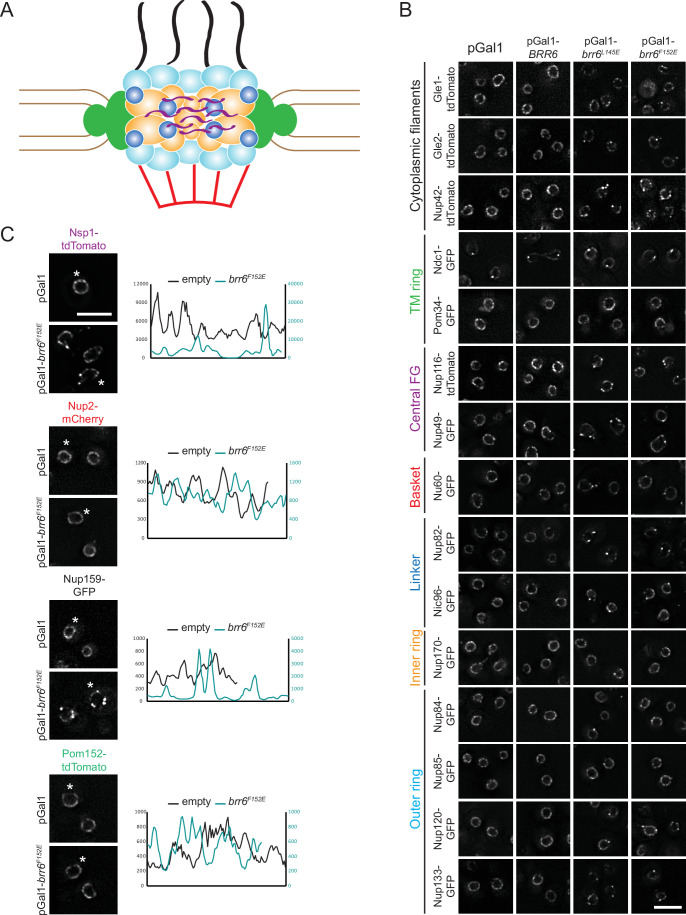
Figure EV2 Analysis of brr6L145E and brr6F152E overexpression phenotypes. Extension of Fig. 3. (A) Schematic representation of the NPC with color-coded components: transmembrane ring (green), central FG-Nups (purple), nuclear basket Nups (red), linker Nups (blue), inner ring Nups (ochre), and outer ring Nups (light blue). (B) As in Fig. 3A using the indicated yeast strains expressing tdTomato- and GFP-tagged Nup constructs. Cells additionally carried pGal1, pGal1-BRR6, pGal1-brr6L145E, or pGal1-brr6F152E, which were overexpressed for 3 h. See Fig. 3B for quantification of the phenotypes. Size bar: 5 µm. (C) Overexpression of brr6F152E alters NE localization of Nsp1 and Nup159, whereas Nup2 and Pom152 are only minimally affected. Line scans on the right show NE distribution of the indicated Nups in cells carrying either empty pGal1 or pGal1-brr6F152E plasmids. The cell that was selected for line scan is indicated by an asterisk. Cells were incubated for 3 h in raffinose/galactose medium to induce expression from the pGal1 promoter. Note, the NSP1-tdTomato pGal1-brr6F152E cells (top) are identical to the cells in Fig. 3A (first column). Size bar: 5 µm. Source data are available online for this figure.
Figure EV2 Analysis of brr6L145E and brr6F152E overexpression phenotypes. Extension of Fig. 3. (A) Schematic representation of the NPC with color-coded components: transmembrane ring (green), central FG-Nups (purple), nuclear basket Nups (red), linker Nups (blue), inner ring Nups (ochre), and outer ring Nups (light blue). (B) As in Fig. 3A using the indicated yeast strains expressing tdTomato- and GFP-tagged Nup constructs. Cells additionally carried pGal1, pGal1-BRR6, pGal1-brr6L145E, or pGal1-brr6F152E, which were overexpressed for 3 h. See Fig. 3B for quantification of the phenotypes. Size bar: 5 µm. (C) Overexpression of brr6F152E alters NE localization of Nsp1 and Nup159, whereas Nup2 and Pom152 are only minimally affected. Line scans on the right show NE distribution of the indicated Nups in cells carrying either empty pGal1 or pGal1-brr6F152E plasmids. The cell that was selected for line scan is indicated by an asterisk. Cells were incubated for 3 h in raffinose/galactose medium to induce expression from the pGal1 promoter. Note, the NSP1-tdTomato pGal1-brr6F152E cells (top) are identical to the cells in Fig. 3A (first column). Size bar: 5 µm. Source data are available online for this figure.CC BY · PubMed Central
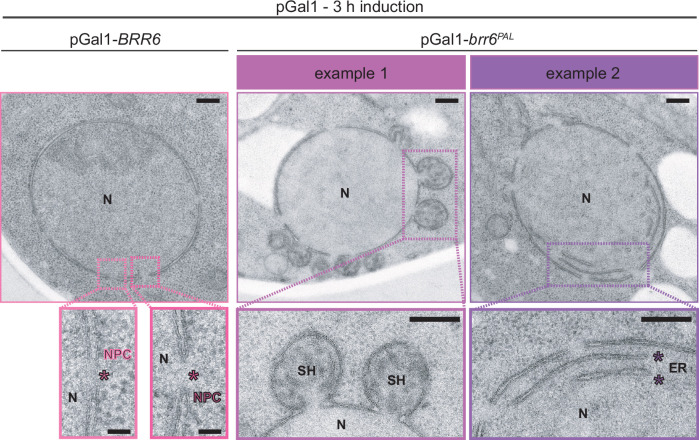
Figure EV3 Phenotypes of brr6PAL mutant overexpression. Extension of Fig. 7. EM analysis of cells overexpressing pGal1-BRR6 or pGal1-brr6PAL using the same conditions as in Fig. 7J revealed accumulation of superherniations (SH) at the NE. The pGal1-BRL1 or pGal1-brl1PAL data are shown in Fig. 7J. Representative EM images are shown. Size Bars: 200 nm in the row showing nuclei; 50 nm in the enlargements with the NPCs; 200 nm in the enlargements showing the superherniations (SH) or ER inside the nucleus (example 2; purple asterisk). The pink asterisks highlight NPCs in pGal1-BRR6 cells. ER endoplasmic reticulum, N nucleus, NPC nuclear pore complex, SH superherniation. Source data are available online for this figure.
Figure EV3 Phenotypes of brr6PAL mutant overexpression. Extension of Fig. 7. EM analysis of cells overexpressing pGal1-BRR6 or pGal1-brr6PAL using the same conditions as in Fig. 7J revealed accumulation of superherniations (SH) at the NE. The pGal1-BRL1 or pGal1-brl1PAL data are shown in Fig. 7J. Representative EM images are shown. Size Bars: 200 nm in the row showing nuclei; 50 nm in the enlargements with the NPCs; 200 nm in the enlargements showing the superherniations (SH) or ER inside the nucleus (example 2; purple asterisk). The pink asterisks highlight NPCs in pGal1-BRR6 cells. ER endoplasmic reticulum, N nucleus, NPC nuclear pore complex, SH superherniation. Source data are available online for this figure.CC BY · PubMed Central
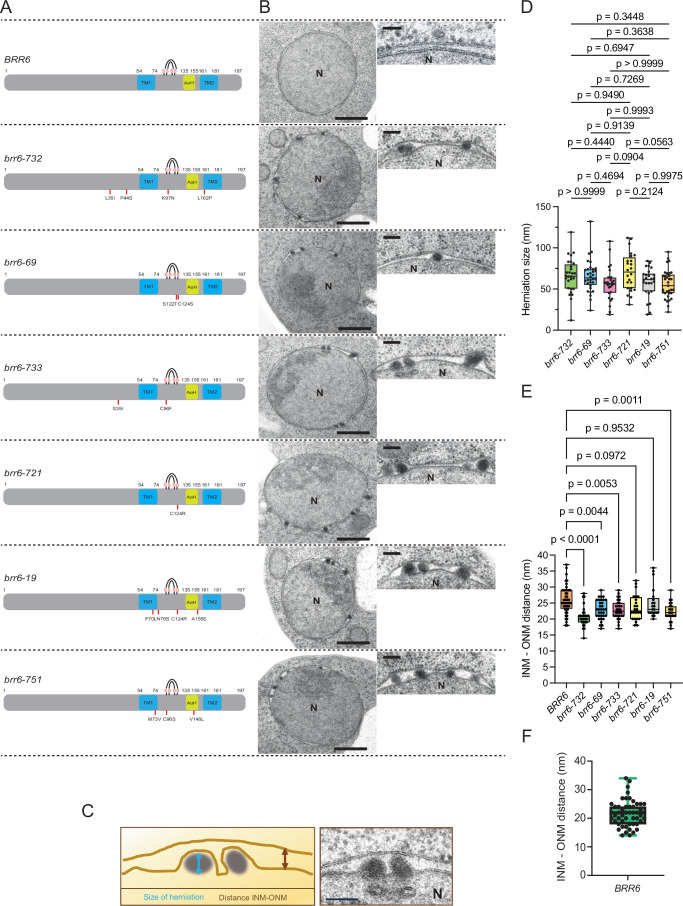
Figure EV4 Brr6 also functions in INM/ONM fusion during NPC biogenesis. Extension of Fig. 7. (A) Overview of conditional lethal brr6(ts) alleles generated by mutagenic PCR (Zhang et al, 2018). The resulting brr6(ts) alleles were verified by sequencing and integrated into the endogenous BRR6 locus using a pop-in pop-out strategy (Rothstein, 1991). The amino acid substitutions in the various brr6(ts) alleles are indicated. TM, AαH, and the four cysteines involved in disulfide bridge formation are also marked. Note, these mutants were previously only analyzed in the context of benzyl alcohol sensitivity (Zhang et al, 2018). (B) The wild-type and brr6(ts) mutants were shifted to 37 °C for 3 h, and their phenotype was analyzed by thin-section EM. All brr6(ts) mutants accumulated herniations at the NE. N nucleus. Size bar: 500 nm; magnified inset: 50 nm. (C) Scheme for the analysis of wild-type and brr6(ts) mutant cells. Size bar: 100 nm. Note that the micrograph next to the schematic is a re-display of a section from (B) for illustrative purposes. (D, E) Herniation size (D) and random INM–ONM distance (E) away from herniations were measured from EM sections in (B). In wild-type cells, INM–ONM distances were measured randomly away from NPCs. (D) The size of 24, 32, 28, 24, 26 and 33 herniations from 11, 10, 10, 8, 7, 8 cell sections of brr6-732, brr6-69, brr6-733, brr6-721, brr6-19 and brr6-751 cells was measured. (E) The INM–ONM distance from 16, 11, 11, 10, 8, 7 and 8 cell sections with three measurement per section was determined. Statistical test: One-way ANOVA. Box and Whisker plots shows median with interquartile range. P = 2.2E-8 for the statistical significance between BRR6 and brr6-732 condition (E). (F) The distance between the INM and ONM in wild-type cells grown at 30 °C was measured by EM. INM–ONM distances were measured randomly away from NPCs. Ultrathin sections from 16 cells with four measurement per section were analyzed, revealing an average INM–ONM spacing of 22 nm. Data shows median with interquartile range. Source data are available online for this figure.
Figure EV4 Brr6 also functions in INM/ONM fusion during NPC biogenesis. Extension of Fig. 7. (A) Overview of conditional lethal brr6(ts) alleles generated by mutagenic PCR (Zhang et al, 2018). The resulting brr6(ts) alleles were verified by sequencing and integrated into the endogenous BRR6 locus using a pop-in pop-out strategy (Rothstein, 1991). The amino acid substitutions in the various brr6(ts) alleles are indicated. TM, AαH, and the four cysteines involved in disulfide bridge formation are also marked. Note, these mutants were previously only analyzed in the context of benzyl alcohol sensitivity (Zhang et al, 2018). (B) The wild-type and brr6(ts) mutants were shifted to 37 °C for 3 h, and their phenotype was analyzed by thin-section EM. All brr6(ts) mutants accumulated herniations at the NE. N nucleus. Size bar: 500 nm; magnified inset: 50 nm. (C) Scheme for the analysis of wild-type and brr6(ts) mutant cells. Size bar: 100 nm. Note that the micrograph next to the schematic is a re-display of a section from (B) for illustrative purposes. (D, E) Herniation size (D) and random INM–ONM distance (E) away from herniations were measured from EM sections in (B). In wild-type cells, INM–ONM distances were measured randomly away from NPCs. (D) The size of 24, 32, 28, 24, 26 and 33 herniations from 11, 10, 10, 8, 7, 8 cell sections of brr6-732, brr6-69, brr6-733, brr6-721, brr6-19 and brr6-751 cells was measured. (E) The INM–ONM distance from 16, 11, 11, 10, 8, 7 and 8 cell sections with three measurement per section was determined. Statistical test: One-way ANOVA. Box and Whisker plots shows median with interquartile range. P = 2.2E-8 for the statistical significance between BRR6 and brr6-732 condition (E). (F) The distance between the INM and ONM in wild-type cells grown at 30 °C was measured by EM. INM–ONM distances were measured randomly away from NPCs. Ultrathin sections from 16 cells with four measurement per section were analyzed, revealing an average INM–ONM spacing of 22 nm. Data shows median with interquartile range. Source data are available online for this figure.CC BY · PubMed Central
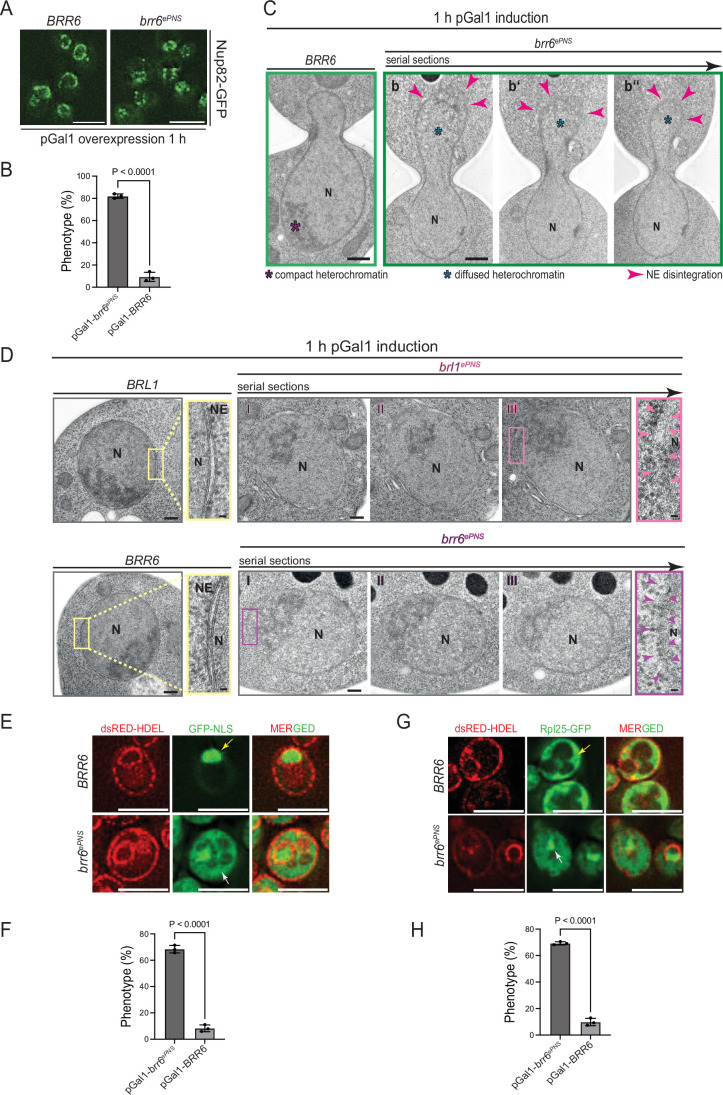
Figure EV5 Phenotypes of brr6ePNS overexpression. Extension of Fig. 8. (A) Analysis of pGal1-BRR6 and pGal1-brr6ePNS cells carrying NUP82-GFP. Localization of Nup82-GFP was analyzed by fluorescence microscopy. Three independent experiments. Size bars: 5 µm. Note, the corresponding experiment with pGal1-BRL1 and pGal1-brl1ePNS is shown in Fig. 8G. (B) Quantification of (A). Total number of analyzed cells: 150 each for both pGal1-BRR6 and pGal1-brr6ePNS; Statistical test: unpaired two-tailed t test. Data represent the mean ± SD from three independent experiments; (P = 1.1E-5). (C) EM analysis of cells expressing pGal1-BRR6 or pGal1-brr6ePNS after 1 h of galactose induction. Panels b–b” show 80 nm serial sections of the same anaphase cell. Red arrowheads indicate regions of the NE undergoing disintegration. Purple asterisk marks compact chromatin; blue asterisks denote decondensed chromatin adjacent to disintegrating NE regions. N nucleus. Size bars: 500 nm. The corresponding experiment with pGal1-BRL1 and pGal1-brl1ePNS is shown in Fig. 8I. (D) Shows EM analysis of pGal1-BRL1, pGal1-brl1ePNS, pGal1-BRR6 and pGal1-brr6ePNS cells in interphase. I-III indicates serial sections. Arrowheads in enlargements show disintegrated NE. Size bars: 500 nm; enlargements 25 nm. N nucleus, NE nuclear envelope. (E) pGal1-brr6ePNS overexpression affects localization of GFP–NLS in the nucleus. GFP-NLS dsRED-HDEL cells with pGal1-BRL1 or pGal1-brl1ePNS were incubated for 1 h with galactose. Localization of GFP–NLS was analyzed by fluorescence microscopy. Size bar: 5 µm. The yellow arrow indicates GFP–NLS in the nucleus; the white arrow NLS-GFP in the cytoplasm. (F) Cells from (E) were quantified for the localization of GFP–NLS. Three independent experiments with total number of analyzed cells 218 and 216 for pGal1-BRR6 and pGal1-brr6ePNS, respectively. Statistical test: unpaired two-tailed t test. Data shows mean with SD; (P = 1.13E-5). (G) As (E) but with dsRED-HDEL RPL25-GFP cells. The yellow arrow indicates Rpl25–GFP in the cytoplasm. The white arrow indicates Rpl25–GFP in the nucleus. Size bars: 5 µm. (H) Cells from (G) were quantified for the localization of Rpl25–GFP. Three independent experiments with total number of analyzed cells 281 and 311 for pGal1-BRR6 and pGal1-brr6ePNS, respectively. Statistical test: unpaired two-tailed t test. Data shows mean with SD (P = 4.5E-6). Source data are available online for this figure.
Figure EV5 Phenotypes of brr6ePNS overexpression. Extension of Fig. 8. (A) Analysis of pGal1-BRR6 and pGal1-brr6ePNS cells carrying NUP82-GFP. Localization of Nup82-GFP was analyzed by fluorescence microscopy. Three independent experiments. Size bars: 5 µm. Note, the corresponding experiment with pGal1-BRL1 and pGal1-brl1ePNS is shown in Fig. 8G. (B) Quantification of (A). Total number of analyzed cells: 150 each for both pGal1-BRR6 and pGal1-brr6ePNS; Statistical test: unpaired two-tailed t test. Data represent the mean ± SD from three independent experiments; (P = 1.1E-5). (C) EM analysis of cells expressing pGal1-BRR6 or pGal1-brr6ePNS after 1 h of galactose induction. Panels b–b” show 80 nm serial sections of the same anaphase cell. Red arrowheads indicate regions of the NE undergoing disintegration. Purple asterisk marks compact chromatin; blue asterisks denote decondensed chromatin adjacent to disintegrating NE regions. N nucleus. Size bars: 500 nm. The corresponding experiment with pGal1-BRL1 and pGal1-brl1ePNS is shown in Fig. 8I. (D) Shows EM analysis of pGal1-BRL1, pGal1-brl1ePNS, pGal1-BRR6 and pGal1-brr6ePNS cells in interphase. I-III indicates serial sections. Arrowheads in enlargements show disintegrated NE. Size bars: 500 nm; enlargements 25 nm. N nucleus, NE nuclear envelope. (E) pGal1-brr6ePNS overexpression affects localization of GFP–NLS in the nucleus. GFP-NLS dsRED-HDEL cells with pGal1-BRL1 or pGal1-brl1ePNS were incubated for 1 h with galactose. Localization of GFP–NLS was analyzed by fluorescence microscopy. Size bar: 5 µm. The yellow arrow indicates GFP–NLS in the nucleus; the white arrow NLS-GFP in the cytoplasm. (F) Cells from (E) were quantified for the localization of GFP–NLS. Three independent experiments with total number of analyzed cells 218 and 216 for pGal1-BRR6 and pGal1-brr6ePNS, respectively. Statistical test: unpaired two-tailed t test. Data shows mean with SD; (P = 1.13E-5). (G) As (E) but with dsRED-HDEL RPL25-GFP cells. The yellow arrow indicates Rpl25–GFP in the cytoplasm. The white arrow indicates Rpl25–GFP in the nucleus. Size bars: 5 µm. (H) Cells from (G) were quantified for the localization of Rpl25–GFP. Three independent experiments with total number of analyzed cells 281 and 311 for pGal1-BRR6 and pGal1-brr6ePNS, respectively. Statistical test: unpaired two-tailed t test. Data shows mean with SD (P = 4.5E-6). Source data are available online for this figure.CC BY · PubMed Central

Verification

Claims the paper makes

The claims and statistics of this paper haven’t been checked yet.

Run the check — free, no account needed. It reads the open-access text and checks the sources it cites.

A few free checks a day · papers already verified open instantly · results are public

Self-check

Percentages, sums and reported differences re-computed from the paper’s own numbers.

The self-check needs the paper’s full text.

Citations

Cites

Research works printed but not linked: 1

  1. Fischer JS, Wojtynek M, Kumar A, Baird H, Radilová K, Maslennikova D, Ramachandran K, Becker AN, Agote-Aran A, Loffreda A, et al (2025) A conserved mechanism of membrane fusion in nuclear pore complex assembly. Preprint at bioRxiv https://doi.org/10.1101/2025.07.21.665908 · DOI

Metadata

Authors
Mondal, S., Neuner, A., Khan, A. A., Vitale, J., & Schiebel, E.
Affiliations
German Cancer Research Center (DE)
Corresponding author
  • Khan, Azqa Ajmal
  • Schiebel, Elmar
Venue
The EMBO Journal
Published
2026-02-16
Volume
45
Issue
7
Pages
2370-2399
ISSN
  • 0261-4189 (ISSN-L)
  • 1460-2075
OpenAlex
W7129033339
Cited by
5
References
43
Citations by year
2026: 5
FWCI
10.22
Type
journal article
Language
en
Open access
Licence
Locations
  • The EMBO Journal (publishedVersion, cc-by)
  • bioRxiv (Cold Spring Harbor Laboratory) (acceptedVersion)
  • PubMed (publishedVersion)
  • PubMed Central (publishedVersion, cc-by)
  • DOAJ (DOAJ: Directory of Open Access Journals) (submittedVersion, cc-by-sa)
Funders
Deutsche Forschungsgemeinschaft (CRC 1638)
Topics
  • Life Sciences › Biochemistry, Genetics and Molecular Biology › Molecular Biology › Nuclear Structure and Function
  • Life Sciences › Biochemistry, Genetics and Molecular Biology › Cell Biology › Microtubule and mitosis dynamics
  • Life Sciences › Biochemistry, Genetics and Molecular Biology › Molecular Biology › Fungal and yeast genetics research
Keywords
nuclear pore complex assembly, perinuclear space, amphipathic helix, Saccharomyces cerevisiae
MeSH terms
Membrane Fusion, Membrane Proteins, Nuclear Envelope, Saccharomyces cerevisiae, Nuclear Pore, Nuclear Pore Complex Proteins, Saccharomyces cerevisiae Proteins

About these checks

Registry, retraction, Cites and statistics results are computed, not judged, with one exception: a printed reference that no index lists is read once by a model before it counts as a citation error. Claims are extracted by a model and kept only when their quote appears verbatim in the text; each cited source is then checked, with a model’s help, for whether it says what the claim relies on. Those verdicts can be wrong — read the claim’s quote and the cited source before relying on one.

Statistics and arithmetic are recomputed, not judged.

Confidence bands are shown only for fields calibrated on our annotated test set. None is calibrated yet, so no band is shown.

What counts as a claim ›How we measure confidence ›How we check this ›

Are you an author, or do you see a problem with this page? Request a review

Data sources

Bibliographic data: Semantic Scholar, OpenAlex, Crossref.

Contains information from the Semantic Scholar Academic Graph Datasets, made available under the ODC Attribution License (ODC-BY 1.0).

Semantic Scholar’s data is described in: Kinney, R., et al. (2023). The Semantic Scholar Open Data Platform. arXiv:2301.10140.