

Chemerin regulates β-cell function in mice
Open accessThe DOI matches its Crossref record; 37 of the 37 references it cites were found in a registry or an index.
Abstract
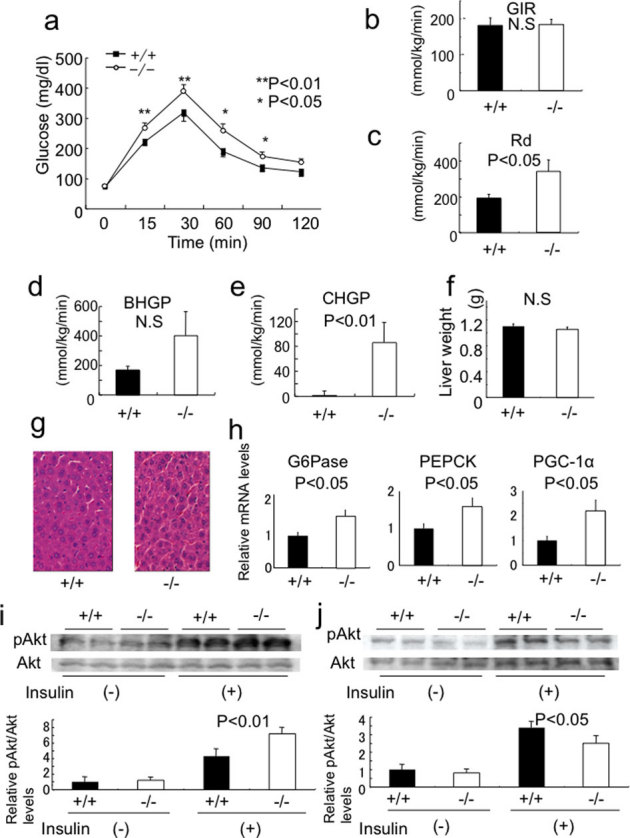
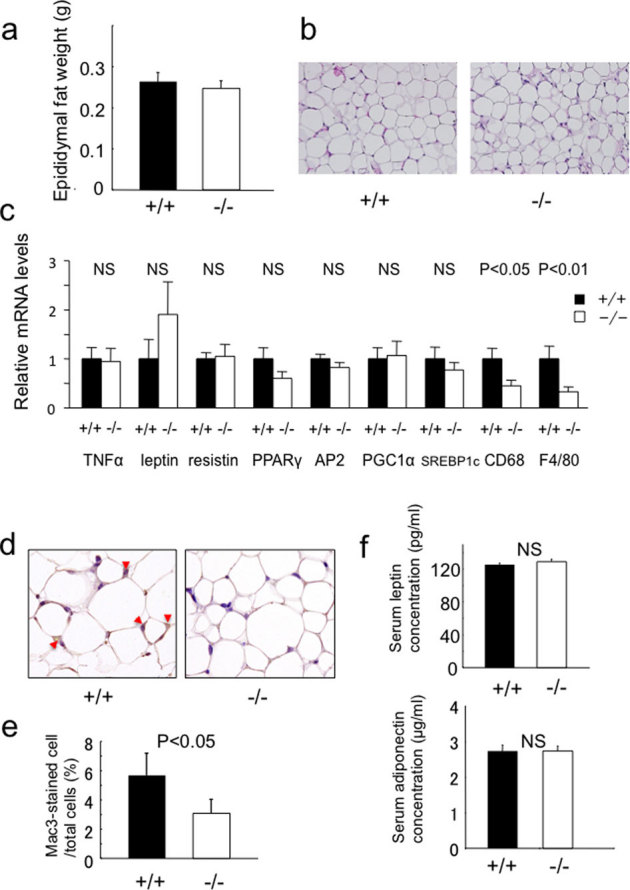
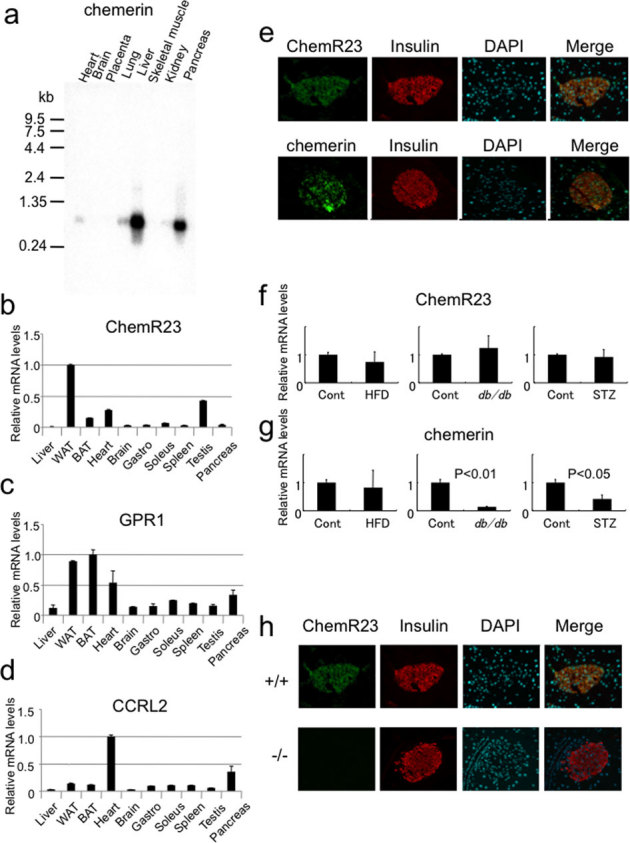
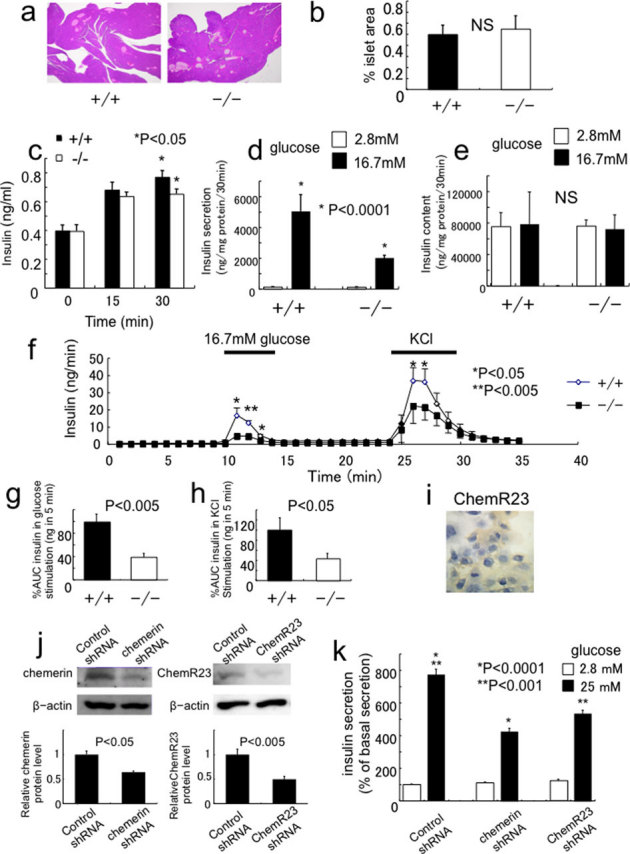
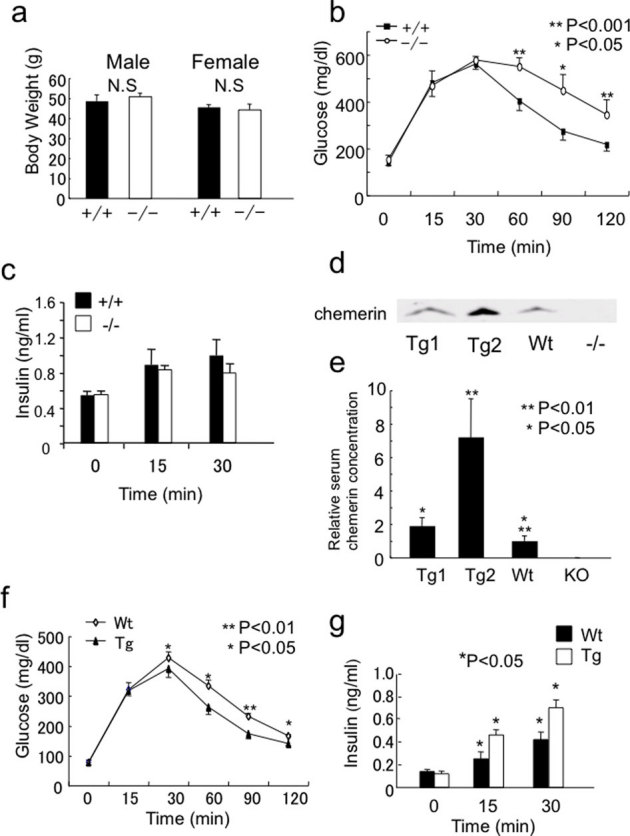
Although various function of chemerin have been suggested, its physiological role remains to be elucidated. Here we show that chemerin-deficient mice are glucose intolerant irrespective of exhibiting reduced macrophage accumulation in adipose tissue. The glucose intolerance was mainly due to increased hepatic glucose production and impaired insulin secretion. Chemerin and its receptor ChemR23 were expressed in β-cell. Studies using isolated islets and perfused pancreas revealed impaired glucose-dependent insulin secretion (GSIS) in chemerin-deficient mice. Conversely, chemerin transgenic mice revealed enhanced GSIS and improved glucose tolerance. Expression of MafA, a pivotal transcriptional factor for β-cell function, was downregulated in chemerin-deficient islets and a chemerin-ablated β-cell line and rescue of MafA expression restored GSIS, indicating that chemerin regulates β-cell function via maintaining MafA expression. These results indicate that chemerin regulates β-cell function and plays an important role in glucose homeostasis in a tissue-dependent manner.
Overview
The claims and statistics of this paper haven’t been checked yet.
Free: it reads the open-access text and checks the first 5 claims that cite a source we can check. Create a free account to check every claim.
Integrity signals
Registry
Cites
Statistics
Figures

Verification
Claims the paper makes
The claims and statistics of this paper haven’t been checked yet.
Free: it reads the open-access text and checks the first 5 claims that cite a source we can check. Create a free account to check every claim.
Claims other papers make about this one
Each is checked against this paper’s own text: does it say what the citing paper says it does?
The cited source says what the claim attributes to it.
In the citing paper
“Other adipokines, such as apelin,272, 273 chemerin,274, 275, 276 omentin,277, 278 resistin279 and visfatin,280, 281 were also shown to directly interact with insulin, whereas retinol-binding protein 4, tumor necrosis factor-α and vaspin are related to insulin in an indirect manner.282”
From Pancreatic regulation of glucose homeostasis. (2016) · cites this paper as [274]
Self-check
Percentages, sums and reported differences re-computed from the paper’s own numbers.
The self-check needs the paper’s full text.
Citations
Cites
Adipose Tissue as an Endocrine Organ
Kershaw, E. E., & Flier, J. S. (2004) · The Journal of Clinical Endocrinology & Metabolism · doi:10.1210/jc.2004-0395 · Cited by 5,522
Adipokines in inflammation and metabolic disease
Ouchi, N., Parker, J. L., Lugus, J. J., & Walsh, K. (2011) · Nature Reviews Immunology · doi:10.1038/nri2921 · Cited by 4,625
Adipose tissue, adipokines, and inflammation
Fantuzzi, G. (2005) · Journal of Allergy and Clinical Immunology · doi:10.1016/j.jaci.2005.02.023 · Cited by 2,606 · cited 1×
“Under these conditions, adipokines secreted from the adipose tissue play a pivotal rol”
BackgroundThe Biology of Chemokines and their Receptors
Rossi, D., & Zlotnik, A. (2000) · Annual Review of Immunology · doi:10.1146/annurev.immunol.18.1.217 · Cited by 2,410 · cited 1×
“Adipocytes also secrete inflammatory cytokines, such as tumor necrosis factor-a, interleukin-6 and monocyte chemotactic protein-1 (MCP-1) that are classically considered to be produced by macrophages, and link inflammation and insulin resistanc”
BackgroundIn vivo reprogramming of adult pancreatic exocrine cells to β-cells
Zhou, Q., Brown, J., Kanarek, A., Rajagopal, J., & Melton, D. A. (2008) · Nature · doi:10.1038/nature07314 · Cited by 2,010
MIYAZAKI, J.-I., ARAKI, K., YAMATO, E., IKEGAMI, H., ASANO, T., SHIBASAKI, Y., OKA, Y., & YAMAMURA, K.-I. (1990) · Endocrinology · doi:10.1210/endo-127-1-126 · Cited by 1,266
Wittamer, V., Franssen, J.-D., Vulcano, M., Mirjolet, J.-F., Le Poul, E., Migeotte, I., Brézillon, S., Tyldesley, R., Blanpain, C., Detheux, M., et al. (2003) · The Journal of Experimental Medicine · doi:10.1084/jem.20030382 · Cited by 888
Chemerin Is a Novel Adipokine Associated with Obesity and Metabolic Syndrome
Bozaoglu, K., Bolton, K., McMillan, J., Zimmet, P., Jowett, J., Collier, G., Walder, K., & Segal, D. (2007) · Endocrinology · doi:10.1210/en.2007-0175 · Cited by 858
Chemerin, a Novel Adipokine That Regulates Adipogenesis and Adipocyte Metabolism
Goralski, K. B., McCarthy, T. C., Hanniman, E. A., Zabel, B. A., Butcher, E. C., Parlee, S. D., Muruganandan, S., & Sinal, C. J. (2007) · Journal of Biological Chemistry · doi:10.1074/jbc.m700793200 · Cited by 857
Chemokines in the Pathogenesis of Vascular Disease
Charo, I. F., & Taubman, M. B. (2004) · Circulation Research · doi:10.1161/01.res.0000146672.10582.17 · Cited by 752
Research works printed but not linked: 1
- Ernst, M. C. & Sinal, C. J. Chemerin: at the crossroads of inflammation and obesity. Trends Endocrinol Metab 21, 660–667 (2010). · DOI · Paper page
Cited by
Items 101–165 of 165
CMKLR1 deficiency attenuates androgen-induced lipid accumulation in mice
Huang, B., Zhao, H., Huang, C., Wu, L., Xiang, L., Chen, J., Wang, B., Xiao, T., Li, M., Ren, L., et al. (2020) · American Journal of Physiology-Endocrinology and Metabolism · doi:10.1152/ajpendo.00176.2019 · Cited by 12
Fischer, J., Völzke, H., Kassubek, J., Müller, H., Kühn, J., Nauck, M. A., Friedrich, N., & Zylla, S. (2020) · Obesity · doi:10.1002/oby.22871 · Cited by 12
Chemerin as a Mediator of Hypertension and Cardiometabolic Diseases (A Comprehensive Review)
McMillan, R. K., & Kirabo, A. (2025) · Current Hypertension Reports · doi:10.1007/s11906-025-01354-3 · Cited by 12
Suzuki, Y., Haga, S., Nakano, M., Ishizaki, H., Nakano, M., Song, S. J., Katoh, K., & Roh, S. G. (2016) · Journal of Animal Science · doi:10.2527/jas.2016-0677 · Cited by 12
Aldharee, H., Makki, Y. R., & Hamdan, H. Z. (2025) · International Journal of Molecular Sciences · doi:10.3390/ijms26146622 · Cited by 12
Underrated enemy – from nonalcoholic fatty liver disease to cancers of the gastrointestinal tract
Derra, A., Bator, M., Menżyk, T., & Kukla, M. (2018) · Clinical and Experimental Hepatology · doi:10.5114/ceh.2018.75955 · Cited by 11
Dinarvand, N., Cheraghian, B., Rahimi, Z., Bavarsad, S. S., Bavarsad, A. H., & Mohammadtaghvaei, N. (2023) · Endocrinology Diabetes & Metabolism · doi:10.1002/edm2.401 · Cited by 11
Li, M., Sun, P., Dong, K., Ye, X., Tailulu, A., Li, Q., Sun, J., Peng, M., & Shi, P. (2021) · Archives of Pharmacal Research · doi:10.1007/s12272-021-01311-z · Cited by 10
Filgueiras, M. D. S., Pessoa, M. C., Bressan, J., de Albuquerque, F. M., Suhett, L. G., Silva, M. A., & de Novaes, J. F. (2021) · European Journal of Pediatrics · doi:10.1007/s00431-021-04040-z · Cited by 9
Mosavat, M., Mirsanjari, M., Lwaleed, B. A., Kamarudin, M., & Omar, S. Z. (2021) · Journal of Diabetes Research · doi:10.1155/2021/5533802 · Cited by 9
Adipokines in Nonalcoholic Fatty Liver Disease
Baranova, A. V., Birerdinc, A., & Younossi, Z. M. (2014) · Humana Press eBooks · doi:10.1007/978-1-62703-770-9_17 · Cited by 8
Positive association between the changes inchemerinandadiponectinlevels after weight reduction
Shin, H., Park, S., & Lee, J. (2017) · Endocrine Research · doi:10.1080/07435800.2017.1300808 · Cited by 7
Li, M., Zhang, R., Ge, Q., Yue, L., Ma, D., Khattab, F., Xie, W., Cui, Y., Gilon, P., Zhao, X., et al. (2023) · International Journal of Molecular Sciences · doi:10.3390/ijms24119136 · Cited by 7
Single-cell analysis reveals transcriptional dynamics in healthy primary parathyroid tissue
Venkat, A., Carlino, M. J., Lawton, B. R., Prasad, M. L., Amodio, M., Gibson, C. E., Zeiss, C. J., Youlten, S. E., Krishnaswamy, S., & Krause, D. S. (2024) · Genome Research · doi:10.1101/gr.278215.123 · Cited by 6
Qu, J., Fu, S., Yin, L., Zhang, Q., & Wang, X. (2024) · Cytokine · doi:10.1016/j.cyto.2024.156689 · Cited by 6
Kim, D., Min, Y., Suminda, G. G. D., Hur, C.-G., Lee, S.-C., Lee, H., Song, K., Heo, J.-Y., Son, Y., & Lee, D. (2022) · Animal Biotechnology · doi:10.1080/10495398.2022.2047996 · Cited by 5
Aşkın, L., Duman, H., Özyıldız, A. G., & Tanrıverdi, O. (2020) · Cardiovascular Innovations and Applications · doi:10.15212/cvia.2019.0572 · Cited by 5
Kozioł-Kozakowska, A., Wójcik, M., Januś, D., & Starzyk, J. (2023) · Pediatric Endocrinology Diabetes and Metabolism · doi:10.5114/pedm.2023.127273 · Cited by 4
Léniz, A., Fernández‐Quintela, A., del Hoyo, M., López, I. D., & Portillo, M. P. (2020) · Journal of Physiology and Biochemistry · doi:10.1007/s13105-020-00750-4 · Cited by 4
Chemerin loss‐of‐function attenuates glucagon‐like peptide‐1 secretion in exercised obese mice
Zhang, Q., Jia, Y., Guo, Y., Yu, X., Wang, R., & Wang, X. (2025) · Diabetes Obesity and Metabolism · doi:10.1111/dom.16126 · Cited by 4
Pancreatic Islets as a Target of Adipokines
Reiterer, M., Gilani, A., & Lo, J. C. (2022) · Wiley eBooks · doi:10.1002/cphy.c210044 · Cited by 3
Inflammatory Overtones of Organokines in Metabolic Syndrome and Type 2 Diabetes
Guria, S., Basu, S., Hoory, A., Mukherjee, S., & Mukhopadhyay, S. (2023) · Journal of the Indian Institute of Science · doi:10.1007/s41745-023-00391-8 · Cited by 3
Chemerin and the Gut: From Inflammation to Cancer
Pljakic, E., Delic, E., Corovic, I. F., Maksić, M., Radojević, D., Stanisavljević, I., Mladenović, V., Nikolić, T., Suljic, L., Ćorović, E., et al. (2025) · Biomedicines · doi:10.3390/biomedicines13112618 · Cited by 3
Role of G protein-coupled receptor 1 in choriocarcinoma progression
Huang, B., Zhu, W., Chang, J., Dai, X., Yu, G., Huang, C., Wang, E., Li, Z., Lin, L., Wang, B., et al. (2019) · American Journal of Physiology-Cell Physiology · doi:10.1152/ajpcell.00059.2019 · Cited by 3
CHEMERIN AS A POTENTIAL REGULATOR OF MITOCHONDRIAL QUALITY CONTROL IN OBESE PATIENTS
Vulf, M. A., (Skuratovskaia), D. A. S., Hung, V., Komar, A., Затолокин, П. А., Кириенкова, Е. В., Газатова, Н. Д., & Litvinova, L. S. (2021) · Medical Immunology (Russia) · doi:10.15789/1563-0625-caa-2227 · Cited by 2
Novel Adipocytokines: Monocyte Chemotactic Protein-1, Plasminogen Activator Inhibitor-1, Chemerin
Murphy, E. A. (2016) · Energy balance and cancer · doi:10.1007/978-3-319-41677-9_8 · Cited by 2
Identification of Three Novel Splicing Variants and Expression Analysis of Chicken GPR1 Gene
Zhang, X., Xiao, Q., Tian, K., Wang, Y., Zhao, X., Yin, H., Li, D., & Zhu, Q. C. (2017) · BioMed Research International · doi:10.1155/2017/1074054 · Cited by 2
Endukuru, C. K., Gaur, G. S., Yerrabelli, D., Sahoo, J., & Vairappan, B. (2020) · International Journal of Clinical and Experimental Physiology · doi:10.5530/ijcep.2020.7.1.2 · Cited by 2
A new predictor for prediabetes: Chemerin
Ergün, E., Koca, A. O., Beyan, E., Ertuğrul, D. T., Akkan, T., & Dal, K. (2023) · Konuralp Tıp Dergisi · doi:10.18521/ktd.1148541 · Cited by 2
Serum Chemerin Level as Biomarker for Renal Dysfunction in Type II Diabetes
Tahoun, A. M. A. R., lawah, A. A. E., dahshan, M. E., & Shalaby, A. M. E. S. (2019) · The Egyptian Journal of Hospital Medicine · doi:10.21608/ejhm.2019.49549 · Cited by 2
Kallikrein 14 activates the chemoattractant protein chemerin in human skin
Brzoza, P., Tyshchenko, M., Kantyka, T., Bielecka, E., Majewski, P., Migaczewski, M., Zabel, B. A., & Cichy, J. (2025) · Journal of Biological Chemistry · doi:10.1016/j.jbc.2025.111002 · Cited by 1
Targeting Islet GPCRs to Improve Insulin Secretion
Atanes, P., Ruz‐Maldonado, I., & Persaud, S. J. (2021) · Elsevier eBooks · doi:10.1016/b978-0-12-820472-6.00050-5 · Cited by 1
Pancreatic Islets as a Target of Adipokines
Reiterer, M., Gilani, A., & Lo, J. C. (2022) · Comprehensive physiology · doi:10.1002/j.2040-4603.2022.tb00238.x · Cited by 1
Wang, Q. (2013) · uO Research (University of Ottawa) · doi:10.20381/ruor-2980 · Cited by 1
Madrigal-Ruíz, P.-M., Corona-Meraz, F., Petri, M. H., Mercado, M. V.-D., Guzmán-Ornelas, M.-O., Macías-López, G. G., Diaz-Rubio, G.-I., & Navarro-Hernández, R. E. (2020) · Journal of Translational Science · doi:10.15761/jts.1000323 · Cited by 1
Hasanvand, Z., Mashayekhi, F. J., Sadeghi, A., Rezvanfar, M. R., & Goodarzi, M. T. (2014) · مجله دانشگاه علوم پزشکی اراک · Cited by 1
Chemerin: A Novel Biomarker of Coronary Artery Disease
Jency, C. S. (2023) · Chettinad Health City Medical Journal · doi:10.24321/2278.2044.202305 · Cited by 1
Zaki, M. E., Kamal, S., Hussein, M. A. E. A., Tawfeek, H. M., Girgiss, M. W., Ibrahim, A. M. M., & Youness, E. R. (2021) · Research Journal of Pharmacy and Technology · doi:10.52711/0974-360x.2021.00630 · Cited by 1
Tissue-Specific Chemerin in Atherosclerosis
Chen, M., Li, Y., Linling, F., & Liu, L. (2026) · Biomolecules · doi:10.3390/biom16091327
Regulation of physiological and tumoral angiogenesis by the chemerin system
Dhaou, C. B. (2021) · theses.fr (ABES) · doi:10.70675/b20f44c6z3697z4ba4za667z4fea3db4f273
Factors of Inflammation in Haitian Americans and African Americans with and without Type 2 Diabetes
Antwi, J. (2014) · FIU - Digital Commons (Florida International University) · doi:10.25148/etd.fi14110719
Up-to-Date on Novel “Adipocrines”
Carpéné, C., & Saulnier‐Blache, J. S. (2012) · Springer eBooks · doi:10.1007/978-2-8178-0343-2_15
Quelques nouvelles des «adipocrines»
Carpéné, C., & Saulnier‐Blache, J. S. (2013) · Springer eBooks · doi:10.1007/978-2-8178-0332-6_15
The Chemerin-CMKLR1 Axis is Functionally Important for Central Regulation of Energy Homeostasis
Dumbell, R., Yun, H., Maclean, S. L., Pors, K., & Helfer, G. (2021) · Endocrine Abstracts · doi:10.1530/endoabs.77.op4.3
Neves, K. B. (2016) · Digital Library of Theses and Dissertations (Universidade de São Paulo) · doi:10.11606/t.60.2016.tde-05102016-091840
The role of CC-chemokine receptor-like 2 in the B cell response
Cook, S. (2015) · University of Birmingham Institutional Research Archive (University of Birmingham)
La chémérine : une adipokine pro-inflammatoire impliquée dans les maladies métaboliques
Sell, H., & Poitou, C. (2013) · Cahiers de Nutrition et de Diététique · doi:10.1016/j.cnd.2013.10.004
Ahmed, C. M. J., Vasanthan, M., Vinodhini, V. M., & Renuka, P. (2024) · Research Square · doi:10.21203/rs.3.rs-4739209/v1
Kundakçı, S. (2025) · Marmara University Open Access System
Ciało prolamellarne : niezwykła struktura komórki roślinnej
Tokarek, W. (2015) · Homo Politicus (Academy of Humanities and Economics in Lodz)
Rola mikroDNA w zaburzeniach afektywnych
Banach, E. (2015) · Homo Politicus (Academy of Humanities and Economics in Lodz)
Lin, X., Yin, L., Qu, J., & Wang, X. (2021) · Research Square · doi:10.21203/rs.3.rs-288726/v1
Bilska, B., Godlewska, U., Damulewicz, M., Murzyn, K., Kwitniewski, M., Cichy, J., & Pyza, E. (2022) · Current Issues in Molecular Biology · doi:10.3390/cimb44030076
Relationship Between Plasma Chemerin Levels and Supraventricular Tachycardia
Kutlay, Ö., & Yalım, Z. (2023) · Bezmialem Science · doi:10.14235/bas.galenos.2023.18291
The Association of Polycystic Ovary Syndrome between Chemerin and Its Possible Mechanism
何, 咏. (2025) · Journal of Clinical Personalized Medicine · doi:10.12677/jcpm.2025.41084
Çatak, M. (2025) · Journal of Clinical Practice and Research · doi:10.14744/cpr.2025.78636
Plasma Chemerin may predict Type-2 Diabetes Remission after Bariatric Surgery
Garduño-Pérez, Á. A., Montoya‐Ramírez, J., la Peña‐Sosa, G. D., la Vega-Moreno, K. D., Vázquez-Ramos, D. C., Ramírez-Coyotecatl, A., Vera‐Gómez, E., Hernández‐Patricio, A., Zamora-Alemán, C. R., García, S., et al. (2026) · International Journal of Diabetes & Metabolic Disorders · doi:10.33140/ijdmd.11.01.01
Metadata
- Authors
- Takahashi, M., Okimura, Y., Iguchi, G., Nishizawa, H., Yamamoto, M., Suda, K., Kitazawa, R., Fujimoto, W., Takahashi, K., Zolotaryov, F. N., Hong, K. S., Kiyonari, H., Abe, T., Kaji, H., Kitazawa, S., Kasuga, M., Chihara, K., & Takahashi, Y.
- Affiliations
- Kobe University (JP)
- Kobe Women's University (JP)
- JCR Pharmaceuticals (Japan) (JP)
- RIKEN (JP)
- University of Hyogo (JP)
- Ehime University (JP)
- Hyogo Prefectural Kakogawa Medical Center (JP)
- Corresponding author
- Takahashi, Yutaka
- ORCID
- Venue
- Scientific Reports
- Published
- 2011-10-19
- Volume
- 1
- Issue
- 1
- Pages
- 123-123
- ISSN
- 2045-2322 (ISSN-L)
- PMC
- PMC3216604
- OpenAlex
- W1977282990
- Cited by
- 149
- References
- 37
- Citations by year
- 2026: 1 · 2025: 8 · 2024: 8 · 2023: 9 · 2022: 12 · 2021: 16 · 2020: 12 · 2019: 13 · 2018: 18 · 2017: 7 · 2016: 7 · 2015: 11 · 2014: 7 · 2013: 12 · 2012: 8
- FWCI
- 8.83
- Type
- journal article
- Language
- en
- Open access
- gold
- doi.org
- Licence
- cc-by-nc-sa
- creativecommons.org/licenses/by-nc-sa/3.0/ (tdm)
- creativecommons.org/licenses/by-nc-sa/3.0/ (vor)
- Locations
- Scientific Reports (publishedVersion, cc-by-nc-sa)
- PubMed Central (publishedVersion, cc-by-nc-sa)
- PubMed (publishedVersion)
- Funders
- Ministry of Education, Culture, Sports, Science and Technology (23659477, 22591012)
- Japan Society for the Promotion of Science (22591012, 23659186, 21590419, 23659477)
- Topics
- Health Sciences › Medicine › Endocrinology, Diabetes and Metabolism › Pancreatic function and diabetes
- Life Sciences › Biochemistry, Genetics and Molecular Biology › Genetics › Diabetes and associated disorders
- Health Sciences › Medicine › Endocrinology, Diabetes and Metabolism › Diabetes Treatment and Management
- Keywords
- chemerin, ChemR23, beta-cell function, glucose-dependent insulin secretion, impaired glucose tolerance, hepatic glucose production, MafA, glucose homeostasis, adipose tissue macrophages
- MeSH terms
- Insulin Secretion, Adipose Tissue, Animals, Cell Line, Chemotactic Factors, Glucose Tolerance Test, Insulin, Macrophages, Male, Mice, Inbred C57BL, Mice, Transgenic, Mice, Knockout, Chemokines, Receptors, Chemokine, Intercellular Signaling Peptides and Proteins, Receptors, G-Protein-Coupled, Insulin-Secreting Cells, Mice, Maf Transcription Factors, Large, Gene Knockdown Techniques, Diet, High-Fat
About these checks
Registry, retraction, Cites and statistics results are computed, not judged, with one exception: a printed reference that no index lists is read once by a model before it counts as a citation error. Claims are extracted by a model and kept only when their quote appears verbatim in the text; each cited source is then checked, with a model’s help, for whether it says what the claim relies on. Those verdicts can be wrong — read the claim’s quote and the cited source before relying on one.
Statistics and arithmetic are recomputed, not judged.
Confidence bands are shown only for fields calibrated on our annotated test set. None is calibrated yet, so no band is shown.
What counts as a claim ›How we measure confidence ›How we check this ›
Are you an author, or do you see a problem with this page? Request a review
Data sources
Bibliographic data: Semantic Scholar, OpenAlex, Crossref.
Contains information from the Semantic Scholar Academic Graph Datasets, made available under the ODC Attribution License (ODC-BY 1.0).
Semantic Scholar’s data is described in: Kinney, R., et al. (2023). The Semantic Scholar Open Data Platform. arXiv:2301.10140.
