

Computing Arm Movements with a Monkey Brainet
Open accessThe DOI matches its Crossref record; 46 of the 46 references it cites were found in a registry or an index.
Abstract
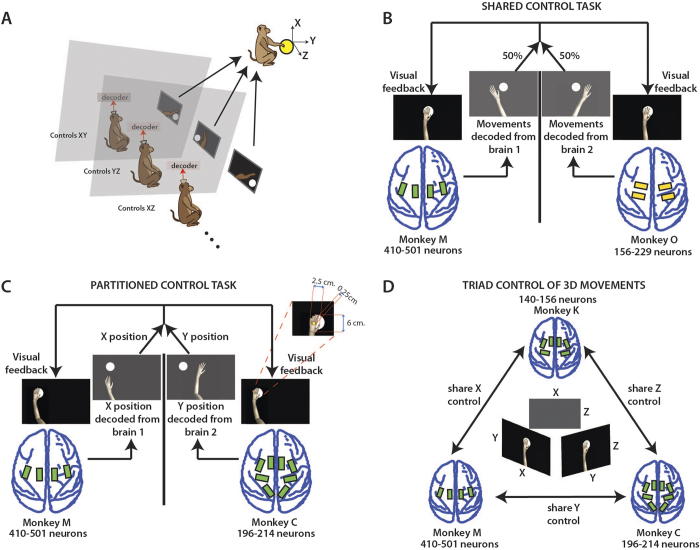
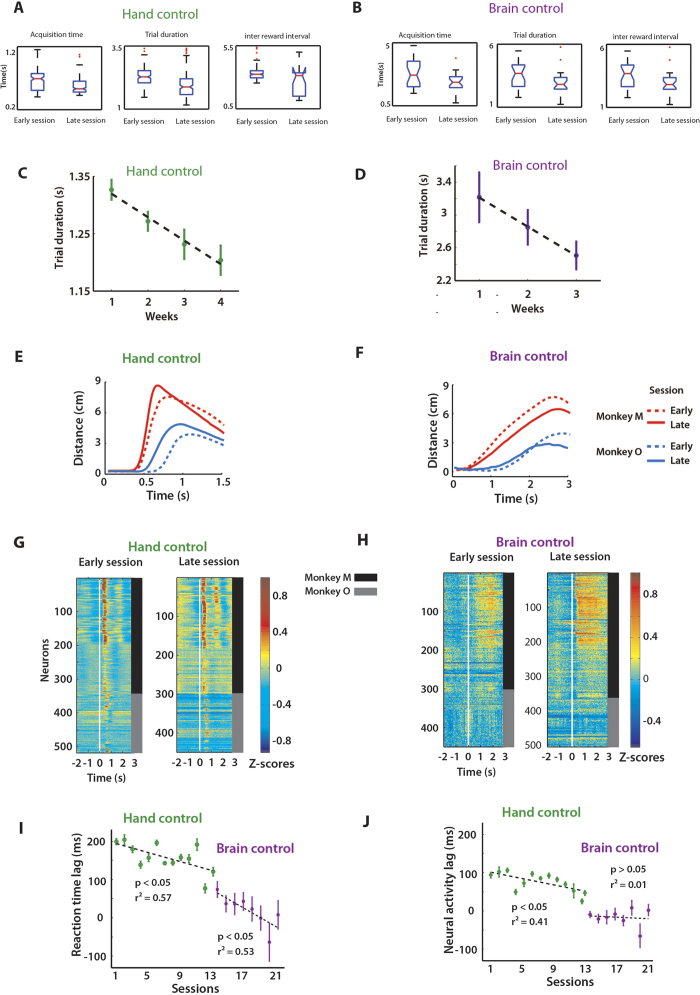
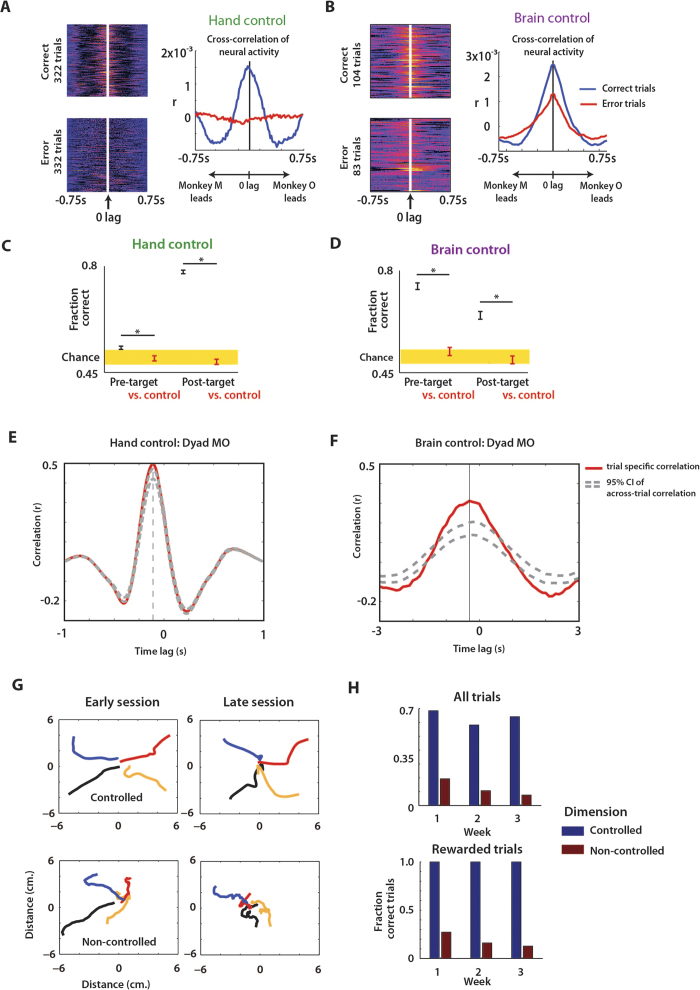
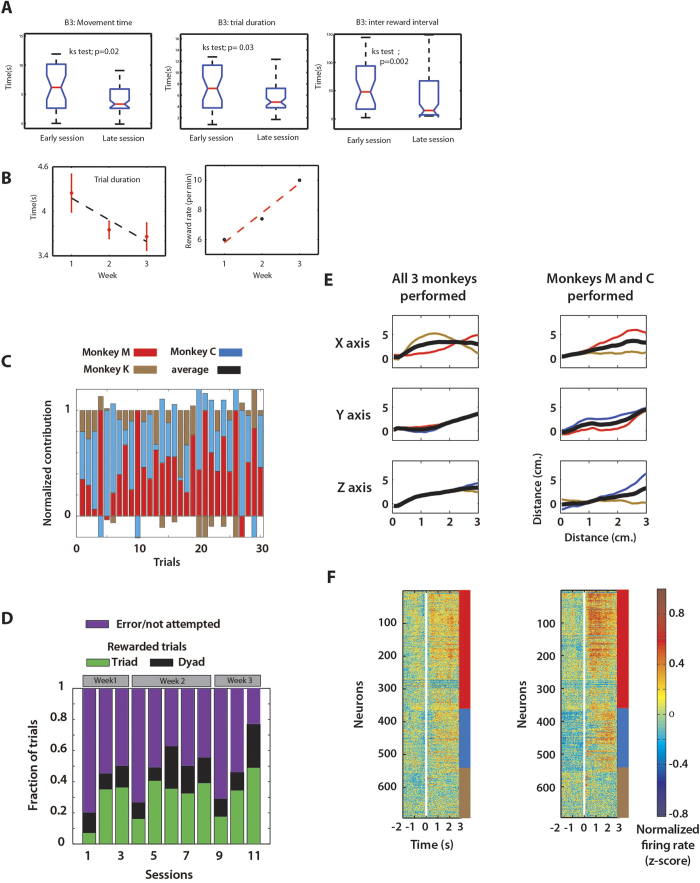
Traditionally, brain-machine interfaces (BMIs) extract motor commands from a single brain to control the movements of artificial devices. Here, we introduce a Brainet that utilizes very-large-scale brain activity (VLSBA) from two (B2) or three (B3) nonhuman primates to engage in a common motor behaviour. A B2 generated 2D movements of an avatar arm where each monkey contributed equally to X and Y coordinates; or one monkey fully controlled the X-coordinate and the other controlled the Y-coordinate. A B3 produced arm movements in 3D space, while each monkey generated movements in 2D subspaces (X-Y, Y-Z, or X-Z). With long-term training we observed increased coordination of behavior, increased correlations in neuronal activity between different brains and modifications to neuronal representation of the motor plan. Overall, performance of the Brainet improved owing to collective monkey behaviour. These results suggest that primate brains can be integrated into a Brainet, which self-adapts to achieve a common motor goal.
Overview
The claims and statistics of this paper haven’t been checked yet.
Free: it reads the open-access text and checks the first 5 claims that cite a source we can check. Create a free account to check every claim.
Integrity signals
Registry
Cites
Statistics
Figures
Verification
Claims the paper makes
The claims and statistics of this paper haven’t been checked yet.
Free: it reads the open-access text and checks the first 5 claims that cite a source we can check. Create a free account to check every claim.
Claims other papers make about this one
Each is checked against this paper’s own text: does it say what the citing paper says it does?
The cited source says what the claim attributes to it.
In the citing paper
“A different study12 demonstrated that three non-human primates can jointly control a 3D virtual avatar arm using brain signals recorded with invasive electrodes implanted in the motor cortex”
From BrainNet: A Multi-Person Brain-to-Brain Interface for Direct Collaboration Between Brains (2019) · cites this paper as [12]
The cited source says what the claim attributes to it.
In the citing paper
“again, the goal was distributing a single task across multiple individuals linked to a common BCI without encoding any neural information for feedback and interaction via stimulation.”
From BrainNet: A Multi-Person Brain-to-Brain Interface for Direct Collaboration Between Brains (2019) · cites this paper as [12]
The cited source says what the claim attributes to it.
In the citing paper
“Experiments have tested three different control systems using 2–3 implanted monkeys that shared BMI-mediated control of a virtual arm (Ramakrishnan et al., 2015).”
From Human Brain/Cloud Interface (2019) · cites this paper as Ramakrishnan et al., 2015
Self-check
Percentages, sums and reported differences re-computed from the paper’s own numbers.
The self-check needs the paper’s full text.
Citations
Cites
Neuronal ensemble control of prosthetic devices by a human with tetraplegia
Hochberg, L. R., Serruya, M. D., Friehs, G. M., Mukand, J. A., Saleh, M., Caplan, A. H., Branner, A., Chen, D., Penn, R. D., & Donoghue, J. P. (2006) · Nature · doi:10.1038/nature04970 · Cited by 3,295 · cited 1×
“To assess the performance of the B2 in manual control and brain control modes, we also calculated performance metrics reported in the previous literature 39,40 .”
MethodJoint action: bodies and minds moving together
SEBANZ, N., BEKKERING, H., & KNOBLICH, G. (2006) · Trends in Cognitive Sciences · doi:10.1016/j.tics.2005.12.009 · Cited by 1,950 · cited 1×
“Previously, joint motor behaviour was studied extensively in human psychophysics studies 18,19,41 .”
BackgroundBrain–machine interfaces: past, present and future
Lebedev, M. A., & Nicolelis, M. A. L. (2006) · Trends in Neurosciences · doi:10.1016/j.tins.2006.07.004 · Cited by 1,875 · cited 1×
“They were chronically implanted with multielectrode arrays in motor (M1) and somatosensory cortices (S1) 1,35 .”
MethodSelf-citationLearning to control a brain–machine interface for reaching and grasping by primates
Carmena, J. M., Lebedev, M. A., Crist, R. E., O'Doherty, J. E., Santucci, D. M., Dimitrov, D. F., Patil, P. G., Henriquez, C. S., & Nicolelis, M. A. L. (2003) · PLoS Biology · doi:10.1371/journal.pbio.0000042 · Cited by 1,761 · cited 2×
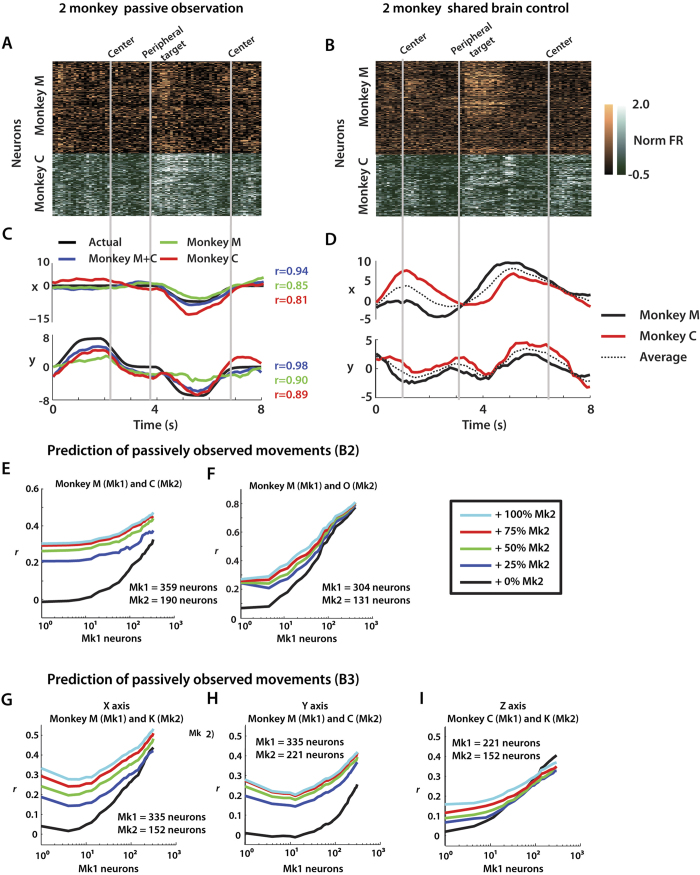
“This finding extends our previous results, using neuron dropping curve (NDC) analyses, where we showed that decoding accuracy consistently improved when larger neuronal samples were recorded from a single brain 4,5 .”
MethodResultSelf-citationControl of a two-dimensional movement signal by a noninvasive brain-computer interface in humans
Wolpaw, J. R., & McFarland, D. J. (2004) · Proceedings of the National Academy of Sciences · doi:10.1073/pnas.0403504101 · Cited by 1,512
Real-time prediction of hand trajectory by ensembles of cortical neurons in primates
Wessberg, J., Stambaugh, C. R., Kralik, J. D., Beck, P. D., Laubach, M., Chapin, J. K., Kim, J., Biggs, S. J., Srinivasan, M. A., & Nicolelis, M. A. L. (2000) · Nature · doi:10.1038/35042582 · Cited by 1,487
Self-citationGroup Performance and Decision Making
Kerr, N. L., & Tindale, R. S. (2004) · Annual Review of Psychology · doi:10.1146/annurev.psych.55.090902.142009 · Cited by 1,331
Real-time control of a robot arm using simultaneously recorded neurons in the motor cortex
Chapin, J. K., Moxon, K. A., Markowitz, R. S., & Nicolelis, M. A. L. (1999) · Nature Neuroscience · doi:10.1038/10223 · Cited by 1,164
Self-citationRf, G. (1985) · Cited by 949
Rocking together: Dynamics of intentional and unintentional interpersonal coordination
Richardson, M. J., Marsh, K. L., Isenhower, R. W., Goodman, J. R. L., & Schmidt, R. C. (2007) · Human Movement Science · doi:10.1016/j.humov.2007.07.002 · Cited by 796 · cited 1×
“Two individuals who are performing movements can become entrained when they mutually affect each other’s behaviour 42 , even if they are not explicitly instructed to do so 22 .”
Background
Research works printed but not linked: 1
- Gibson, J. J. The theory of affordances in Perceiving, Acting and Knowing (eds. Shaw, R. & Bransford, J. ) 67–82 (Wiley, 1977).
Cited by
Four ethical priorities for neurotechnologies and AI
Yuste, R., Goering, S., Arcas, B. A. Y., Bi, G., Carmena, J. M., Carter, A., Fins, J. J., Friesen, P., Gallant, J., Huggins, J. E., et al. (2017) · Nature · doi:10.1038/551159a · Cited by 678
Brain-Machine Interfaces: From Basic Science to Neuroprostheses and Neurorehabilitation
Lebedev, M. A., & Nicolelis, M. A. L. (2017) · Physiological Reviews · doi:10.1152/physrev.00027.2016 · Cited by 653
“In the same context, the concept of Brainets takes multitasking BMI designs to the next level by combining multiple brains into a higher order computational entity (614, 616, 657).”
BackgroundInfluentialSelf-citationKrucoff, M. O., Rahimpour, S., Slutzky, M. W., Edgerton, V. R., & Turner, D. A. (2016) · Frontiers in Neuroscience · doi:10.3389/fnins.2016.00584 · Cited by 187
“Other investigators have connected the brains of several animals into a single system, or “brainet,” where the animals try to achieve a single objective using brain control only (Pais-Vieira et al., 2015; Ramakrishnan et al., 2015).”
BackgroundBrainNet: A Multi-Person Brain-to-Brain Interface for Direct Collaboration Between Brains
Jiang, L., Stocco, A., Losey, D. M., Abernethy, J. A., Prat, C. S., & Rao, R. P. N. (2019) · Scientific Reports · doi:10.1038/s41598-019-41895-7 · Cited by 190
“…BrainNet (Figure 1), a next-generation BBI that addresses many of the limitations of past BBIs (The term “Brainet” was used by Ramakrishnan et al. 12 for their brain-computer interface system which combines recordings from multiple monkey brains to perform a common motor task; the interface was…”
BackgroundMethodInfluentialBuilding an organic computing device with multiple interconnected brains
Pais-Vieira, M., Chiuffa, G., Lebedev, M., Yadav, A., & Nicolelis, M. A. L. (2015) · Scientific Reports · doi:10.1038/srep11869 · Cited by 99
“According to this analysis, Brainets formed by larger cortical neuronal ensembles performed better than those containing just a few neurons 9 .”
BackgroundMethodInfluentialSelf-citationMartins, N. R. B., Angelica, A., Chakravarthy, K., Svidinenko, Y., Boehm, F. J., Opris, I., Lebedev, M. A., Swan, M., Garan, S. A., Rosenfeld, J. V., et al. (2019) · Frontiers in Neuroscience · doi:10.3389/fnins.2019.00112 · Cited by 91
“Experiments have tested three different control systems using 2–3 implanted monkeys that shared BMI-mediated control of a virtual arm (Ramakrishnan et al., 2015).”
BackgroundMethodSelf-citationCortical neurons multiplex reward-related signals along with sensory and motor information
Ramakrishnan, A., Byun, Y. W., Rand, K., Pedersen, C. E., Lebedev, M., & Nicolelis, M. A. L. (2017) · Proceedings of the National Academy of Sciences · doi:10.1073/pnas.1703668114 · Cited by 74
Self-citationApproaches of wearable and implantable biosensor towards of developing in precision medicine
Ghazizadeh, E., Naseri, Z., Deigner, H.-P., Rahimi, H., & Altıntaş, Z. (2024) · Frontiers in Medicine · doi:10.3389/fmed.2024.1390634 · Cited by 89
“The BraiNet project connected the brains of three primates, allowing them to move an arm over a target in digital 3D space (82).”
Interfacing to the brain’s motor decisions
Mirabella, G., & Lebedev, M. (2016) · Journal of Neurophysiology · doi:10.1152/jn.00051.2016 · Cited by 57
“In one such demonstration, several monkeys controlled a virtual arm with their brain activity cooperatively (Ramakrishnan et al. 2015).”
BackgroundSelf-citationLotter, L. D., Kohl, S. H., Gerloff, C., Bell, L., Niephaus, A., Kruppa, J. A., Dukart, J., Schulte‐Rüther, M., Reindl, V., & Konrad, K. (2023) · Neuroscience & Biobehavioral Reviews · doi:10.1016/j.neubiorev.2023.105042 · Cited by 56
Multi-Person Brain-To-Brain Interfaces: Ethical Issues
Hildt, E. (2019) · Frontiers in Neuroscience · doi:10.3389/fnins.2019.01177 · Cited by 51
“, 2017), in particular to research in which two or three non-human primates where able to engage in commonmotor behavior (Ramakrishnan et al., 2015).”
BackgroundCyborg Insects: Bug or a Feature?
Šiljak, H., Nardelli, P. H. J., & Moioli, R. C. (2022) · IEEE Access · doi:10.1109/access.2022.3172980 · Cited by 37
“Such direct brain–to–brain links have been shown to facilitate cooperative problem-solving tasks in rats and monkeys [118], [119], resembling an organic computer, thus swarms of cyborg insects may lead to novel, complex intelligent systems.”
BackgroundInterbrain cortical synchronization encodes multiple aspects of social interactions in monkey pairs
Tseng, P.-H., Rajangam, S., Lehew, G., Lebedev, M., & Nicolelis, M. A. L. (2018) · Scientific Reports · doi:10.1038/s41598-018-22679-x · Cited by 35
Self-citationYang, S., Deng, B., Wang, J., Li, H., Liu, C., Fietkiewicz, C., & Loparo, K. A. (2017) · Scientific Reports · doi:10.1038/srep40152 · Cited by 25
Borbón, D., Borbón, L., Pinzón, J. L., et al. (2020) · IUS ET SCIENTIA · doi:10.12795/ietscientia.2020.i02.10 · Cited by 114
Neuronal Assemblies Evidence Distributed Interactions within a Tactile Discrimination Task in Rats
Deolindo, C. S., Kunicki, A. C. B., da Silva, M. I., Brasil, F. L., & Moioli, R. C. (2018) · Frontiers in Neural Circuits · doi:10.3389/fncir.2017.00114 · Cited by 25
“…et al., 2016; Dejean et al., 2016), for the understanding of the neural code (Winters and Reid, 2010; Russo and Durstewitz, 2017), and for the design of new brain-machine interfaces (Wessberg et al., 2000; Hochberg et al., 2006; Ifft et al., 2013; Shokur et al., 2013; Ramakrishnan et al., 2015).”
BackgroundLu, L., Wang, R., & Luo, M. (2020) · Science China Life Sciences · doi:10.1007/s11427-020-1675-x · Cited by 18
Merging Minds: The Conceptual and Ethical Impacts of Emerging Technologies for Collective Minds
Lyreskog, D. M., Zohny, H., Savulescu, J., & Singh, I. (2023) · Neuroethics · doi:10.1007/s12152-023-09516-3 · Cited by 19
“For instance, consider the technology used in the experiments by Ramakrishnan and colleagues [44], where monkeys were connected through a direct BBI to collaborate on a task which none of them could solve alone.”
BackgroundMethodComputational neuroscience and neuroinformatics: Recent progress and resources
Nayak, L., Dasgupta, A., Das, R., Ghosh, K., & De, R. K. (2018) · Journal of Biosciences · doi:10.1007/s12038-018-9813-y · Cited by 26
“On a very different note of computational neuroscience related development, Brainnets, (Pais-Vieira et al. 2015; Ramakrishnan et al. 2015) have emerged as an alternative to super-computation and hyper-performance.”
BackgroundHuman enhancement through the lens of experimental and speculative neurotechnologies
Teunisse, W., Youssef, S., & Schmidt, M. R. (2019) · Human Behavior and Emerging Technologies · doi:10.1002/hbe2.179 · Cited by 21
“…are in fact based on preliminary research carried out by scientists (Angrick et al., 2018; Bhayee et al., 2016; Hampson et al., 2012; Kapur et al., 2018; Novich & Eagleman, 2015; Pais-Vieira et al., 2013; Ramakrishnan et al., 2015), while others emerge from other fields, including art and design.”
BackgroundInfluentialRascoe, A., Sharma, P., & Shah, P. K. (2018) · Frontiers in Neuroscience · doi:10.3389/fnins.2018.00472 · Cited by 13
Brain‐to‐brain interface technology: A brief history, current state, and future goals
Vakilipour, P., & Fekrvand, S. (2024) · International Journal of Developmental Neuroscience · doi:10.1002/jdn.10334 · Cited by 15
“On the other hand, efforts to make a BBI system that connects multiple brains (also called BraiNet) continued till 2015, when Ramakrishnan et al. (2015) established a shared monkey BMI system using very large-scale brain activity recordings from primate brain pairs or triplets to perform conjoint…”
Yang, L., Li, M., Yang, L., Wang, H., Wan, H., & Shang, Z. (2020) · Brain Research Bulletin · doi:10.1016/j.brainresbull.2020.04.015 · Cited by 11
Brain Computer Interfaces and Human Rights: Brave new rights for a brave new world
Botes, M. (2022) · ACM Conference on Fairness, Accountability, and Transparency (FAccT) · doi:10.1145/3531146.3533176 · Cited by 14
“Along similar lines researchers in California developed a simulator which can transmit information directly to your brain and teach you new skills, such as flying a plane, in a short amount of time [13], whilst researchers at Duke University in Durham, North Carolina, showed that three monkeys, with electrode implants…”
BackgroundA markerless platform for ambulatory systems neuroscience
Silvernagel, M. P., Ling, A. S., & Nuyujukian, P. (2021) · Science Robotics · doi:10.1126/scirobotics.abj7045 · Cited by 14
“Targets are presented on a screen while movement kinematics are measured by marker tracking (13), a manipulandum/joystick (14), or haptic devices (15), and neural data of brain-implanted electrodes are collected from a wired neural recording device (9, 16, 17).”
MethodAhn, S. (2016) · Technology in Society · doi:10.1016/j.techsoc.2016.08.003 · Cited by 9
“(Cicurel & Nicolelis, 2015: Ch7) Whereas this possibility of BMIs to wield their action potentials beyond boundaries of biological bodies and experimental setting is explained as “what a naturally M AN US CR IP T AC CE PT ED 25 evolved brain can produce” with its “self-adaptable (i. . plastic)…”
BackgroundAugmentation of Sensorimotor Functions with Neural Prostheses
Lebedev, M. (2016) · Russian Agency for Digital Standardization · doi:10.20388/omp2016.003.0035 · Cited by 9
Self-citationBRAIN-COMPUTER INTERFACE FOR THE AUGMENTATION OF BRAIN FUNCTIONS
Lebedev, M. (2016) · Science and Innovations in Medicine · doi:10.35693/2500-1388-2016-0-3-11-27 · Cited by 7
Self-citationDaw, T. B., El-Nahal, H. G., Basso, M. A., Jun, E. J., Bautista, A. R., Samulski, R. J., Sommer, M. A., & Bohlen, M. O. (2023) · Human Gene Therapy · doi:10.1089/hum.2022.194 · Cited by 6
Silva‐dos‐Santos, A. (2017) · Frontiers in Psychology · doi:10.3389/fpsyg.2017.00105 · Cited by 6
“, 2013), brainet (Pais-Vieira et al., 2015; Ramakrishnan et al., 2015) and also by the application of spinal cord stimulation to treat rodents models of Parkinson’s Disease (Fuentes et al.”
BackgroundNeural–Computer Interfaces: Theory, Practice, Perspectives
Dubynin, I. A., Zemlyanskov, M. S., Shalayeva, I., Gorskii, O., Grinevich, V. P., & Евгеньевич, М. П. (2025) · Applied Sciences · doi:10.3390/app15168900 · Cited by 7
Lyreskog, D. M., Zohny, H., Mann, S. P., Singh, I., & Savulescu, J. (2024) · Science and Engineering Ethics · doi:10.1007/s11948-024-00492-2 · Cited by 4
“This approach has been used in BBI experiments, particularly where there are more than two participants, and/or where participants are geographically distant (Jiang et al., 2019; Stocco et al., 2015; Ramakrishnan et al., 2015).”
MethodFunctional Ensembles in the Brains of Humans and Animals
Berlov, D. N., & Nikitina, E. A. (2021) · Human Physiology · doi:10.1134/s0362119721050030 · Cited by 3
Yamagiwa, S., Sawahata, H., Oi, H., Numano, R., Ishida, M., Koida, K., & Kawano, T. (2017) · IEEE International Conference on Micro Electro Mechanical Systems (MEMS) · doi:10.1109/memsys.2017.7863466 · Cited by 4
“brain-machine interface (BMI) technology [7, 8].”
Cognitive Augmentation Via a Brain/Cloud Interface
Angelica, A., Opriș, I. C., Lebedev, M., & Boehm, F. (2021) · Contemporary clinical neuroscience · doi:10.1007/978-3-030-54564-2_17 · Cited by 3
Self-citationStrange Aeons: Transhumanism, H.P. Lovecraft, and the affective index of posthuman dread
Bialecki, J. (2022) · The Australian Journal of Anthropology · doi:10.1111/taja.12450 · Cited by 4
When Two Become One: Singular Duos and the Neuroethical Frontiers of Brain-to-Brain Interfaces
Zohny, H., & Savulescu, J. (2024) · Cambridge Quarterly of Healthcare Ethics · doi:10.1017/s0963180124000197 · Cited by 3
Getting It Together: Psychological Unity and Deflationary Accounts of Animal Metacognition
Comstock, G., & Bauer, W. A. (2018) · Acta Analytica · doi:10.1007/s12136-018-0340-0 · Cited by 3
“Were a fourth entity being created, one might be excused for enthusing that the newmind Bself-adapts to achieve a common motor goal^ (Ramakrishnan et al. 2015, emphasis added).”
BackgroundLotter, L., Kohl, S. H., Gerloff, C., Bell, L., Niephaus, A., Kruppa, J. A., Dukart, J., Schulte-Rüther, M., Reindl, V., & Konrad, K. (2022) · bioRxiv · doi:10.1101/2022.07.26.501562 · Cited by 51
“Here, the cortical activity of one subject engaged in a certain behavior would translate into the cortical activity of an interacting subject, with the repetition of this social interaction reshaping interbrain functional connectivity not only in dyads but potentially in entire social groups (Ramakrishnan et al., 2015…”
An automatic experimental apparatus to study arm reaching in New World monkeys
Yin, A. S., An, J., Lehew, G., Lebedev, M., & Nicolelis, M. A. L. (2016) · Journal of Neuroscience Methods · doi:10.1016/j.jneumeth.2016.02.017 · Cited by 1
Self-citationBrain-Machine Interface Technology in Neurosurgery
Rosenfeld, J. V., & Broekman, M. L. D. (2020) · Cambridge University Press eBooks · doi:10.1017/9781108643887.023 · Cited by 2
Augmentation Through Interconnection: Brain-Nets and Telemedicine
Lebedev, M., Shaderkin, I. A., Ryabkov, I. V., & Lebedev, G. S. (2021) · Contemporary clinical neuroscience · doi:10.1007/978-3-030-54564-2_16 · Cited by 1
Self-citationFrom Perception to Action: Brain-to-Brain Information Transmission of Pigeons
Yang, L., Yang, L., Wang, H., Li, M., & Shang, Z. (2024) · Journal of Bionic Engineering · doi:10.1007/s42235-024-00581-9 · Cited by 1
“The BtBI system research based on ICMS has made some progress, in which ICMS have been used as an information encoding mode to realize the real-time transmission of perception-action information between multiple brains of rats and monkeys [2, 24, 25 ].”
"Brainets" Shaping The Embodied ActivitiesPreprint
Pereira, R. H. D. S., Filho, S. F. D. S., & Barcellos, V. M. (2023) · Qeios · doi:10.32388/al52vq · Cited by 1
Implications of Neurotechnology: Brain Recording and Intervention
Haselager, P. (2021) · Cambridge University Press eBooks · doi:10.1017/9781108623056.017
Brain Machine Interfaces Within a Critical Perspective
Zippo, A. G., & Biella, G. E. M. (2021) · Contemporary clinical neuroscience · doi:10.1007/978-3-030-54564-2_5
Por que não somos só o nosso cérebro: em defesa do enativismo
Rolla, G. (2023) · Trans/Form/Ação · doi:10.1590/0101-3173.2023.v46esp1.p207 · Cited by 3
Por que somos o nosso cérebro: o enativismo posto em questão
Pereira, R. H. D. S., Filho, S. F. D. S., & Barcellos, V. M. (2023) · Trans/Form/Ação · doi:10.1590/0101-3173.2023.v46esp1.p517 · Cited by 7
“Buenos jueces” en el proceso civil: dogmática y neurociencia
Delgado, N. C. (2022) · Revista de Derecho de la Pontificia Universidad Católica de Valparaíso · doi:10.4151/s0718-68512022000-1375 · Cited by 2
Brain Patterns Shaping Embodied Activities of Their Bodily Limbs in Perception and CognitionPreprint
Pereira, R. H. D. S., Filho, S. F. D. S., & Barcellos, V. M. (2023) · Qeios · doi:10.32388/al52vq.3
Sevastidis, J., Clark, G., Henneberg, M., Storm, L., Burlakoti, A., Saniotis, A., & You, W. (2025) · Anthropological Review · doi:10.18778/1898-6773.88.4.01
“Little information on IBNS in primates exists (Ramakrishnan et al. 2015; Tseng et al. 2018).”
Materials and technologies in neural interfaces: optimization ways for chronic implantation
Родионова, К. Н., Vigovskaya, E. A., Novosad, Y. A., Сергеевич, Ш. А., & Vissarionov, S. V. (2026) · S S Korsakov Journal of Neurology and Psychiatry · doi:10.17116/jnevro202612605121
Materials and Technologies in Neural Interfaces: Pathways to Optimization for Chronic Implantation
Родионова, К. Н., Vigovskaya, E. A., Novosad, Y. A., Shabunin, A. S., & Vissarionov, S. V. (2026) · Neuroscience and Behavioral Physiology · doi:10.1007/s11055-026-02078-w
Metadata
- Authors
- Ramakrishnan, A., Ifft, P. J., Pais-Vieira, M., Byun, Y. W., Zhuang, K. Z., Lebedev, M. A., & Nicolelis, M. A. L.
- Affiliations
- Duke University (US)
- Corresponding author
- Nicolelis, Miguel A.L.
- ORCID
- Venue
- Scientific Reports
- Published
- 2015-07-09
- Volume
- 5
- Issue
- 1
- Pages
- 10767-10767
- ISSN
- 2045-2322 (ISSN-L)
- PMC
- PMC4497496
- OpenAlex
- W998936125
- Cited by
- 54
- References
- 46
- Citations by year
- 2026: 2 · 2025: 2 · 2024: 5 · 2023: 7 · 2022: 5 · 2021: 7 · 2020: 4 · 2019: 4 · 2018: 5 · 2017: 6 · 2016: 6 · 2015: 1
- FWCI
- 3.57
- Type
- journal article
- Language
- en
- Open access
- gold
- doi.org
- Licence
- cc-by
- creativecommons.org/licenses/by/4.0 (tdm)
- creativecommons.org/licenses/by/4.0 (vor)
- Locations
- Scientific Reports (publishedVersion, cc-by)
- PubMed Central (publishedVersion, cc-by)
- PubMed (publishedVersion)
- Funders
- Fundação Bial
- National Institutes of Health
- National Institute of Mental Health (DP1MH099903)
- National Center for Chronic Disease Prevention and Health Promotion (DP1MH099903)
- Topics
- Life Sciences › Neuroscience › Cognitive Neuroscience › EEG and Brain-Computer Interfaces
- Life Sciences › Neuroscience › Cognitive Neuroscience › Motor Control and Adaptation
- Life Sciences › Neuroscience › Cellular and Molecular Neuroscience › Neuroscience and Neural Engineering
- Keywords
- brain-computer interface, non-human primates, arm movement control
- MeSH terms
- Animals, Haplorhini, Arm, Behavior, Animal, Brain, Electrodes, Implanted, Movement, Neurons, Brain-Computer Interfaces
About these checks
Registry, retraction, Cites and statistics results are computed, not judged, with one exception: a printed reference that no index lists is read once by a model before it counts as a citation error. Claims are extracted by a model and kept only when their quote appears verbatim in the text; each cited source is then checked, with a model’s help, for whether it says what the claim relies on. Those verdicts can be wrong — read the claim’s quote and the cited source before relying on one.
Statistics and arithmetic are recomputed, not judged.
Confidence bands are shown only for fields calibrated on our annotated test set. None is calibrated yet, so no band is shown.
What counts as a claim ›How we measure confidence ›How we check this ›
Are you an author, or do you see a problem with this page? Request a review
Data sources
Bibliographic data: Semantic Scholar, OpenAlex, Crossref.
Contains information from the Semantic Scholar Academic Graph Datasets, made available under the ODC Attribution License (ODC-BY 1.0).
Semantic Scholar’s data is described in: Kinney, R., et al. (2023). The Semantic Scholar Open Data Platform. arXiv:2301.10140.
