

The DOI matches its Crossref record; 75 of the 75 references it cites were found in a registry or an index; 12 of the 61 sources its claims cite were checked for support.
Default and Executive Network Coupling Supports Creative Idea Production
Open accessAbstract
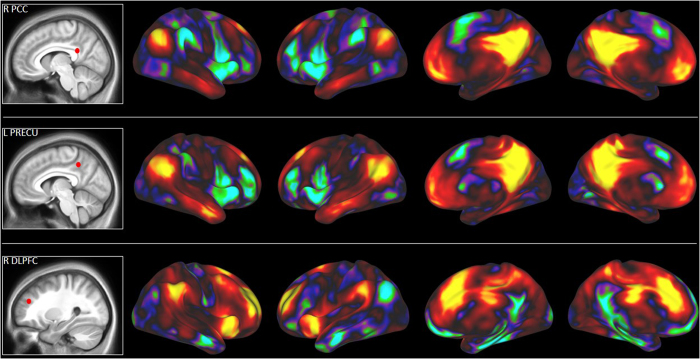
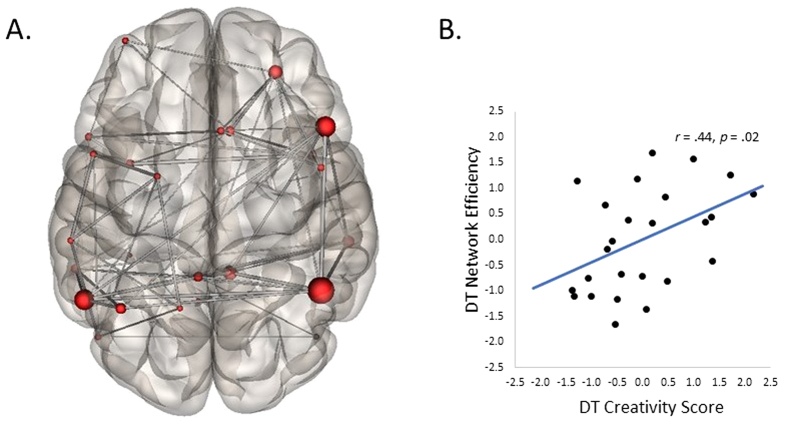
The role of attention in creative cognition remains controversial. Neuroimaging studies have reported activation of brain regions linked to both cognitive control and spontaneous imaginative processes, raising questions about how these regions interact to support creative thought. Using functional magnetic resonance imaging (fMRI), we explored this question by examining dynamic interactions between brain regions during a divergent thinking task. Multivariate pattern analysis revealed a distributed network associated with divergent thinking, including several core hubs of the default (posterior cingulate) and executive (dorsolateral prefrontal cortex) networks. The resting-state network affiliation of these regions was confirmed using data from an independent sample of participants. Graph theory analysis assessed global efficiency of the divergent thinking network and network efficiency was found to increase as a function of individual differences in divergent thinking ability. Moreover, temporal connectivity analysis revealed increased coupling between default and salience network regions (bilateral insula) at the beginning of the task, followed by increased coupling between default and executive network regions at later stages. Such dynamic coupling suggests that divergent thinking involves cooperation between brain networks linked to cognitive control and spontaneous thought, which may reflect focused internal attention and the top-down control of spontaneous cognition during creative idea production.
Overview
CoChat Summary
TL;DR
Using fMRI during an alternate-uses divergent thinking task, the study found that creative idea production is supported by dynamic coupling among default, executive, and salience networks rather than isolated network activity. Greater global efficiency of this divergent-thinking network correlated with better behavioral divergent thinking ability.
Key findings
- The whole-brain MVPA contrast (alternate uses > object characteristics) identified a distributed divergent-thinking network including default regions (left precuneus, right PCC, bilateral IPL), the executive region right DLPFC, salience regions (right ACC, bilateral insula), and temporal clusters such as bilateral MTG.
- Resting-state analysis in an independent sample (n = 42) confirmed network affiliations: precuneus/PCC seeds positively connected with DMN regions and negatively with ECN regions, while the right DLPFC seed positively connected with ECN regions and negatively with DMN regions.
- Temporal ROI-to-ROI analyses showed the PCC initially coupled with bilateral insula (salience network) and later with right DLPFC (executive network); right DLPFC coupled with default regions (right PCC, right IPL) only during the second half of the task (TRs 4–5).
- Global efficiency of the whole-brain ROI network positively correlated with composite creativity scores from the out-of-scanner alternate uses task (r = .44, p = .02).
Methods
- Final sample: 25 right-handed young adults (13 females; mean age 21.04 years, range 18–30) after excluding 3 of 28 for head movement >3 mm; participants completed alternate uses divergent thinking and object characteristics control tasks during fMRI (46 event-related trials; 12-s idea generation).
- fMRI data were acquired on a 3T Siemens Magnetom; preprocessing used SPM8; task functional connectivity used the CONN toolbox with CompCor; analyses included whole-brain MVPA, seed-to-voxel, and ROI-to-ROI temporal connectivity across five 2-s windows (TRs 2–6), plus resting-state connectivity in an independent n = 42 sample.
- Graph theory computed global efficiency of the whole-brain ROI network and correlated it with composite creativity scores (average of three raters; Cronbach’s alpha = .87) from an out-of-scanner alternate uses task.
Limitations
- Stated: the study could not capture participant responses in the scanner, limiting checks of task compliance and parametric analyses of response creative quality.
- Stated: it used a single assessment (alternate-uses divergent thinking) to index broadly defined creativity; future work should test other creative tasks and domains and clarify whether creative cognition differs from other imaginative processes in executive involvement.
- Evident in the text: the final fMRI sample was small (n = 25), and the key brain–behavior finding is correlational, so causal direction and generalizability remain uncertain.
Model-written summary. Check it against the paper before relying on it.
Integrity signals
Registry
Cites
Statistics
Figures



Verification
Claims the paper makes
10 Valid · 0 Not valid · 27 Not checked · 51 Own results and interpretations
Every source the paper cites for this claim was checked and supports it.
In the paper
“Emerging evidence, however, suggests that the executive and default networks actually cooperate whenever it is necessary to perform a task that requires extended evaluation of internal information8.”
§ Default and Executive Network Coupling Supports Creative Idea Production > The Present Research
What the sources say
- Supportedcites [8] Andrews-Hanna, J. R., Smallwood, J. & Spreng, R. N. The default network and self-generated thought: Component processes, dynamic control and clinical relevance. Ann. NY Acad. Sci., USA, 1316, 29–52. (2014). source
In the section 'Default and frontoparietal control network interactions', our copy states 'There is now a relatively extensive body of work suggesting that default and control networks can cooperate to perform particular mental operations,' and, after listing problem-solving with mental simulation, autobiographical planning, social working memory and evaluation of creative ideas, concludes 'All of these tasks depend on the maintenance or extended evaluation of internal information in the service of a goal, leading to the suggestion that these forms of large-scale interactions reflect temporally extended evaluation of self-generated thoughts.' This matches the cited sentence's content — emerging/hedged evidence for executive (frontoparietal control) and default network cooperation during tasks requiring extended evaluation of internal information. The only difference is wording: the source frames the cooperation as a suggestion drawn from these tasks (and adds 'in the service of a goal') rather than as an absolute 'whenever', but the same point is made at the same level of confidence ('suggesting', 'leading to the suggestion'). (LLM, conf=0.85)
hedgedstates an association- Asserted: passes — The authors put it forward as true.
- Checkable: passes — It can be checked against evidence.
- Load-bearing: passes — The paper’s conclusions depend on it.
- Based: passes — The paper gives a reason why it holds.
- Supported
The sources with a verdict support this claim; the rest weren’t checked yet, have no full text we could read, or their verdicts aren’t rated yet.
In the paper
“The DMN is associated with cognitive processes that require internally-directed or self-generated thought, such as mind-wandering10, future thinking11, perspective taking12, and mental simulation13.”
§ Default and Executive Network Coupling Supports Creative Idea Production > Large-Scale Networks and Creative Cognition
What the sources say
- Not checked yetcites [10] Mason, M. F. et al. Wandering minds: The default network and stimulus-independent thought. Sci., 315, 393–395 (2007). source
- Supportedcites [11] Schacter, D. L. et al. The future of memory: Remembering, imagining and the brain. Neuron, 76, 677–694 (2012). source
The citation attached to “future thinking” is supported by the section “The Default Network Can Couple Flexibly with Other Networks to Support Complex Goal-Directed Simulations” (page not provided), which links imagining personal futures and future simulations to default-network activity. The other examples in the citing sentence have separate citations and are not attributed to this source here. (LLM, conf=0.92)
- Not checked yetcites [12] Buckner, R. L. & Carroll, D. C. Self-projection and the brain. Trends Cogn. Sci., 11, 49–57 (2007). source
plainstates an association- Asserted: passes — The authors put it forward as true.
- Checkable: passes — It can be checked against evidence.
- Load-bearing: passes — The paper’s conclusions depend on it.
- Based: passes — The paper gives a reason why it holds.
The cited sources support only part of this claim — read each source’s verdict below.
In the paper
“Moreover, these regions correspond to the core hubs of large-scale networks that typically act in opposition1.”
§ Default and Executive Network Coupling Supports Creative Idea Production > Abstract
What the sources say
- Partly supportedcites [1] Fox, M. D. et al. The human brain is intrinsically organized into dynamic, anticorrelated functional networks. Proc. Natl. Acad. Sci. USA, 102, 9673–9678 (2005). sourceExperimental — accuracy not yet measured
The Results identify regions in two widely distributed networks and report that the networks’ activity is largely anticorrelated. They identify seed regions and peak foci, but do not establish that the regions are specifically network hubs; the citing sentence also does not identify which regions “these regions” refers to. (LLM, conf=0.78)
plain- Asserted: passes — The authors put it forward as true.
- Checkable: passes — It can be checked against evidence.
- Load-bearing: passes — The paper’s conclusions depend on it.
- Based: passes — The paper gives a reason why it holds.
- Partly supported
Every source the paper cites for this claim was checked and supports it.
In the paper
“Such findings suggest that DMN and ECN regions show increased coupling when attention is focused on internally-directed processes8.”
§ Default and Executive Network Coupling Supports Creative Idea Production > Discussion
What the sources say
- Supportedcites [8] Andrews-Hanna, J. R., Smallwood, J. & Spreng, R. N. The default network and self-generated thought: Component processes, dynamic control and clinical relevance. Ann. NY Acad. Sci., USA, 1316, 29–52. (2014). source
In 'Default and frontoparietal control network interactions' the paper reviews DN–control-network cooperation, stating that during autobiographical planning 'DN to FPCN coupling was found to be specific to actively imagining the steps necessary to attain a personal goal,' and that DN and FPCN coactivate during social working memory and creative evaluation, tasks that 'depend on the maintenance or extended evaluation of internal information in the service of a goal.' The same section notes 'a high level of intrinsic functional integration among the default and frontoparietal control systems,' and the Summary frames the FPCN as mediating internally and externally directed cognition. The citing sentence is hedged ('suggest'), matching the source's own hedging; the only wording shift is 'ECN' for the paper's FPCN, which the paper describes as the network playing 'an important role in executive control of attention.' (LLM, conf=0.85)
hedgedstates an association- Asserted: passes — The authors put it forward as true.
- Checkable: passes — It can be checked against evidence.
- Load-bearing: passes — The paper’s conclusions depend on it.
- Based: passes — The paper gives a reason why it holds.
- Supported
Every source the paper cites for this claim was checked and supports it.
In the paper
“For example, Benedek and colleagues29. found that generating new ideas during a divergent thinking task (responses participants identified as novel during functional imaging) was related to increased involvement of the left IPL, providing further support for a role of default mode regions in creative cognition.”
§ Default and Executive Network Coupling Supports Creative Idea Production > Large-Scale Networks and Creative Cognition
What the sources say
- Supportedcites [29] Benedek, M. et al. To create or to recall? Neural mechanisms underlying the generation of creative new ideas. NeuroImage, 88, 125–133 (2014). source
The Results (fMRI analysis, page not available) report significantly stronger activation in the left inferior parietal cortex when participants generated new ideas rather than recalled old ones. This directly supports the attributed finding about left IPL involvement during divergent thinking. (LLM, conf=0.93)
plainstates an association- Asserted: passes — The authors put it forward as true.
- Checkable: passes — It can be checked against evidence.
- Load-bearing: unclear — It is unclear whether the paper’s conclusions depend on it.
- Based: passes — The paper gives a reason why it holds.
- Supported
43 more claims · 1 with their cited sources checked
Create a free account to see all 88 claims and to verify the 49 references still open.
- It may state two separate claims as one. 23
- Probably not a substantial claim. 26
- The quote only partly states this claim. 1
Claims other papers make about this one
Each is checked against this paper’s own text: does it say what the citing paper says it does?
The source backs part of the claim, not all of it — or backs it for a different population, condition or comparison.
In the citing paper
“Moreover, dynamic functional connectivity analysis showed differential coupling of network hubs across the task duration; for example, the PCC showed early coupling with the right anterior insula and later coupling with the right DLPFC, among other regions (see Figure 1C).”
From Creative Cognition and Brain Network Dynamics (2016) · cites this paper as [26]
Experimental — accuracy not yet measuredThe source backs part of the claim, not all of it — or backs it for a different population, condition or comparison.
In the citing paper
“Indeed, several works indicate that dreaming and creativity may both involve regions of the DMN, and especially the prefrontal areas.23–28”
From High Dream Recall Frequency is Associated with Increased Creativity and Default Mode Network Connectivity (2022) · cites this paper as [28]
Experimental — accuracy not yet measuredThe source backs part of the claim, not all of it — or backs it for a different population, condition or comparison.
In the citing paper
“the generation of creative ideas is thought to be supported by a preferential recruitment of regions of the DMN, and particularly of the MPFC.24–28,47”
From High Dream Recall Frequency is Associated with Increased Creativity and Default Mode Network Connectivity (2022) · cites this paper as [28]
Experimental — accuracy not yet measuredThe source backs part of the claim, not all of it — or backs it for a different population, condition or comparison.
In the citing paper
“Studies of between-network functional connectivity (for review, see Beaty et al. 2016) using multivariate independent components analysis (ICA) and univariate region of interest (ROI) approaches have also suggested that components of the core network and frontoparietal cognitive control and dorsal and ventral attention networks may couple and decouple during various stages of divergent thinking”
From Neural Mechanisms of Episodic Retrieval Support Divergent Creative Thinking (2019) · cites this paper as Beaty et al. 2015
Experimental — accuracy not yet measuredThe cited source says what the claim attributes to it.
In the citing paper
“As depicted in Figure 1B, the posterior cingulate cortex (PCC) showed increased coupling with regions of the control network (i.e., DLPFC) and salience network (i.e., bilateral insula and anterior cingulate).”
From Creative Cognition and Brain Network Dynamics (2016) · cites this paper as [26]
3 more claims about this paper
Create a free account to see every claim other papers make about this one.
Self-check
Percentages, sums and reported differences re-computed from the paper’s own numbers.
Each contradiction between two passages listed here was confirmed by an independent check.
Rated minor: it would not touch a result — a value no result rests on, a p-value that stays on the same side of the significance level, or a conflict that is clerical, resolved elsewhere in the paper, or outside its own findings.
In the paper
§ Default and Executive Network Coupling Supports Creative Idea Production > Results > ROI-to-ROI Temporal Connectivity
“During the fifth time window, the precuneus showed connectivity with bilateral MTG and the left RLPFC; no significant connectivity differences were found during the final time window.”
§ Default and Executive Network Coupling Supports Creative Idea Production > Method > Seed-to-Voxel and ROI-to-ROI Analyses
“Due to the temporal lag in the BOLD signal, the first time window was not analyzed, resulting in five temporal windows for analysis (i.e., TRs 2-6).”
Rated minor: it would not touch a result — a value no result rests on, a p-value that stays on the same side of the significance level, or a conflict that is clerical, resolved elsewhere in the paper, or outside its own findings.
In the paper
§ Default and Executive Network Coupling Supports Creative Idea Production > Results > ROI-to-ROI Temporal Connectivity
“We then explored temporal connectivity with the right DLPFC target ROI.”
§ Default and Executive Network Coupling Supports Creative Idea Production > Results > ROI-to-ROI Temporal Connectivity
“The PCC, precuneus, and DLPPFC were specified as “source” ROIs, and the remaining ROIs were specified as “targets”.”
Citations
Cites
Collective dynamics of ‘small-world’ networks
Watts, D. J., & Strogatz, S. H. (1998) · Nature · doi:10.1038/30918 · Cited by 43,060
The Brain's Default Network: Anatomy, Function, and Relevance to Disease
Buckner, R. L., Andrews‐Hanna, J. R., & Schacter, D. L. (2008) · Annals of the New York Academy of Sciences · doi:10.1196/annals.1440.011 · Cited by 9,761
The human brain is intrinsically organized into dynamic, anticorrelated functional networks
Fox, M. D., Snyder, A. Z., Vincent, J. L., Corbetta, M., Van Essen, D. C., & Raichle, M. E. (2005) · Proceedings of the National Academy of Sciences · doi:10.1073/pnas.0504136102 · Cited by 8,553 · cited 2×
“Moreover, these regions correspond to the core hubs of large-scale networks that typically act in opposition (2).”
Dissociable intrinsic connectivity networks for salience processing and executive control
Seeley, W. W., Menon, V., Schatzberg, A. F., Keller, J., Glover, G. H., Kenna, H., Reiss, A. L., & Greicius, M. D. (2007) · The Journal of Neuroscience · doi:10.1523/jneurosci.5587-06.2007 · Cited by 7,426 · cited 3×
“increased activation while the DMN deactivates (3), presumably indicating the suppression of taskunrelated thought during cognitive control (33).”
BackgroundResultConn : A Functional Connectivity Toolbox for Correlated and Anticorrelated Brain Networks
Whitfield-Gabrieli, S., & Nieto-Castanon, A. (2012) · Brain Connectivity · doi:10.1089/brain.2012.0073 · Cited by 4,885
A component based noise correction method (CompCor) for BOLD and perfusion based fMRI
Behzadi, Y., Restom, K., Liau, J., & Liu, T. T. (2007) · NeuroImage · doi:10.1016/j.neuroimage.2007.04.042 · Cited by 4,502
The associative basis of the creative process.
Mednick, S. (1962) · Psychological Review · doi:10.1037/h0048850 · Cited by 4,140
Searching for a baseline: Functional imaging and the resting human brain
Gusnard, D. A., & Raichle, M. E. (2001) · Nature Reviews Neuroscience · doi:10.1038/35094500 · Cited by 3,371 · cited 1×
“One of the most widely studied networks is the default mode network (DMN), a set of midline and inferior parietal regions that activate in the absence of most external task demands (6, 7).”
BackgroundExploring the brain network: A review on resting-state fMRI functional connectivity
van den Heuvel, M. P., & Hulshoff Pol, H. E. (2010) · European Neuropsychopharmacology · doi:10.1016/j.euroneuro.2010.03.008 · Cited by 3,326
Wandering minds: the default network and stimulus-independent thought
Mason, M. F., Norton, M. I., Van Horn, J. D., Wegner, D. M., Grafton, S. T., & Macrae, C. N. (2007) · Science · doi:10.1126/science.1131295 · Cited by 2,792
Cited by
Mind-wandering as spontaneous thought: a dynamic framework
Christoff, K., Irving, Z. C., Fox, K. C. R., Spreng, R. N., & Andrews-Hanna, J. R. (2016) · Nature Reviews Neuroscience · doi:10.1038/nrn.2016.113 · Cited by 1,376
Creative Cognition and Brain Network Dynamics
Beaty, R. E., Benedek, M., Silvia, P. J., & Schacter, D. L. (2016) · Trends in Cognitive Sciences · doi:10.1016/j.tics.2015.10.004 · Cited by 1,105
“A recent study assessed dynamic interactions between brain regions during an alternate uses divergent thinking task [26].”
BackgroundResultInfluentialSelf-citationRobust prediction of individual creative ability from brain functional connectivity
Beaty, R. E., Kenett, Y. N., Christensen, A. P., Rosenberg, M. D., Benedek, M., Chen, Q., Fink, A., Qiu, J., Kwapil, T. R., Kane, M. J., et al. (2018) · Proceedings of the National Academy of Sciences · doi:10.1073/pnas.1713532115 · Cited by 820
“, box and rope), which were subsequently coded for creative quality by four trained raters along with the in-scanner responses, using a 1 (not at all creative) to 5 (very creative) scale; raters were instructed to consider uncommonness, remoteness, and cleverness when coding responses, but to provide a single holistic…”
BackgroundMethodResultInfluentialSelf-citationBeaty, R. E., Seli, P., & Schacter, D. L. (2019) · Current Opinion in Behavioral Sciences · doi:10.1016/j.cobeha.2018.08.013 · Cited by 296
“Other related work [34] found that a high divergent thinking group showed greater global efficiency within a resting-state network of executive and default nodes, similar to previous task-based research reporting a positive correlation between divergent thinking ability and global efficiency within a network of execut…”
ResultSelf-citationImmordino-Yang, M. H., Darling-Hammond, L., & Krone, C. R. (2019) · Educational Psychologist · doi:10.1080/00461520.2019.1633924 · Cited by 296
“…the Default Mode Network is also important for conceptual understanding, reading comprehension, creativity, nonlinear and “ out-of-the-box ” thinking (Beaty et al., 2015; Immordino-Yang et al., 2012; K € uhn et al., 2014), feelings of inspiration and intrinsic motivation, cognitively complex…”
Background
Metadata
- Authors
- Beaty, R. E., Benedek, M., Barry Kaufman, S., & Silvia, P. J.
- Affiliations
- University of North Carolina at Greensboro (US)
- University of Graz (AT)
- Corresponding author
- Beaty, Roger E.
- Venue
- Scientific Reports
- Published
- 2015-06-17
- Volume
- 5
- Issue
- 1
- Pages
- 10964-10964
- ISSN
- 2045-2322 (ISSN-L)
- PMC
- PMC4472024
- OpenAlex
- W2206828072
- Semantic Scholar
- b7780162bde0ed7daf4681a9be1e186dee293b1b
- Cited by
- 705
- References
- 75
- Citations by year
- 2026: 62 · 2025: 76 · 2024: 60 · 2023: 60 · 2022: 91 · 2021: 78 · 2020: 75 · 2019: 63 · 2018: 68 · 2017: 36 · 2016: 31 · 2015: 4
- FWCI
- 70.02
- Type
- journal article
- Language
- en
- Open access
- gold
- doi.org
- Licence
- cc-by
- creativecommons.org/licenses/by/4.0 (tdm)
- creativecommons.org/licenses/by/4.0 (vor)
- Locations
- Scientific Reports (publishedVersion, cc-by)
- Europe PMC (PubMed Central) (publishedVersion, cc-by)
- PubMed Central (publishedVersion, cc-by)
- PubMed (publishedVersion)
- NC Digital Online Collection of Knowledge and Scholarship (The University of North Carolina at Greensboro) (submittedVersion)
- Topics
- Social Sciences › Psychology › Experimental and Cognitive Psychology › Creativity in Education and Neuroscience
- Life Sciences › Neuroscience › Cognitive Neuroscience › Functional Brain Connectivity Studies
- Life Sciences › Neuroscience › Cognitive Neuroscience › Neural and Behavioral Psychology Studies
- Keywords
- divergent thinking, default mode network, frontoparietal network, salience network, posterior cingulate cortex, dorsolateral prefrontal cortex, insula, network coupling, spontaneous thought, top-down control, individual differences in creativity, network efficiency, dynamic functional connectivity
About these checks
Registry, retraction, Cites and statistics results are computed, not judged, with one exception: a printed reference that no index lists is read once by a model before it counts as a citation error. Claims are extracted by a model and kept only when their quote appears verbatim in the text; each cited source is then checked, with a model’s help, for whether it says what the claim relies on. Those verdicts can be wrong — read the claim’s quote and the cited source before relying on one.
The claim verdicts this report counts are experimental: their accuracy is not yet measured.
A language model drew the claims from the paper on 2026-10-04, under version 3 of the claim definition (model deepseek-v4.1-flash, prompt extract-v3).
A second model labelled each claim on 2026-10-04 (model jev-1.13-20260917, definition revision gold-guideline-v0.2).
Cited sources are checked with a language model’s help (qwen3.8-omni-flash and gpt-6-sol).
Statistics and arithmetic are recomputed, not judged.
Confidence bands are shown only for fields calibrated on our annotated test set. None is calibrated yet, so no band is shown.
What counts as a claim ›How we measure confidence ›How we check this ›
Are you an author, or do you see a problem with this page? Request a review
How to cite
Cite CoChat for the checks on this page, and the paper for its own findings.
- This page
- CoChat. (2026). Citation check: Default and Executive Network Coupling Supports Creative Idea Production. https://app.cochat.ai/papers/10.1038/srep10964
- The paper
- Beaty, R. E., Benedek, M., Barry Kaufman, S., & Silvia, P. J. (2015). Default and Executive Network Coupling Supports Creative Idea Production. Scientific Reports. https://doi.org/10.1038/srep10964
Data sources
Bibliographic data: Semantic Scholar, OpenAlex, Crossref.
Contains information from the Semantic Scholar Academic Graph Datasets, made available under the ODC Attribution License (ODC-BY 1.0).
Semantic Scholar’s data is described in: Kinney, R., et al. (2023). The Semantic Scholar Open Data Platform. arXiv:2301.10140.
