

The DOI matches its Crossref record; 59 of the 59 references it cites were found in a registry or an index.
Electronic Conduction in Ti/Poly-TiO2/Ti Structures
Open accessAbstract
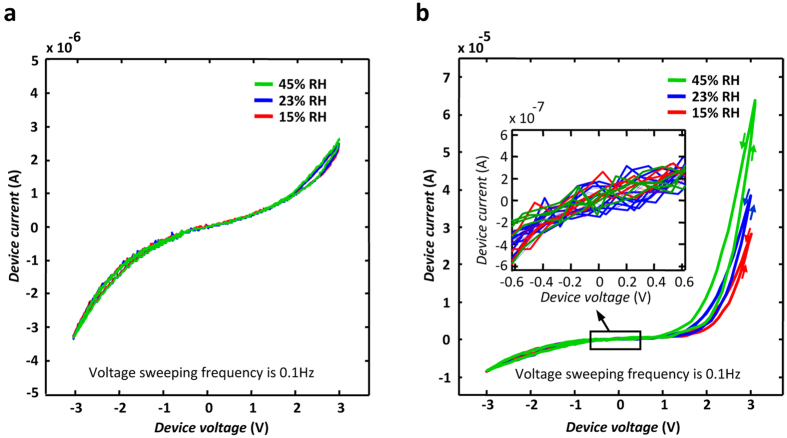
Recent intensive investigations on metal/metal oxide/metal structures have targeted nanometric single grain oxides at high electric fields. Similar research on thicker polycrystalline oxide layers can bridge the results to the prior literature on varistors and may uncover novel ionic/electronic features originating from the conduction mechanisms involving grain boundaries. Here, we investigate electronic conduction in Ti/poly-TiO 2−x/Ti structures with different oxygen vacancy distributions and describe the observed features based on the motion and rearrangement of the ionized oxygen vacancies (IOVs) on the grain facets rather than the grain interiors. Containing no interface energy barrier, Ti/poly-TiO 2/Ti devices demonstrate high resistance ohmic conduction at biasing fields below 5 × 10 6 V.m−1; higher fields drive the samples to a distinctly nonlinear and hysteretic low resistance status. The observed threshold is two orders of magnitude smaller than the typical resistance switching fields reported for the nanosized single grain memristors. This is consistent with the smaller activation energies reported for the IOV motion on the rutile facets than its interior. The presented model describes the observed dependence of the threshold field on the relative humidity of the surrounding air based on the lower activation energies reported for the hydroxyl-assisted IOV motion on the rutile facets.
Overview
The claims and statistics of this paper haven’t been checked yet.
Free: it reads the open-access text and checks the first 5 claims that cite a source we can check. Create a free account to check every claim.
Integrity signals
Registry
Cites
Statistics
Figures




Verification
Claims the paper makes
The claims and statistics of this paper haven’t been checked yet.
Free: it reads the open-access text and checks the first 5 claims that cite a source we can check. Create a free account to check every claim.
Claims other papers make about this one
Each is checked against this paper’s own text: does it say what the citing paper says it does?
The source backs part of the claim, not all of it — or backs it for a different population, condition or comparison.
In the citing paper
“This is because H2O molecules, used during the anodizing process, significantly reduce the activation energy19.”
From Experimental demonstration of highly reliable dynamic memristor for artificial neuron and neuromorphic computing (2022) · cites this paper as [19]
Experimental — accuracy not yet measuredThe cited source says what the claim attributes to it.
In the citing paper
“The calculated activation energy (EA) is about 0.21 eV, which is similar to the activation energy of the ionized oxygen vacancy in polycrystalline H2O-rich TiO219.”
From Experimental demonstration of highly reliable dynamic memristor for artificial neuron and neuromorphic computing (2022) · cites this paper as [19]
Self-check
Percentages, sums and reported differences re-computed from the paper’s own numbers.
The self-check needs the paper’s full text.
Citations
Cites
Physics of Semiconductor Devices
Sze, S. M., & Ng, K. K. (2006) · doi:10.1002/0470068329 · Cited by 14,627
Physics of Semiconductor Devices
(2002) · Kluwer Academic Publishers eBooks · doi:10.1007/b117561 · Cited by 13,963
Strukov, D. B., Snider, G. S., Stewart, D. R., & Williams, R. S. (2008) · Nature · doi:10.1038/nature06932 · Cited by 11,828
Redox‐Based Resistive Switching Memories – Nanoionic Mechanisms, Prospects, and Challenges
Waser, R., Dittmann, R., Staikov, G., & Szot, K. (2009) · Advanced Materials · doi:10.1002/adma.200900375 · Cited by 5,080
Nanoionics-based resistive switching memories
Waser, R., & Aono, M. (2007) · Nature Materials · doi:10.1038/nmat2023 · Cited by 4,923
Memristive switching mechanism for metal/oxide/metal nanodevices
Yang, J. J., Pickett, M. D., Li, X., Ohlberg, D. A. A., Stewart, D. R., & Williams, R. S. (2008) · Nature Nanotechnology · doi:10.1038/nnano.2008.160 · Cited by 2,987 · cited 1×
“The high field features of all samples are basically attributed to the motion and filament formation by the IOVs, which reportedly causes the resistance switching in rutile nanocrystals 5,6 .”
Resistive switching in transition metal oxides
Sawa, A. (2008) · Materials Today · doi:10.1016/s1369-7021(08)70119-6 · Cited by 2,948
Atomic structure of conducting nanofilaments in TiO2 resistive switching memory
Kwon, D.-H., Kim, K. M., Jang, J. H., Jeon, J. M., Lee, M. H., Kim, G. H., Li, X.-S., Park, G.-S., Lee, B., Han, S., et al. (2010) · Nature Nanotechnology · doi:10.1038/nnano.2009.456 · Cited by 2,092
‘Memristive’ switches enable ‘stateful’ logic operations via material implication
Borghetti, J., Snider, G. S., Kuekes, P. J., Yang, J. J., Stewart, D. R., & Williams, R. S. (2010) · Nature · doi:10.1038/nature08940 · Cited by 1,929
Switching the electrical resistance of individual dislocations in single-crystalline SrTiO3
Szot, K., Speier, W., Bihlmayer, G., & Waser, R. (2006) · Nature Materials · doi:10.1038/nmat1614 · Cited by 1,651
Research works printed but not linked: 2
- Schaub, R. et al. Oxygen-mediated diffusion of oxygen vacancies on the TiO2(110) surface. Science 299, 377–379 (2003).
- Wahlström, E. et al. Electron transfer-induced dynamics of oxygen molecules on the TiO2(110) surface. Science 303, 511–513 (2004).
Cited by
Park, S.-O., Jeong, H., Park, J., Bae, J., & Choi, S. (2022) · Nature Communications · doi:10.1038/s41467-022-30539-6 · Cited by 331
“19, 20.”
BackgroundInfluentialMemristive TiO2: Synthesis, Technologies, and Applications
Illarionov, G. A., Morozova, S. M., Chrishtop, V. V., Einarsrud, M., & Morozov, M. I. (2020) · Frontiers in Chemistry · doi:10.3389/fchem.2020.00724 · Cited by 94
Mohammad-Yousefi, S., Rahbarpour, S., & Ghafoorifard, H. (2019) · Materials Chemistry and Physics · doi:10.1016/j.matchemphys.2019.02.010 · Cited by 53
Electronic properties of Ag-doped ZnO: DFT hybrid functional study
Masoumi, S., Nadimi, E., & Hossein‐Babaei, F. (2018) · Physical Chemistry Chemical Physics · doi:10.1039/c8cp01578c · Cited by 42
Self-citationMasoumi, S., Shokrani, M., Aghili, S., & Hossein‐Babaei, F. (2019) · Sensors and Actuators B Chemical · doi:10.1016/j.snb.2019.05.063 · Cited by 39
Self-citation
Metadata
- Authors
- Hossein-Babaei, F., & Alaei-Sheini, N.
- Affiliations
- K. N. Toosi University of Technology (IR)
- ORCID
- Alaei-Sheini, Navid
- Venue
- Scientific Reports
- Published
- 2016-07-12
- Volume
- 6
- Issue
- 1
- Pages
- 29624-29624
- ISSN
- 2045-2322 (ISSN-L)
- PMC
- PMC4940738
- OpenAlex
- W2461224744
- Cited by
- 47
- References
- 59
- Citations by year
- 2025: 4 · 2024: 4 · 2023: 1 · 2022: 2 · 2021: 1 · 2020: 5 · 2019: 11 · 2018: 6 · 2017: 13
- FWCI
- 4.61
- Type
- journal article
- Language
- en
- Open access
- gold
- doi.org
- Licence
- cc-by
- creativecommons.org/licenses/by/4.0 (tdm)
- creativecommons.org/licenses/by/4.0 (vor)
- Locations
- Scientific Reports (publishedVersion, cc-by)
- Europe PMC (PubMed Central) (publishedVersion, cc-by)
- PubMed Central (publishedVersion, cc-by)
- PubMed (publishedVersion)
- Topics
- Physical Sciences › Engineering › Electrical and Electronic Engineering › Advanced Memory and Neural Computing
- Physical Sciences › Materials Science › Materials Chemistry › Dielectric properties of ceramics
- Physical Sciences › Engineering › Electrical and Electronic Engineering › Semiconductor materials and devices
- Keywords
- electronic conduction, oxygen vacancies, rutile, nonlinear conduction, hysteresis, threshold field, activation energy, relative humidity, varistors, memristors
About these checks
Registry, retraction, Cites and statistics results are computed, not judged, with one exception: a printed reference that no index lists is read once by a model before it counts as a citation error. Claims are extracted by a model and kept only when their quote appears verbatim in the text; each cited source is then checked, with a model’s help, for whether it says what the claim relies on. Those verdicts can be wrong — read the claim’s quote and the cited source before relying on one.
Statistics and arithmetic are recomputed, not judged.
Confidence bands are shown only for fields calibrated on our annotated test set. None is calibrated yet, so no band is shown.
What counts as a claim ›How we measure confidence ›How we check this ›
Are you an author, or do you see a problem with this page? Request a review
Data sources
Bibliographic data: Semantic Scholar, OpenAlex, Crossref.
Contains information from the Semantic Scholar Academic Graph Datasets, made available under the ODC Attribution License (ODC-BY 1.0).
Semantic Scholar’s data is described in: Kinney, R., et al. (2023). The Semantic Scholar Open Data Platform. arXiv:2301.10140.
