

Characterisation of sensitivity and orientation tuning for visually responsive ensembles in the zebrafish tectum
Open accessThe DOI matches its Crossref record; 78 of the 78 references it cites were found in a registry or an index.
Abstract
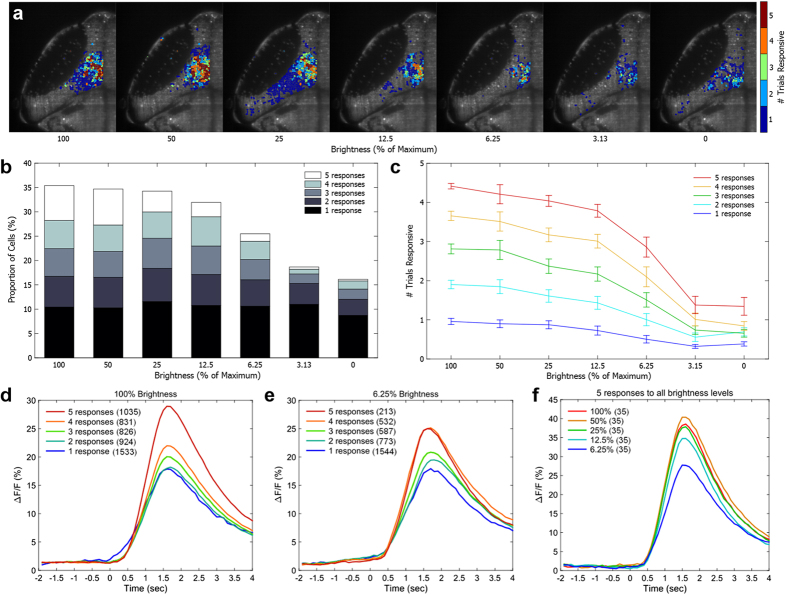
Sensory coding relies on ensembles of co-active neurons, but these ensembles change from trial to trial of the same stimulus. This is due in part to wide variability in the responsiveness of neurons within these ensembles, with some neurons responding regularly to a stimulus while others respond inconsistently. The specific functional properties that cause neurons to respond more or less consistently have not been thoroughly explored. Here, we have examined neuronal ensembles in the zebrafish tectum responsive to repeated presentations of a visual stimulus, and have explored how these populations change when the orientation or brightness of the stimulus is altered. We found a continuum of response probabilities across the neurons in the visual ensembles, with the most responsive neurons focused toward the spatial centre of the ensemble. As the visual stimulus was made dimmer, these neurons remained active, suggesting higher overall responsiveness. However, these cells appeared to represent the most consistent end of a continuum, rather than a functionally distinct "core" of highly responsive neurons. Reliably responsive cells were broadly tuned to a range of stimulus orientations suggesting that, at least for this stimulus property, tight stimulus tuning was not responsible for their consistent responses.
Overview
The claims and statistics of this paper haven’t been checked yet.
Free: it reads the open-access text and checks the first 5 claims that cite a source we can check. Create a free account to check every claim.
Integrity signals
Registry
Cites
Statistics
Figures


Verification
Claims the paper makes
The claims and statistics of this paper haven’t been checked yet.
Free: it reads the open-access text and checks the first 5 claims that cite a source we can check. Create a free account to check every claim.
Claims other papers make about this one
Each is checked against this paper’s own text: does it say what the citing paper says it does?
In the citing paper
“Response continuums have been observed in fish 51,52 and rodents 53 54 55”
From Neural network organization for courtship-song feature detection in Drosophila (2022) · cites this paper as [52]
In the citing paper
“and are thought to support more efficient encoding than would be possible with categorical representations.”
From Neural network organization for courtship-song feature detection in Drosophila (2022) · cites this paper as [52]
Self-check
Percentages, sums and reported differences re-computed from the paper’s own numbers.
The self-check needs the paper’s full text.
Citations
Cites
Receptive fields, binocular interaction and functional architecture in the cat’s visual cortex
Hubel, D. H., & Wiesel, T. N. (1962) · The Journal of Physiology · doi:10.1113/jphysiol.1962.sp006837 · Cited by 13,680
The zebrafish book : a guide for the laboratory use of zebrafish (Danio rerio)
Westerfield, M. (1995) · Medical Entomology and Zoology · Cited by 6,813
Ultrasensitive fluorescent proteins for imaging neuronal activity
Chen, T.-W., Wardill, T. J., Sun, Y., Pulver, S. R., Renninger, S. L., Baohan, A., Schreiter, E. R., Kerr, R. A., Orger, M. B., Jayaraman, V., et al. (2013) · Nature · doi:10.1038/nature12354 · Cited by 6,474
The Organization of Behavior; A Neuropsychological Theory.
Attneave, F., B., M., & Hebb, D. O. (1950) · The American Journal of Psychology · doi:10.2307/1418888 · Cited by 5,146
Gray, C. M., König, P., Engel, A. K., & Singer, W. (1989) · Nature · doi:10.1038/338334a0 · Cited by 4,183
Visual Feature Integration and the Temporal Correlation Hypothesis
Singer, W., & Gray, C. M. (1995) · Annual Review of Neuroscience · doi:10.1146/annurev.ne.18.030195.003011 · Cited by 3,123
A pyramid approach to subpixel registration based on intensity
Thevenaz, P., Ruttimann, U. E., & Unser, M. (1998) · IEEE Transactions on Image Processing · doi:10.1109/83.650848 · Cited by 3,078
Neuronal Synchrony: A Versatile Code for the Definition of Relations?
Singer, W. (1999) · Neuron · doi:10.1016/s0896-6273(00)80821-1 · Cited by 2,581
Stimulus-specific neuronal oscillations in orientation columns of cat visual cortex
Gray, C. M., & Singer, W. (1989) · Proceedings of the National Academy of Sciences · doi:10.1073/pnas.86.5.1698 · Cited by 2,463
Dynamics of the Hippocampal Ensemble Code for Space
Wilson, M. A., & McNaughton, B. L. (1993) · Science · doi:10.1126/science.8351520 · Cited by 2,350
Cited by
Altered brain-wide auditory networks in a zebrafish model of fragile X syndrome
Constantin, L., Poulsen, R. E., Scholz, L. A., Favre-Bulle, I. A., Taylor, M. A., Sun, B., Goodhill, G. J., Vanwalleghem, G. C., & Scott, E. K. (2020) · BMC Biology · doi:10.1186/s12915-020-00857-6 · Cited by 146
Integrative whole-brain neuroscience in larval zebrafish
.Vanwalleghem, G. C., Ahrens, M. B., & Scott, E. K. (2018) · Current Opinion in Neurobiology · doi:10.1016/j.conb.2018.02.004 · Cited by 127
Cellular-Resolution Imaging of Vestibular Processing across the Larval Zebrafish Brain
Favre‐Bulle, I. A., Vanwalleghem, G. C., Taylor, M. A., Rubinsztein-Dunlop, H. H., & Scott, E. K. (2018) · Current Biology · doi:10.1016/j.cub.2018.09.060 · Cited by 97
Not so spontaneous: Multi-dimensional representations of behaviors and context in sensory areas
Avitan, L., & Stringer, C. (2022) · Neuron · doi:10.1016/j.neuron.2022.06.019 · Cited by 71
Luminance Changes Drive Directional Startle through a Thalamic Pathway
Heap, L. A. L., Vanwalleghem, G., Thompson, A. W., Favre-Bulle, I. A., & Scott, E. K. (2018) · Neuron · doi:10.1016/j.neuron.2018.06.013 · Cited by 68
“Response strengths were similar across stimuli and brain regions (Figure 1D), consistent with past observations in the tectum (Thompson and Scott, 2016).”
Metadata
- Authors
- Thompson, A. W., & Scott, E. K.
- Affiliations
- The University of Queensland (AU)
- Corresponding author
- Thompson, A. W.
- Scott, E. K.
- Venue
- Scientific Reports
- Published
- 2016-10-07
- Volume
- 6
- Issue
- 1
- Pages
- 34887-34887
- ISSN
- 2045-2322 (ISSN-L)
- PMC
- PMC5054398
- OpenAlex
- W2529266101
- Cited by
- 26
- References
- 78
- Citations by year
- 2026: 2 · 2025: 1 · 2024: 2 · 2023: 5 · 2022: 4 · 2021: 1 · 2020: 2 · 2019: 2 · 2018: 5 · 2017: 2
- FWCI
- 1.90
- Type
- journal article
- Language
- en
- Open access
- gold
- doi.org
- Licence
- cc-by
- creativecommons.org/licenses/by/4.0 (tdm)
- creativecommons.org/licenses/by/4.0 (vor)
- Locations
- Scientific Reports (publishedVersion, cc-by)
- PubMed Central (publishedVersion, cc-by)
- PubMed (publishedVersion)
- Funders
- Howard Hughes Medical Institute
- National Health and Medical Research Council (FT110100887, DP140102036, DP110103612, 1066887)
- Topics
- Life Sciences › Neuroscience › Cognitive Neuroscience › Visual perception and processing mechanisms
- Life Sciences › Neuroscience › Cognitive Neuroscience › Neural dynamics and brain function
- Life Sciences › Neuroscience › Cellular and Molecular Neuroscience › Neuroscience and Neuropharmacology Research
- Keywords
- neuronal ensembles, visual responses, orientation tuning, brightness, response variability, ensemble coding, sensory coding, response probability
- MeSH terms
- Animals, Larva, Neurons, Photic Stimulation, Superior Colliculi, Zebrafish, Animals, Genetically Modified
About these checks
Registry, retraction, Cites and statistics results are computed, not judged, with one exception: a printed reference that no index lists is read once by a model before it counts as a citation error. Claims are extracted by a model and kept only when their quote appears verbatim in the text; each cited source is then checked, with a model’s help, for whether it says what the claim relies on. Those verdicts can be wrong — read the claim’s quote and the cited source before relying on one.
Statistics and arithmetic are recomputed, not judged.
Confidence bands are shown only for fields calibrated on our annotated test set. None is calibrated yet, so no band is shown.
What counts as a claim ›How we measure confidence ›How we check this ›
Are you an author, or do you see a problem with this page? Request a review
Data sources
Bibliographic data: Semantic Scholar, OpenAlex, Crossref.
Contains information from the Semantic Scholar Academic Graph Datasets, made available under the ODC Attribution License (ODC-BY 1.0).
Semantic Scholar’s data is described in: Kinney, R., et al. (2023). The Semantic Scholar Open Data Platform. arXiv:2301.10140.
