Cited by 151Biosensors and Analytical DetectionOcular Surface and Contact LensElectrowetting and Microfluidic Technologies

The DOI matches its Crossref record; 40 of the 40 references it cites were found in a registry or an index.

Paper-based microfluidic system for tear electrolyte analysis

Open access
Yetisen, Ali K., Jiang, Nan, Tamayol, Ali, Ruiz-Esparza, Guillermo U., Zhang, Yu Shrike, Medina-Pando, Sofía, Gupta, Aditi, Wolffsohn, James S., Butt, Haider, Khademhosseini, Ali, Yun, Seok-Hyun·2017·Lab on a Chip

Abstract

This article describes a paper-based microfluidic system that quantifies the concentrations of tear electrolytes using a smartphone-based reader.

Overview

The claims and statistics of this paper haven’t been checked yet.

Run the check — free, no account needed. It reads the open-access text and checks the sources it cites.

A few free checks a day · papers already verified open instantly · results are public

Integrity signals

Registry

Crossref · 10.1039/c6lc01450j

Cites

40 of 40 references verified0 citation errors · 0 not checkable

Statistics

Figures

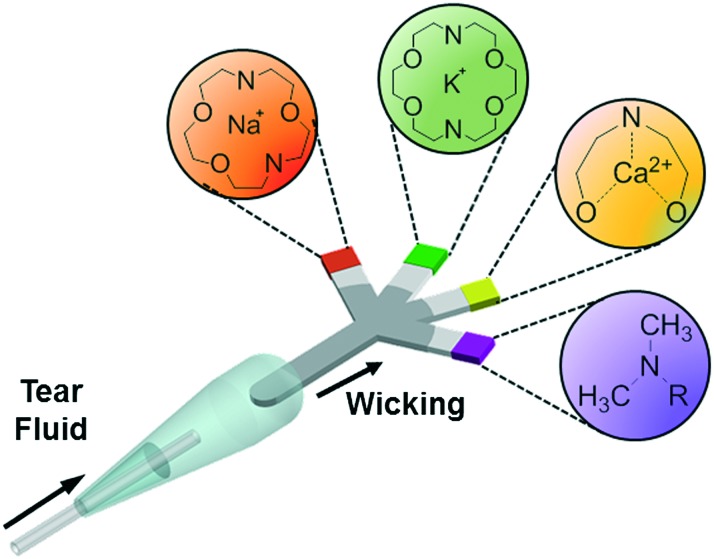
Fig. 1 Principle of operation of the paper-based microfluidic system for the quantitative analysis of electrolytes in tear film.
Fig. 1 Principle of operation of the paper-based microfluidic system for the quantitative analysis of electrolytes in tear film.CC BY · PubMed Central
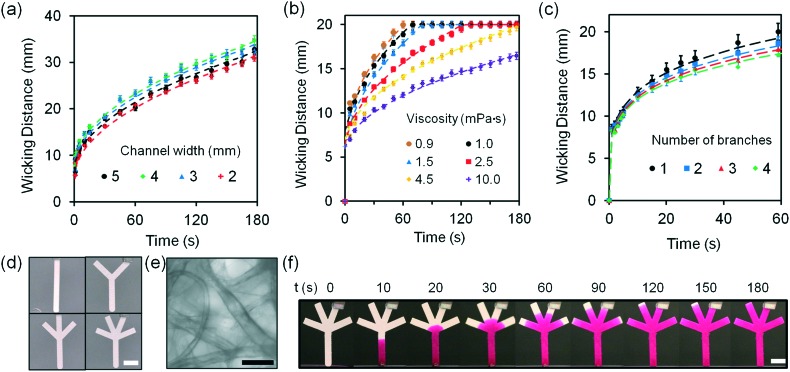
Fig. 2 Fluid dynamics characterization of G1 paper-based microfluidic devices at 24 °C. (a) Wicking distances of G1 strips as the width was varied from 2.0 to 5.0 mm. (b) The effect of increase in fluid viscosity from 1.0 to 10.0 mPa s on wicking distance in G1 strips (20 mm in length and 2 mm in width). Fluid viscosities were varied by changing the concentration of glucose (10 μL) from 0.5 to 3.0 mol L–1. (c) Wicking distances as the number of branches was increased from 1 to 4 within 60 s. Sample volume was 10 μL. (d) Photographs of paper-based microfluidic devices with different numbers of branches (1 to 4). Scale bar = 4 mm. (e) Bright-field microscopic image of G1 matrix. Scale bar = 50 μm. (f) Photographs of a four-channel paper-based microfluidic device, where Rhodamine B solution (10 mmol L–1) was used to show fluid diffusion as a function of time. Scale bar = 4 mm. Error bars represent standard error of the mean (n = 3).
Fig. 2 Fluid dynamics characterization of G1 paper-based microfluidic devices at 24 °C. (a) Wicking distances of G1 strips as the width was varied from 2.0 to 5.0 mm. (b) The effect of increase in fluid viscosity from 1.0 to 10.0 mPa s on wicking distance in G1 strips (20 mm in length and 2 mm in width). Fluid viscosities were varied by changing the concentration of glucose (10 μL) from 0.5 to 3.0 mol L–1. (c) Wicking distances as the number of branches was increased from 1 to 4 within 60 s. Sample volume was 10 μL. (d) Photographs of paper-based microfluidic devices with different numbers of branches (1 to 4). Scale bar = 4 mm. (e) Bright-field microscopic image of G1 matrix. Scale bar = 50 μm. (f) Photographs of a four-channel paper-based microfluidic device, where Rhodamine B solution (10 mmol L–1) was used to show fluid diffusion as a function of time. Scale bar = 4 mm. Error bars represent standard error of the mean (n = 3).CC BY · PubMed Central
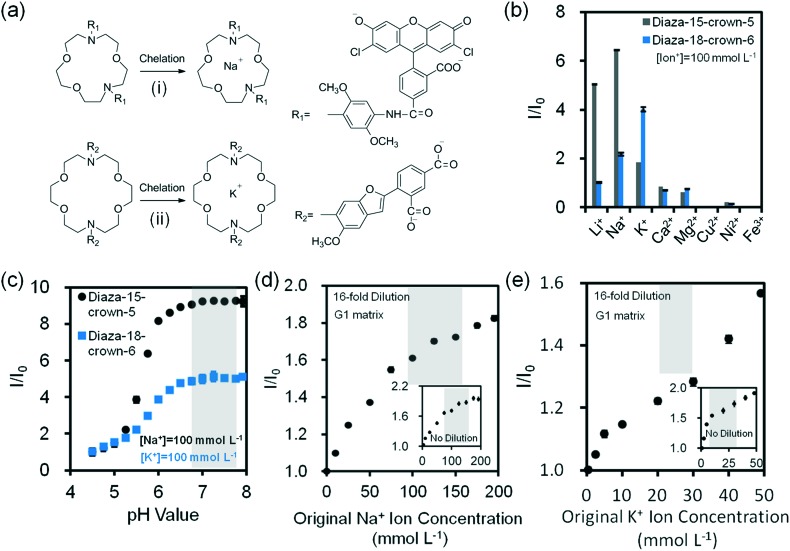
Fig. 3 Na+ and K+ ion measurements using fluorescent crown ether derivatives in buffer solutions (Tris, pH 7.4, 150 mmol L–1) at 24 °C. (a) Chelation mechanisms of fluorescent (i) diaza-15-crown-5 and (ii) diaza-18-crown-6 with monovalent metal ions. (b) Selectivities of diaza-15-crown-5 (λ ex/λ em: 485/528 nm) and diaza-18-crown-6 (λ ex/λ em: 360/460 nm) (25 μmol L–1) for mono/divalent ions (100 mmol L–1) in aqueous solutions (n = 3). (c) The effect of pH on fluorescence readouts at constant Na+ and K+ ions (100 mmol L–1), and diaza-15-crown-5 and diaza-18-crown-6 (25 μmol L–1) concentrations in aqueous solutions (n = 3). Quantifications of 16-fold diluted (d) Na+ and (e) K+ ions on G1 matrix at a constant probe concentration (25 μmol L–1) (n = 6). Insets show the quantifications of non-diluted Na+ and K+ ions on G1 matrix (n = 3). Shadows in Fig. 3c–e show the physiological pH, Na+ and K+ ion concentration range. Error bars represent standard error of the mean.
Fig. 3 Na+ and K+ ion measurements using fluorescent crown ether derivatives in buffer solutions (Tris, pH 7.4, 150 mmol L–1) at 24 °C. (a) Chelation mechanisms of fluorescent (i) diaza-15-crown-5 and (ii) diaza-18-crown-6 with monovalent metal ions. (b) Selectivities of diaza-15-crown-5 (λ ex/λ em: 485/528 nm) and diaza-18-crown-6 (λ ex/λ em: 360/460 nm) (25 μmol L–1) for mono/divalent ions (100 mmol L–1) in aqueous solutions (n = 3). (c) The effect of pH on fluorescence readouts at constant Na+ and K+ ions (100 mmol L–1), and diaza-15-crown-5 and diaza-18-crown-6 (25 μmol L–1) concentrations in aqueous solutions (n = 3). Quantifications of 16-fold diluted (d) Na+ and (e) K+ ions on G1 matrix at a constant probe concentration (25 μmol L–1) (n = 6). Insets show the quantifications of non-diluted Na+ and K+ ions on G1 matrix (n = 3). Shadows in Fig. 3c–e show the physiological pH, Na+ and K+ ion concentration range. Error bars represent standard error of the mean.CC BY · PubMed Central
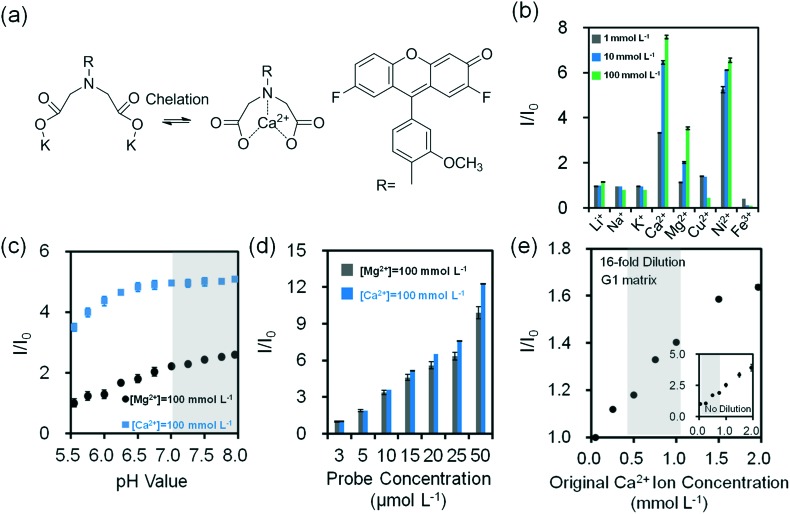
Fig. 4 Quantification of divalent metal ions in buffer solution (Tris, pH 7.4, 150 mmol L–1) at 24 °C. (a) Chelation mechanism of o-acetanisidide with divalent metal ions. (b) Fluorescence readouts of o-acetanisidide (λ ex/λ em: 485/528 nm) in the presence mono/divalent metal ions in aqueous solutions (n = 3). (c) The effect of pH on fluorescence readouts of o-acetanisidide (25 μmol L–1) at constant Mg2+ and Ca2+ ion concentrations (100 mmol L–1) in aqueous solutions (n = 3). (d) Fluorescence intensity readouts of Mg2+ and Ca2+ ions (100 mmol L–1) as the concentration of o-acetanisidide were varied from 3–50 μmol L–1 (n = 3). (e) Quantification of 16-fold diluted Ca2+ ions on G1 matrix at a constant o-acetanisidide concentration (25 μmol L–1) (n = 6). Insets show the quantification of non-diluted Ca2+ ions on G1 matrix (n = 3). Shadows in Fig. 4c and e show the physiological pH and Ca2+ ion concentration range. Error bars represent standard error of the mean.
Fig. 4 Quantification of divalent metal ions in buffer solution (Tris, pH 7.4, 150 mmol L–1) at 24 °C. (a) Chelation mechanism of o-acetanisidide with divalent metal ions. (b) Fluorescence readouts of o-acetanisidide (λ ex/λ em: 485/528 nm) in the presence mono/divalent metal ions in aqueous solutions (n = 3). (c) The effect of pH on fluorescence readouts of o-acetanisidide (25 μmol L–1) at constant Mg2+ and Ca2+ ion concentrations (100 mmol L–1) in aqueous solutions (n = 3). (d) Fluorescence intensity readouts of Mg2+ and Ca2+ ions (100 mmol L–1) as the concentration of o-acetanisidide were varied from 3–50 μmol L–1 (n = 3). (e) Quantification of 16-fold diluted Ca2+ ions on G1 matrix at a constant o-acetanisidide concentration (25 μmol L–1) (n = 6). Insets show the quantification of non-diluted Ca2+ ions on G1 matrix (n = 3). Shadows in Fig. 4c and e show the physiological pH and Ca2+ ion concentration range. Error bars represent standard error of the mean.CC BY · PubMed Central
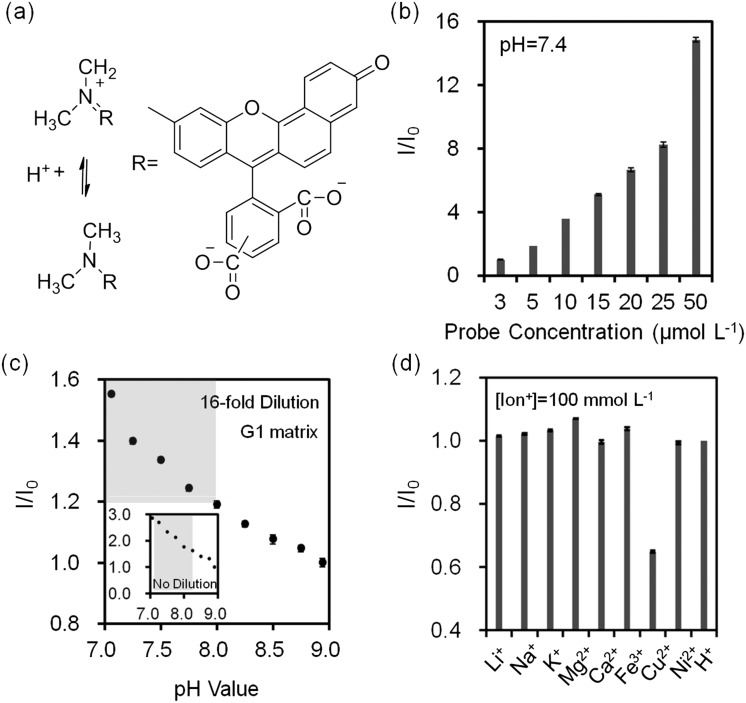
Fig. 5 Quantification of pH values in buffer solutions (Tris, 150 mmol L–1) at 24 °C. (a) Principle of operation of seminaphtorhodafluor. (b) Fluorescence intensity readouts as the concentration of seminaphtorhodafluor (λ ex/λ em: 530/590 nm) was varied from 3–50 μmol L–1 at pH = 7.4 in aqueous solutions (n = 3). (c) Quantification of Tris buffer pH (inset) and 16-fold diluted Tris buffer (150 mmol L–1, pH = 7.4) on G1 matrix at a constant seminaphtorhodafluor concentration (25 μmol L–1) (n = 6). Insets show the quantification of non-diluted Tris buffer on G1 matrix (n = 3). Shadows in Fig. 5c show the physiological pH range. (d) Relative fluorescence intensity readouts of mono/divalent ions at a constant concentration of seminaphtorhodafluor (25 μmol L–1) at pH 7.4 (n = 3). Error bars represent standard error of the mean.
Fig. 5 Quantification of pH values in buffer solutions (Tris, 150 mmol L–1) at 24 °C. (a) Principle of operation of seminaphtorhodafluor. (b) Fluorescence intensity readouts as the concentration of seminaphtorhodafluor (λ ex/λ em: 530/590 nm) was varied from 3–50 μmol L–1 at pH = 7.4 in aqueous solutions (n = 3). (c) Quantification of Tris buffer pH (inset) and 16-fold diluted Tris buffer (150 mmol L–1, pH = 7.4) on G1 matrix at a constant seminaphtorhodafluor concentration (25 μmol L–1) (n = 6). Insets show the quantification of non-diluted Tris buffer on G1 matrix (n = 3). Shadows in Fig. 5c show the physiological pH range. (d) Relative fluorescence intensity readouts of mono/divalent ions at a constant concentration of seminaphtorhodafluor (25 μmol L–1) at pH 7.4 (n = 3). Error bars represent standard error of the mean.CC BY · PubMed Central
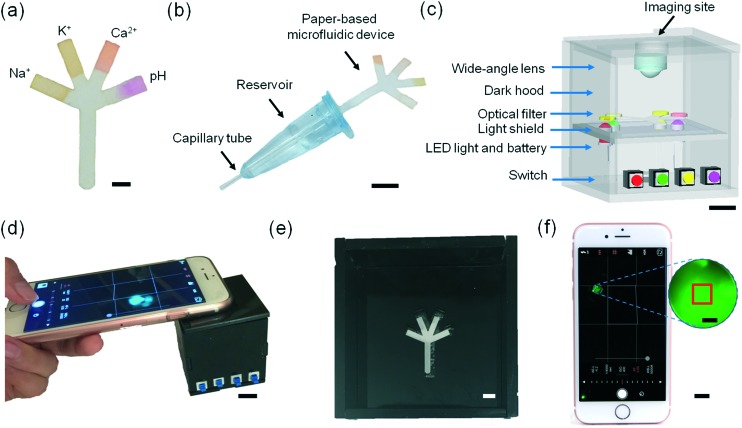
Fig. 6 Microfluidic system for tear fluid analysis. (a) Paper-based microfluidic device impregnated with fluorescent probes. Scale bar = 2 mm. (b) Sample collection and dilution device using a capillary tube. Scale bar = 1 cm. (c) The schematic of the portable readout device. Scale bar = 1 cm. (d) The use of the portable readout device for capturing the image of the fluorescent probes. Scale bar = 1 cm. (e) Photograph of the interlayer groove to place the paper-based microfluidic device. Scale bar = 4 mm. (f) Screenshot of the smartphone app capturing an assay image. Scale bar = 1 cm. Red square (1 × 1 mm2) in the magnified screenshot (blue dashes) shows the selected sensing region. Scale bar = 1 mm.
Fig. 6 Microfluidic system for tear fluid analysis. (a) Paper-based microfluidic device impregnated with fluorescent probes. Scale bar = 2 mm. (b) Sample collection and dilution device using a capillary tube. Scale bar = 1 cm. (c) The schematic of the portable readout device. Scale bar = 1 cm. (d) The use of the portable readout device for capturing the image of the fluorescent probes. Scale bar = 1 cm. (e) Photograph of the interlayer groove to place the paper-based microfluidic device. Scale bar = 4 mm. (f) Screenshot of the smartphone app capturing an assay image. Scale bar = 1 cm. Red square (1 × 1 mm2) in the magnified screenshot (blue dashes) shows the selected sensing region. Scale bar = 1 mm.CC BY · PubMed Central
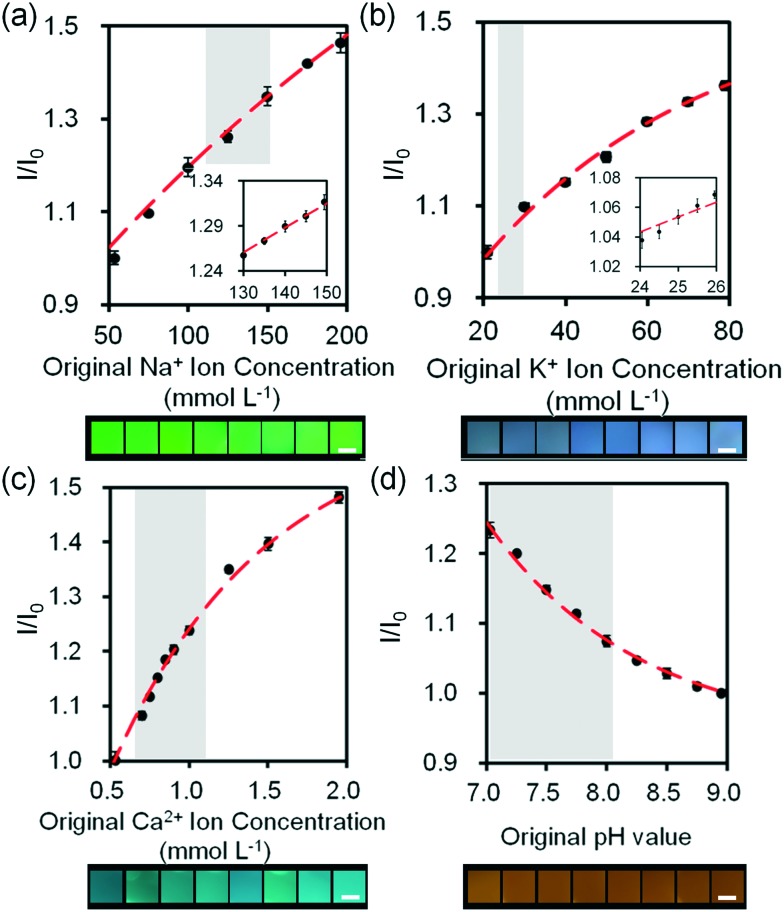
Fig. 7 Quantifications of electrolytes in artificial tear fluid using the smartphone readout system: (a) Na+ ions, (b) K+ ions, (c) Ca2+ ions and (d) H+ ions sensing. Scale bars = 2 mm. Insets in (a) and (b) show Na+ ion concentration in the range of 130–150 mmol L–1 and K+ ion concentration in the range of 24–26 mmol L–1. Error bars represent standard error of the mean (n = 6). Curves (red dashes) were fitted using eqn (3). Shadows show the physiological Na+, K+, Ca2+ ion concentration and pH ranges.
Fig. 7 Quantifications of electrolytes in artificial tear fluid using the smartphone readout system: (a) Na+ ions, (b) K+ ions, (c) Ca2+ ions and (d) H+ ions sensing. Scale bars = 2 mm. Insets in (a) and (b) show Na+ ion concentration in the range of 130–150 mmol L–1 and K+ ion concentration in the range of 24–26 mmol L–1. Error bars represent standard error of the mean (n = 6). Curves (red dashes) were fitted using eqn (3). Shadows show the physiological Na+, K+, Ca2+ ion concentration and pH ranges.CC BY · PubMed Central
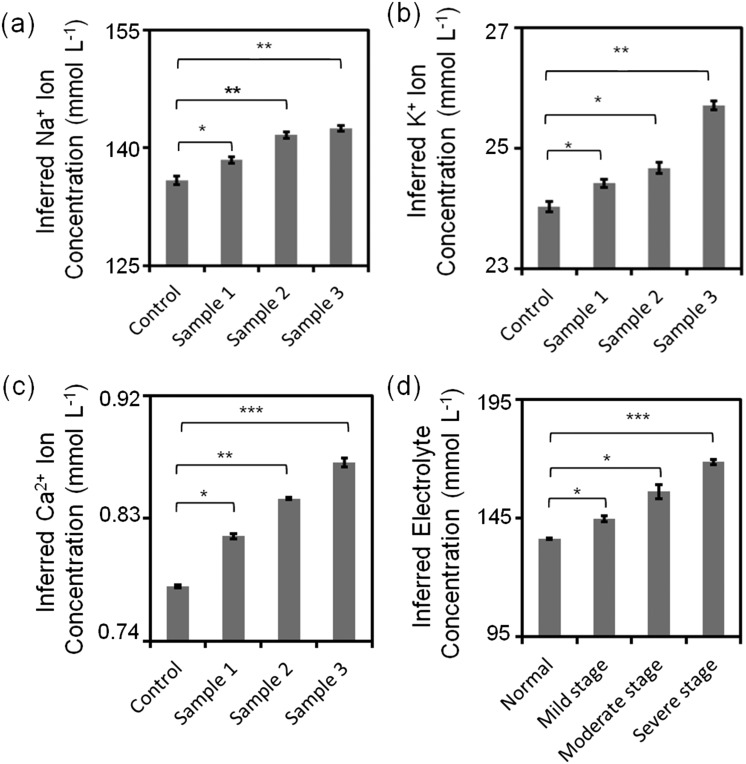
Fig. 8 Quantitative analysis of simulated artificial tear samples. (a) Sub-type differentiation of dry eye: inferred (a) Na+, (b) K+, (c) Ca2+ ion concentrations and (d) different stages of dry eye. *: p < 0.05, **: p < 0.01, ***: p < 0.001, compared with control. Error bars represent standard error of the mean (n = 3).
Fig. 8 Quantitative analysis of simulated artificial tear samples. (a) Sub-type differentiation of dry eye: inferred (a) Na+, (b) K+, (c) Ca2+ ion concentrations and (d) different stages of dry eye. *: p < 0.05, **: p < 0.01, ***: p < 0.001, compared with control. Error bars represent standard error of the mean (n = 3).CC BY · PubMed Central

Verification

Claims the paper makes

The claims and statistics of this paper haven’t been checked yet.

Run the check — free, no account needed. It reads the open-access text and checks the sources it cites.

A few free checks a day · papers already verified open instantly · results are public

Claims other papers make about this one

Each is checked against this paper’s own text: does it say what the citing paper says it does?

Self-check

Percentages, sums and reported differences re-computed from the paper’s own numbers.

The self-check needs the paper’s full text.

Citations

Cites

Show all 40 references

Research works printed but not linked: 6

  1. Craig, 1997, Optom. Vis. Sci., 74, 8, 10.1097/00006324-199701000-00014 · DOI
  2. Holly, 1984, Trans. Ophthalmol. Soc. U. K., 104, 374
  3. King-Smith, 2000, Invest. Ophthalmol. Visual Sci., 41, 3348
  4. Begley, 2000, Optom. Vis. Sci., 77, 40, 10.1097/00006324-200001000-00012 · DOI
  5. Hamano, 1991, Nippon Ganka Kiyo, 42, 719
  6. Gilbard, 1994, Int. Ophthalmol. Clin., 34, 27, 10.1097/00004397-199403410-00005 · DOI

Cited by

Sorted by citations

See all 151

Metadata

Authors
Yetisen, A. K., Jiang, N., Tamayol, A., Ruiz-Esparza, G. U., Zhang, Y. S., Medina-Pando, S., Gupta, A., Wolffsohn, J. S., Butt, H., Khademhosseini, A., & Yun, S.-H.
Affiliations
  • Brigham and Women's Hospital (US)
  • Biomaterials Innovation Research Center
  • Harvard–MIT Division of Health Sciences and Technology (US)
  • Aston University (GB)
  • University of Birmingham (GB)
  • Harvard University (US)
Corresponding author
  • Yetisen, Ali K.
  • Yun, Seok-Hyun
Venue
Lab on a Chip
Published
2017
Volume
17
Issue
6
Pages
1137-1148
ISSN
  • 1473-0189 (ISSN-L)
  • 1473-0197
OpenAlex
W2588545273
Cited by
151
References
40
Citations by year
2026: 11 · 2025: 15 · 2024: 17 · 2023: 8 · 2022: 17 · 2021: 26 · 2020: 21 · 2019: 16 · 2018: 14 · 2017: 5
FWCI
6.90
Type
journal article
Language
en
Open access
Licence
cc-by
Locations
  • Lab on a Chip (publishedVersion, cc-by)
  • Europe PMC (PubMed Central) (publishedVersion, cc-by)
  • PubMed Central (publishedVersion, cc-by)
  • PubMed (publishedVersion)
  • Aston Publications Explorer (Aston University) (acceptedVersion)
  • University of Birmingham Research Portal (University of Birmingham) (submittedVersion, cc-by)
  • Spiral (Imperial College London) (submittedVersion, cc-by)
Funders
  • Wellcome Trust (201929/Z/16/Z)
  • Royal Society
Topics
  • Physical Sciences › Engineering › Biomedical Engineering › Biosensors and Analytical Detection
  • Health Sciences › Medicine › Ophthalmology › Ocular Surface and Contact Lens
  • Physical Sciences › Engineering › Electrical and Electronic Engineering › Electrowetting and Microfluidic Technologies
Keywords
paper-based microfluidics, dry eye, pH measurement
MeSH terms
Electrolytes, Equipment Design, Humans, Paper, Potassium, Sodium, Tears, Dry Eye Syndromes, Microfluidic Analytical Techniques

About these checks

Registry, retraction, Cites and statistics results are computed, not judged, with one exception: a printed reference that no index lists is read once by a model before it counts as a citation error. Claims are extracted by a model and kept only when their quote appears verbatim in the text; each cited source is then checked, with a model’s help, for whether it says what the claim relies on. Those verdicts can be wrong — read the claim’s quote and the cited source before relying on one.

Statistics and arithmetic are recomputed, not judged.

Confidence bands are shown only for fields calibrated on our annotated test set. None is calibrated yet, so no band is shown.

What counts as a claim ›How we measure confidence ›How we check this ›

Are you an author, or do you see a problem with this page? Request a review