CoChat

Phosphatidylserine binding directly regulates TIM-3 function

Open access

The DOI matches its Crossref record; 88 of the 88 references it cites were found in a registry or an index.

Abstract

Co-signaling receptors for the T cell receptor (TCR) are important therapeutic targets, with blockade of co-inhibitory receptors such as PD-1 now central in immuno-oncology. Advancing additional therapeutic immune modulation approaches requires understanding ligand regulation of other co-signaling receptors. One poorly understood potential therapeutic target is TIM-3 (T cell immunoglobulin and mucin domain containing-3). Which of TIM-3's several proposed regulatory ligands is/are relevant for signaling is unclear, and different studies have reported TIM-3 as a co-inhibitory or co-stimulatory receptor in T cells. Here, we show that TIM-3 promotes NF-κB signaling and IL-2 secretion following TCR stimulation in Jurkat cells, and that this activity is regulated by binding to phosphatidylserine (PS). TIM-3 signaling is stimulated by PS exposed constitutively in cultured Jurkat cells, and can be blocked by mutating the PS-binding site or by occluding this site with an antibody. We also find that TIM-3 signaling alters CD28 phosphorylation. Our findings clarify the importance of PS as a functional TIM-3 ligand, and may inform the future exploitation of TIM-3 as a therapeutic target.

Overview

The claims and statistics of this paper haven’t been checked yet.

Free: it reads the open-access text and checks the first 5 claims that cite a source we can check. Create a free account to check every claim.

A few free checks a day · papers already verified open instantly · results are public

Integrity signals

Registry

Crossref · 10.1042/bcj20210425

Cites

88 of 88 references verified0 citation errors · 0 not checkable

Statistics

Figures

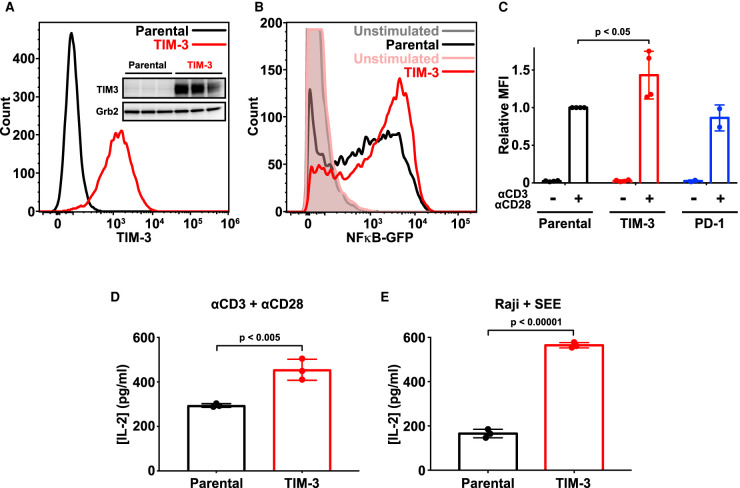
Figure 1. Ectopic expression of TIM-3 enhances activation of Jurkat cells. (A) Flow cytometry analysis of human TIM-3 expression in parental (black) and TIM-3 lentivirus-transduced NF-κB GFP reporter Jurkat cells (red), detected with phycoerythrin-conjugated TIM-3 antibody. The inset shows Western blot analysis of TIM-3 expression in the same cells as marked — with three biological repeats of each. (B) Representative histogram of NF-κB-driven GFP expression in stimulated NF-κB reporter cells (black), and those expressing TIM-3 (red) — compared with unstimulated parental (gray) and TIM-3-expressing (pink) cells. Stimulation employed 1 μg/ml αCD3 plus 1 μg/ml αCD28 for 16 h to mimic antigen binding. T cell activation was quantified by flow cytometry analysis of the GFP reporter of NFκB transcriptional activity. Enhanced T cell activation in TIM-3-expressing cells requires cell stimulation, with no change being observed in unstimulated cells. (C) Mean GFP fluorescence intensity (MFI) values for NF-κB GFP reporter assays in cells stimulated as in (B) relative to parental NF-κB reporter cells (black). Data represent the mean ± standard deviation (SD) for four biological repeats for parental and TIM-3-expressing cells (red) and two repeats for PD-1-expressing cells (blue). P-value for the TIM-3/parental comparison was determined with a two-tailed, unpaired Student's t-test. (D) ELISA analysis of IL-2 secretion into the medium of parental and TIM-3+ NF-κB reporter cells following stimulation as in (B). Data represent mean ± SD across three biological repeats, with P-value determined using a two-tailed, unpaired Student's t-test. (E) IL-2 production by parental and TIM-3-expressing Jurkat NF-κB/GFP reporter cells stimulated with SEE-loaded Raji B cells to mimic the formation of the immunological synapse during T cell activation. IL-2 levels were quantified by ELISA. Data represent mean ± SD for three biological repeats, with P-value determined using a two-tailed, unpaired Student's t-test.
Figure 1. Ectopic expression of TIM-3 enhances activation of Jurkat cells. (A) Flow cytometry analysis of human TIM-3 expression in parental (black) and TIM-3 lentivirus-transduced NF-κB GFP reporter Jurkat cells (red), detected with phycoerythrin-conjugated TIM-3 antibody. The inset shows Western blot analysis of TIM-3 expression in the same cells as marked — with three biological repeats of each. (B) Representative histogram of NF-κB-driven GFP expression in stimulated NF-κB reporter cells (black), and those expressing TIM-3 (red) — compared with unstimulated parental (gray) and TIM-3-expressing (pink) cells. Stimulation employed 1 μg/ml αCD3 plus 1 μg/ml αCD28 for 16 h to mimic antigen binding. T cell activation was quantified by flow cytometry analysis of the GFP reporter of NFκB transcriptional activity. Enhanced T cell activation in TIM-3-expressing cells requires cell stimulation, with no change being observed in unstimulated cells. (C) Mean GFP fluorescence intensity (MFI) values for NF-κB GFP reporter assays in cells stimulated as in (B) relative to parental NF-κB reporter cells (black). Data represent the mean ± standard deviation (SD) for four biological repeats for parental and TIM-3-expressing cells (red) and two repeats for PD-1-expressing cells (blue). P-value for the TIM-3/parental comparison was determined with a two-tailed, unpaired Student's t-test. (D) ELISA analysis of IL-2 secretion into the medium of parental and TIM-3+ NF-κB reporter cells following stimulation as in (B). Data represent mean ± SD across three biological repeats, with P-value determined using a two-tailed, unpaired Student's t-test. (E) IL-2 production by parental and TIM-3-expressing Jurkat NF-κB/GFP reporter cells stimulated with SEE-loaded Raji B cells to mimic the formation of the immunological synapse during T cell activation. IL-2 levels were quantified by ELISA. Data represent mean ± SD for three biological repeats, with P-value determined using a two-tailed, unpaired Student's t-test.CC BY-NC-ND · PubMed Central
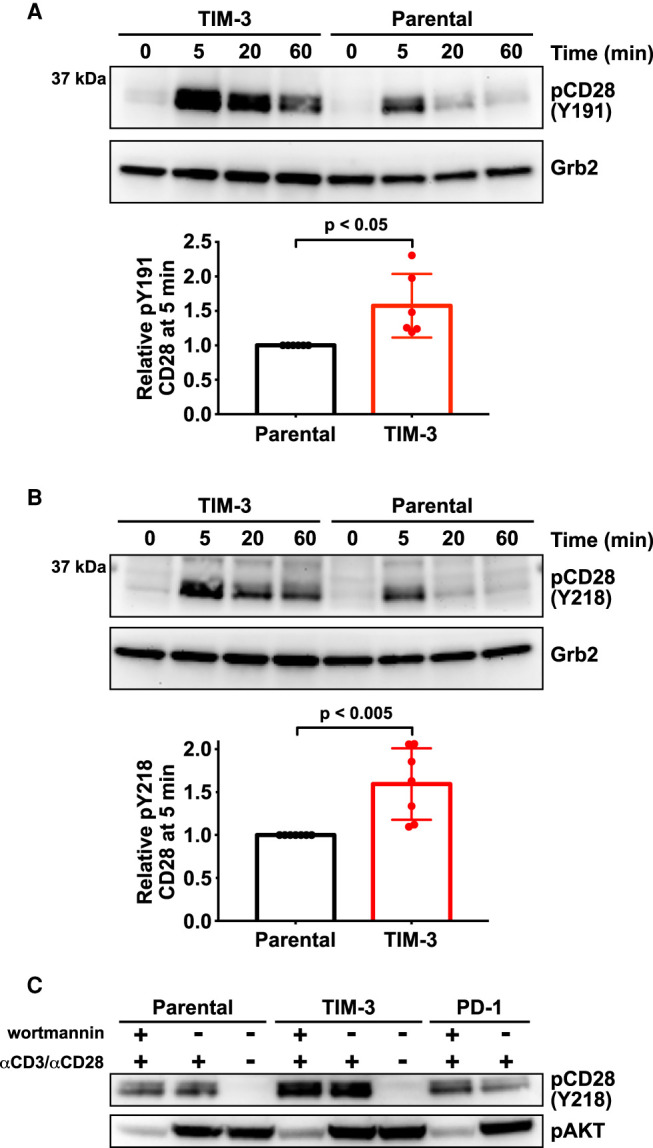
Figure 2. TIM-3 modulates CD28 phosphorylation after αCD3/αCD28 stimulation. Changes in CD28 phosphorylation following TCR activation with αCD3/αCD28 as in Figure 1 were monitored by Western blotting using phospho-specific antibodies. (A) Representative Western blot of pY191 in CD28 for TIM-3+ and parental NF-κB reporter Jurkat cells. Grb2 was used as a loading control as described [44]. Quantification bar graphs indicate mean band intensity ± SD (n = 6 biological repeats). Two-tailed, unpaired Student's t-test was used to determine P-values. (B) Representative Western blot of pY218 in CD28 for TIM-3+ and parental NF-κB reporter cells, with quantitation below the blot. Grb2 was used as a loading control. Bars indicate mean band intensity ± SD for the 5 min time point (seven biological repeats) with P-values determined by two-tailed, unpaired Student's t-test. (C) Parental, TIM-3+, and PD-1-expressing NF-κB reporter Jurkat cells were stimulated for 5 min with αCD3/αCD28 (1 μg/ml each) with- or without the PI3K inhibitor, wortmannin (0.2 μM) to show that PTEN deficiency does not account for the effect of TIM-3 expression on CD28 phosphorylation.
Figure 2. TIM-3 modulates CD28 phosphorylation after αCD3/αCD28 stimulation. Changes in CD28 phosphorylation following TCR activation with αCD3/αCD28 as in Figure 1 were monitored by Western blotting using phospho-specific antibodies. (A) Representative Western blot of pY191 in CD28 for TIM-3+ and parental NF-κB reporter Jurkat cells. Grb2 was used as a loading control as described [44]. Quantification bar graphs indicate mean band intensity ± SD (n = 6 biological repeats). Two-tailed, unpaired Student's t-test was used to determine P-values. (B) Representative Western blot of pY218 in CD28 for TIM-3+ and parental NF-κB reporter cells, with quantitation below the blot. Grb2 was used as a loading control. Bars indicate mean band intensity ± SD for the 5 min time point (seven biological repeats) with P-values determined by two-tailed, unpaired Student's t-test. (C) Parental, TIM-3+, and PD-1-expressing NF-κB reporter Jurkat cells were stimulated for 5 min with αCD3/αCD28 (1 μg/ml each) with- or without the PI3K inhibitor, wortmannin (0.2 μM) to show that PTEN deficiency does not account for the effect of TIM-3 expression on CD28 phosphorylation.CC BY-NC-ND · PubMed Central
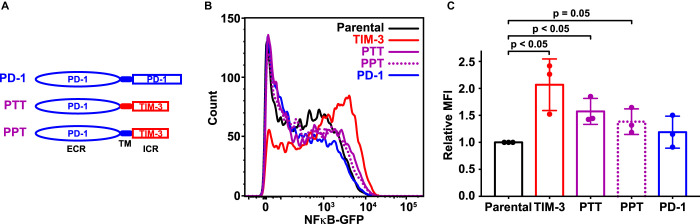
Figure 3. The TIM-3 extracellular region is required for co-stimulatory effects on T cell signaling. (A) Schematic representation of PD-1/TIM-3 chimeric constructs. PTT contains the PD-1 extracellular region (ECR) plus transmembrane (TM) and intracellular regions of TIM-3. In PPT, only the intracellular region is replaced with that from TIM-3. (B) A GFP reporter was used to measure NF-κB transcriptional activity downstream of TCR activation in parental NF-κB reporter Jurkat cells (black) and the same cells engineered to stably express TIM-3 (red curve), PTT (purple solid curve), PPT (purple dotted curve), or PD-1 (blue curve), stimulated with 1 μg/ml αCD3 plus 1 μg/ml αCD28. Representative histograms of NF-κB-driven GFP expression are shown. (C) Relative mean GFP fluorescence intensity (MFI) from three biological repeats of the experiment shown in (B) is plotted, expressed as fold change above that measured for parental NF-κB GFP reporter cells. Bars are color coded as in (B) and represent mean MFI value (± SD) — with P-values determined by two-tailed, unpaired Student's t-test.
Figure 3. The TIM-3 extracellular region is required for co-stimulatory effects on T cell signaling. (A) Schematic representation of PD-1/TIM-3 chimeric constructs. PTT contains the PD-1 extracellular region (ECR) plus transmembrane (TM) and intracellular regions of TIM-3. In PPT, only the intracellular region is replaced with that from TIM-3. (B) A GFP reporter was used to measure NF-κB transcriptional activity downstream of TCR activation in parental NF-κB reporter Jurkat cells (black) and the same cells engineered to stably express TIM-3 (red curve), PTT (purple solid curve), PPT (purple dotted curve), or PD-1 (blue curve), stimulated with 1 μg/ml αCD3 plus 1 μg/ml αCD28. Representative histograms of NF-κB-driven GFP expression are shown. (C) Relative mean GFP fluorescence intensity (MFI) from three biological repeats of the experiment shown in (B) is plotted, expressed as fold change above that measured for parental NF-κB GFP reporter cells. Bars are color coded as in (B) and represent mean MFI value (± SD) — with P-values determined by two-tailed, unpaired Student's t-test.CC BY-NC-ND · PubMed Central
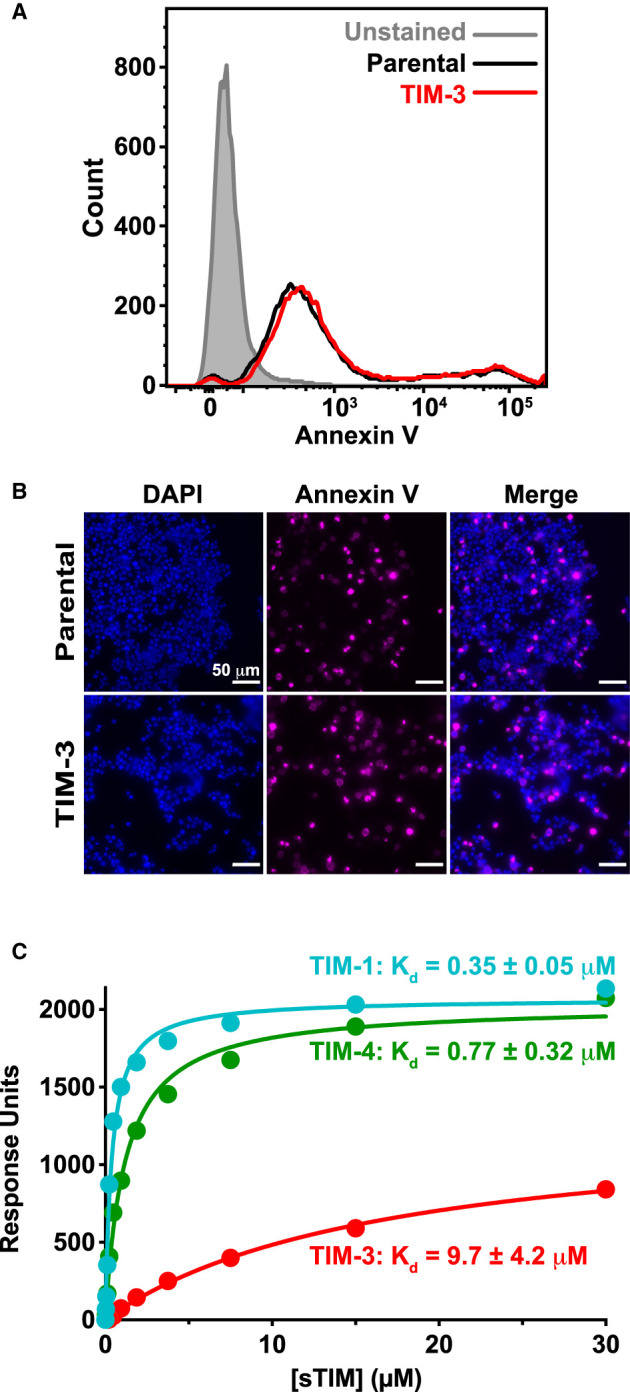
Figure 4. The TIM family ligand PS is present on Jurkat cells and binds TIM-3 with a ∼10 μM dissociation constant. (A) PS exposure on Jurkat cells in culture, detected by staining with fluorescently-tagged (PerCP-CyTM5.5) annexin V, and quantified by flow cytometry analysis of parental NF-κB GFP reporter cells (black) and those expressing TIM-3 (red) — compared with unstained cells (gray shaded). A representative histogram from five biological repeats is shown. (B) Fluorescence imaging of parental and TIM-3+ NF-κB GFP reporter cells stained with DAPI (left panels) and fluorescently-tagged (AlexaFluor 647) annexin V (middle panels). Cells were stained with annexin V prior to fixation and staining with DAPI. (C) PS binding of sTIM-1 (teal), sTIM-3 (red), and sTIM-4 (green) was analyzed using SPR by flowing purified TIM ECRs over 20% DOPS/80% DOPC lipid vesicles immobilized on an L1 sensorchip. Binding was measured in the presence of 1 mM CaCl2. The curves indicate the fit of the data in Prism 9 to a one-site specific binding equation. Binding curves are representative of at least five independent experiments. Mean Kd and SD values are listed in the figure (n = 6 for sTIM-1, n = 11 for sTIM-3, and n = 5 for sTIM-4). Binding to additional lipids and effects of calcium are shown in Supplementary Figure S7.
Figure 4. The TIM family ligand PS is present on Jurkat cells and binds TIM-3 with a ∼10 μM dissociation constant. (A) PS exposure on Jurkat cells in culture, detected by staining with fluorescently-tagged (PerCP-CyTM5.5) annexin V, and quantified by flow cytometry analysis of parental NF-κB GFP reporter cells (black) and those expressing TIM-3 (red) — compared with unstained cells (gray shaded). A representative histogram from five biological repeats is shown. (B) Fluorescence imaging of parental and TIM-3+ NF-κB GFP reporter cells stained with DAPI (left panels) and fluorescently-tagged (AlexaFluor 647) annexin V (middle panels). Cells were stained with annexin V prior to fixation and staining with DAPI. (C) PS binding of sTIM-1 (teal), sTIM-3 (red), and sTIM-4 (green) was analyzed using SPR by flowing purified TIM ECRs over 20% DOPS/80% DOPC lipid vesicles immobilized on an L1 sensorchip. Binding was measured in the presence of 1 mM CaCl2. The curves indicate the fit of the data in Prism 9 to a one-site specific binding equation. Binding curves are representative of at least five independent experiments. Mean Kd and SD values are listed in the figure (n = 6 for sTIM-1, n = 11 for sTIM-3, and n = 5 for sTIM-4). Binding to additional lipids and effects of calcium are shown in Supplementary Figure S7.CC BY-NC-ND · PubMed Central
Figure 5. Mutated TIM-3 variants with impaired PS-binding lose co-stimulatory signaling. (A) Details of the PS-binding site in murine TIM-3 (PDB: 3KAA — blue) overlaid on human TIM-3 (PDB: 6TXZ — red), revealing key interacting residues [34,82]. Inset at the right shows the PS-binding pocket, where short-chain PS is sandwiched by L99/M100 and W41 in mTIM-3 (I96/M97 and F40 in human TIM-3). A calcium ion (gray sphere) also sits in the binding pocket and interacts with the negatively charged PS headgroup. (B) PS binding of wild-type sTIM-3 (solid red curve), sTIM-3F40A (solid magenta curve), and sTIM-3I96A/M97A (dotted magenta curve) were analyzed using SPR by flowing the purified sTIM-3 variants over 20% DOPS/80% DOPC lipid vesicles immobilized on an L1 chip (in the presence of 1 mM CaCl2). Binding curves are representative of at least three independent experiments. Kd values for sTIM-3F40A and sTIM-3I96A/M97A were too high to measure, both appearing to exceed ∼200 μM (although PS binding was detectable). (C) A GFP reporter was used to measure NF-κB transcriptional activity downstream of TCR activation with 1 μg/ml αCD3 plus 0.5 μg/ml αCD28 for 16 h. Representative histogram of NF-κB-driven GFP expression is shown for parental NF-κB GFP reporter cells (black), and those expressing TIM-3WT (solid red curve), TIM-3F40A (solid magenta curve), and TIM-3I96A/M97A (dotted magenta curve) variants. (D) Relative mean GFP fluorescence intensity (MFI), expressed as fold change over parental cells within each experiment, was determined across eight biological replicates for parental NF-κB GFP reporter cells (black) or those expressing TIM-3WT (solid red line, open bar), TIM-3F40A (solid magenta line, open bar and data points), or TIM-3I96A/M97A (dotted magenta line, gray filled bar and data points). Means ± SD are plotted, with P-values determined by two-tailed, unpaired Student's t-tests. (E) ELISA analysis of IL-2 secreted into the cell culture medium by parental NF-κB GFP reporter cells, and those expressing, TIM-3WT (solid red line, open bar), TIM-3F40A (solid magenta line, open bar and data points), or TIM-3I96A/M97A (dotted magenta line, gray filled bar and data points) following stimulation by αCD3/αCD28, as described in (C). Means ± SD are plotted for three biological repeats. P-values comparing TIM-3WT with the mutated TIM-3 variants were determined using two-tailed, unpaired Student's t-tests. (F) Analysis of TNFα secretion into the cell culture medium was performed using a Luminex assay. Cells were stimulated with αCD3/αCD28 (1 μg/ml each) for 16 h. Mean values ± SD are plotted for parental (black line, open bar), TIM-3WT (solid red line, open bar), TIM-3F40A (solid magenta line, open bar and points), and TIM-3I96A/M97A (dotted magenta line, gray filled bar and data points). Two-tailed, unpaired Student's t-tests were used to compare TIM-3WT with mutated TIM-3 variants for three biological repeats. (G) SEE-loaded Raji B cells were used to stimulate NF-κB GFP reporter Jurkat cells to recapitulate the formation of an immunological synapse. IL-2 production following Raji B cell stimulation was determined by ELISA analysis for parental NF-κB GFP reporter cells (solid black line, open bar) and cells expressing TIM-3WT (solid red line, open bar), TIM-3F40A (solid magenta line, open bar and data points), or TIM-3I96A/M97A (dotted magenta line, gray filled bar and data points). Mean ± SD are plotted for three biological repeats, with P-values comparing TIM-3WT with the mutated TIM-3 variants determined using two-tailed, unpaired Student's t-tests.
Figure 5. Mutated TIM-3 variants with impaired PS-binding lose co-stimulatory signaling. (A) Details of the PS-binding site in murine TIM-3 (PDB: 3KAA — blue) overlaid on human TIM-3 (PDB: 6TXZ — red), revealing key interacting residues [34,82]. Inset at the right shows the PS-binding pocket, where short-chain PS is sandwiched by L99/M100 and W41 in mTIM-3 (I96/M97 and F40 in human TIM-3). A calcium ion (gray sphere) also sits in the binding pocket and interacts with the negatively charged PS headgroup. (B) PS binding of wild-type sTIM-3 (solid red curve), sTIM-3F40A (solid magenta curve), and sTIM-3I96A/M97A (dotted magenta curve) were analyzed using SPR by flowing the purified sTIM-3 variants over 20% DOPS/80% DOPC lipid vesicles immobilized on an L1 chip (in the presence of 1 mM CaCl2). Binding curves are representative of at least three independent experiments. Kd values for sTIM-3F40A and sTIM-3I96A/M97A were too high to measure, both appearing to exceed ∼200 μM (although PS binding was detectable). (C) A GFP reporter was used to measure NF-κB transcriptional activity downstream of TCR activation with 1 μg/ml αCD3 plus 0.5 μg/ml αCD28 for 16 h. Representative histogram of NF-κB-driven GFP expression is shown for parental NF-κB GFP reporter cells (black), and those expressing TIM-3WT (solid red curve), TIM-3F40A (solid magenta curve), and TIM-3I96A/M97A (dotted magenta curve) variants. (D) Relative mean GFP fluorescence intensity (MFI), expressed as fold change over parental cells within each experiment, was determined across eight biological replicates for parental NF-κB GFP reporter cells (black) or those expressing TIM-3WT (solid red line, open bar), TIM-3F40A (solid magenta line, open bar and data points), or TIM-3I96A/M97A (dotted magenta line, gray filled bar and data points). Means ± SD are plotted, with P-values determined by two-tailed, unpaired Student's t-tests. (E) ELISA analysis of IL-2 secreted into the cell culture medium by parental NF-κB GFP reporter cells, and those expressing, TIM-3WT (solid red line, open bar), TIM-3F40A (solid magenta line, open bar and data points), or TIM-3I96A/M97A (dotted magenta line, gray filled bar and data points) following stimulation by αCD3/αCD28, as described in (C). Means ± SD are plotted for three biological repeats. P-values comparing TIM-3WT with the mutated TIM-3 variants were determined using two-tailed, unpaired Student's t-tests. (F) Analysis of TNFα secretion into the cell culture medium was performed using a Luminex assay. Cells were stimulated with αCD3/αCD28 (1 μg/ml each) for 16 h. Mean values ± SD are plotted for parental (black line, open bar), TIM-3WT (solid red line, open bar), TIM-3F40A (solid magenta line, open bar and points), and TIM-3I96A/M97A (dotted magenta line, gray filled bar and data points). Two-tailed, unpaired Student's t-tests were used to compare TIM-3WT with mutated TIM-3 variants for three biological repeats. (G) SEE-loaded Raji B cells were used to stimulate NF-κB GFP reporter Jurkat cells to recapitulate the formation of an immunological synapse. IL-2 production following Raji B cell stimulation was determined by ELISA analysis for parental NF-κB GFP reporter cells (solid black line, open bar) and cells expressing TIM-3WT (solid red line, open bar), TIM-3F40A (solid magenta line, open bar and data points), or TIM-3I96A/M97A (dotted magenta line, gray filled bar and data points). Mean ± SD are plotted for three biological repeats, with P-values comparing TIM-3WT with the mutated TIM-3 variants determined using two-tailed, unpaired Student's t-tests.CC BY-NC-ND · PubMed Central
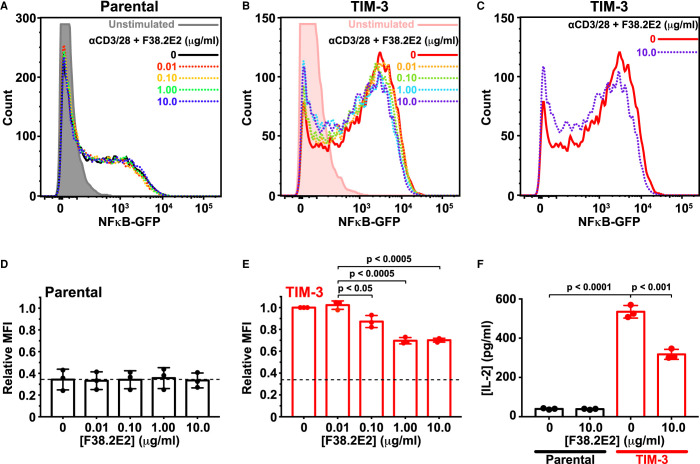
Figure 6. TIM-3 antibody treatment selectively reduces co-stimulatory signaling. (A) Representative histograms of NF-κB-driven GFP expression in parental NF-κB GFP reporter Jurkat cells. Cells were starved for 4 h — including a 1 h pre-treatment with anti TIM-3 (F38.2E2) at the concentrations marked — and were then stimulated with 1 μg/ml αCD3 plus 0.5 μg/ml αCD28 for 16 h or left unstimulated (gray). GFP expression was analyzed by flow cytometry, and quantitation is shown in (D). (B) Representative histograms for TIM-3-expressing NF-κB GFP reporter Jurkat cells, stimulated as in (A), with from 0 μg/ml to 10 μg/ml F38.2E2. Unstimulated TIM-3+ cells are shown in pink. Quantitation is shown in (E). (C) Representative histograms from TIM-3-expressing NF-κB GFP reporter Jurkat cells stimulated with 0 μg/ml (red) or 10 μg/ml F38.2E2 (blue), showing that 10 μg/ml F38.2E2 does reduce the level of NF-κB-driven GFP expression seen in stimulated TIM-3 cells. (D,E) Quantitation of data in (A) and (C) over three independent biological repeats, plotting mean values for relative mean GFP fluorescence intensity (MFI) and SD. P-values were determined with two-tailed, unpaired Student's t-tests. (F) IL-2 secreted into cell medium was measured by ELISA for parental NF-κB GFP reporter Jurkat cells (black bars) and TIM-3-expressing cells (red bars). Adding 10 μg/ml F38.2E2 reduces enhanced IL-2 production in TIM-3 expressing cells. Bars represent the mean concentration of IL-2 (± SD) for three biological replicates. P-values were determined with two-tailed, unpaired Student's t-tests.
Figure 6. TIM-3 antibody treatment selectively reduces co-stimulatory signaling. (A) Representative histograms of NF-κB-driven GFP expression in parental NF-κB GFP reporter Jurkat cells. Cells were starved for 4 h — including a 1 h pre-treatment with anti TIM-3 (F38.2E2) at the concentrations marked — and were then stimulated with 1 μg/ml αCD3 plus 0.5 μg/ml αCD28 for 16 h or left unstimulated (gray). GFP expression was analyzed by flow cytometry, and quantitation is shown in (D). (B) Representative histograms for TIM-3-expressing NF-κB GFP reporter Jurkat cells, stimulated as in (A), with from 0 μg/ml to 10 μg/ml F38.2E2. Unstimulated TIM-3+ cells are shown in pink. Quantitation is shown in (E). (C) Representative histograms from TIM-3-expressing NF-κB GFP reporter Jurkat cells stimulated with 0 μg/ml (red) or 10 μg/ml F38.2E2 (blue), showing that 10 μg/ml F38.2E2 does reduce the level of NF-κB-driven GFP expression seen in stimulated TIM-3 cells. (D,E) Quantitation of data in (A) and (C) over three independent biological repeats, plotting mean values for relative mean GFP fluorescence intensity (MFI) and SD. P-values were determined with two-tailed, unpaired Student's t-tests. (F) IL-2 secreted into cell medium was measured by ELISA for parental NF-κB GFP reporter Jurkat cells (black bars) and TIM-3-expressing cells (red bars). Adding 10 μg/ml F38.2E2 reduces enhanced IL-2 production in TIM-3 expressing cells. Bars represent the mean concentration of IL-2 (± SD) for three biological replicates. P-values were determined with two-tailed, unpaired Student's t-tests.CC BY-NC-ND · PubMed Central

Verification

Claims the paper makes

The claims and statistics of this paper haven’t been checked yet.

Free: it reads the open-access text and checks the first 5 claims that cite a source we can check. Create a free account to check every claim.

A few free checks a day · papers already verified open instantly · results are public

Claims other papers make about this one

Each is checked against this paper’s own text: does it say what the citing paper says it does?

Self-check

Percentages, sums and reported differences re-computed from the paper’s own numbers.

The self-check needs the paper’s full text.

Citations

Cites

Show all 88 references

Cited by

See all 61

Metadata

Authors
Smith, C. M., Li, A., Krishnamurthy, N., & Lemmon, M. A.
Affiliations
Yale University (US)
Corresponding author
  • Smith, Courtney M.
  • Lemmon, Mark A.
Venue
Biochemical Journal
Published
2021-09-14
Volume
478
Issue
17
Pages
3331-3349
ISSN
  • 0264-6021 (ISSN-L)
  • 1470-8728
OpenAlex
W3193547547
Cited by
61
References
87
Citations by year
2026: 15 · 2025: 19 · 2024: 9 · 2023: 10 · 2022: 6 · 2021: 2
FWCI
2.51
Type
journal article
Language
en
Open access
Locations
  • Biochemical Journal (publishedVersion, cc-by-nc-nd)
  • Europe PMC (PubMed Central) (publishedVersion, other-oa)
  • PubMed Central (publishedVersion, cc-by-nc-nd)
  • PubMed (publishedVersion)
Funders
National Institute of General Medical Sciences (R35GM122485)
Topics
  • Life Sciences › Immunology and Microbiology › Immunology › T-cell and B-cell Immunology
  • Health Sciences › Medicine › Oncology › Cancer Immunotherapy and Biomarkers
  • Life Sciences › Immunology and Microbiology › Immunology › Phagocytosis and Immune Regulation
Keywords
TIM-3, phosphatidylserine, NF-κB signaling, IL-2 secretion, T cell receptor signaling, immunotherapy targets, Jurkat cells
MeSH terms
Hepatitis A Virus Cellular Receptor 2, Antibodies, Binding Sites, Humans, Interleukin-2, Ligands, Macrophages, Phosphatidylserines, Phosphorylation, Receptors, Antigen, T-Cell, T-Lymphocytes, Transfection, Signal Transduction, NF-kappa B, Apoptosis, CD28 Antigens, Jurkat Cells, HEK293 Cells

About these checks

Registry, retraction, Cites and statistics results are computed, not judged, with one exception: a printed reference that no index lists is read once by a model before it counts as a citation error. Claims are extracted by a model and kept only when their quote appears verbatim in the text; each cited source is then checked, with a model’s help, for whether it says what the claim relies on. Those verdicts can be wrong — read the claim’s quote and the cited source before relying on one.

Statistics and arithmetic are recomputed, not judged.

Confidence bands are shown only for fields calibrated on our annotated test set. None is calibrated yet, so no band is shown.

What counts as a claim ›How we measure confidence ›How we check this ›

Are you an author, or do you see a problem with this page? Request a review

Data sources

Bibliographic data: Semantic Scholar, OpenAlex, Crossref.

Contains information from the Semantic Scholar Academic Graph Datasets, made available under the ODC Attribution License (ODC-BY 1.0).

Semantic Scholar’s data is described in: Kinney, R., et al. (2023). The Semantic Scholar Open Data Platform. arXiv:2301.10140.