

The DOI matches its Crossref record; 37 of the 37 references it cites were found in a registry or an index.
New neural activity patterns emerge with long-term learning
Open accessAbstract
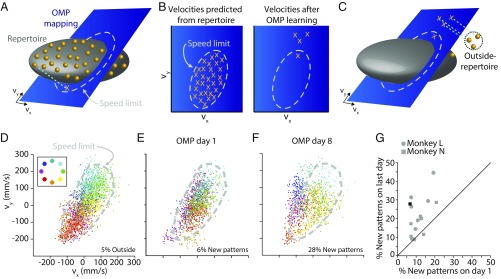
Significance: Consider a skill you would like to learn, like playing the piano. How do you progress from “Chopsticks” to Chopin? As you learn to do something new with your hands, does the brain also do something new? We found that monkeys learned new skilled behavior by generating new neural activity patterns. We used a brain–computer interface (BCI), which directly links neural activity to movement of a computer cursor, to encourage animals to generate new neural activity patterns. Over several days, the animals began to exhibit new patterns of neural activity that enabled them to control the BCI cursor. This suggests that learning to play the piano and other skills might also involve the generation of new neural activity patterns.
Overview
The claims and statistics of this paper haven’t been checked yet.
Run the check — free, no account needed. It reads the open-access text and checks the sources it cites.
Integrity signals
Registry
Cites
Statistics
Figures



Verification
Claims the paper makes
The claims and statistics of this paper haven’t been checked yet.
Run the check — free, no account needed. It reads the open-access text and checks the sources it cites.
Claims other papers make about this one
Each is checked against this paper’s own text: does it say what the citing paper says it does?
The source backs part of the claim, not all of it — or backs it for a different population, condition or comparison.
In the citing paper
“Finally, speech decoders have yet to fully leverage paradigms of feedback-based learning that have the potential to entrain new patterns of neural activity for better control171–174.”
From The speech neuroprosthesis (2024) · cites this paper as [172]
Experimental — accuracy not yet measured
Self-check
Percentages, sums and reported differences re-computed from the paper’s own numbers.
The self-check needs the paper’s full text.
Citations
Cites
Bliss, T. V. P., & Gardner‐Medwin, A. R. (1973) · The Journal of Physiology · doi:10.1113/jphysiol.1973.sp010274 · Cited by 7,437
Bi, G.-Q., & Poo, M.-M. (1998) · The Journal of Neuroscience · doi:10.1523/jneurosci.18-24-10464.1998 · Cited by 4,744 · cited 1×
“O understanding of learning is grounded in the concepts of synaptic plasticity (1, 2) and cortical map plasticity (3, 4).”
BackgroundError Correction, Sensory Prediction, and Adaptation in Motor Control
Shadmehr, R., Smith, M. A., & Krakauer, J. W. (2010) · Annual Review of Neuroscience · doi:10.1146/annurev-neuro-060909-153135 · Cited by 1,869 · cited 1×
“In particular, our results combined with earlier BCI studies (6–9, 15, 16, 18, 22–26) and motor learning studies (27, 28) suggest that fast and slow learning are driven by different neural mechanisms.”
ResultBrain Structures Differ between Musicians and Non-Musicians
Gaser, C., & Schlaug, G. (2003) · The Journal of Neuroscience · doi:10.1523/jneurosci.23-27-09240.2003 · Cited by 1,633 · cited 1×
“O understanding of learning is grounded in the concepts of synaptic plasticity (1, 2) and cortical map plasticity (3, 4).”
BackgroundNudo, R., Milliken, G., Jenkins, W., & Merzenich, M. (1996) · The Journal of Neuroscience · doi:10.1523/jneurosci.16-02-00785.1996 · Cited by 1,413
Neural constraints on learning
Sadtler, P. T., Quick, K. M., Golub, M. D., Chase, S. M., Ryu, S. I., Tyler-Kabara, E. C., Yu, B. M., & Batista, A. P. (2014) · Nature · doi:10.1038/nature13665 · Cited by 713 · cited 5×
“Previously, we have shown that the structure of neural population activity limits the learning that can occur within a single day (8).”
BackgroundResultInfluentialSelf-citationKrakauer, J. W., Hadjiosif, A. M., Xu, J., Wong, A. L., & Haith, A. M. (2019) · Comprehensive Physiology · doi:10.1002/cphy.c170043 · Cited by 635
Kleim, J. A., Hogg, T. M., VandenBerg, P. M., Cooper, N. R., Bruneau, R., & Remple, M. (2004) · The Journal of Neuroscience · doi:10.1523/jneurosci.3440-03.2004 · Cited by 595 · cited 1×
“The time course of learning that we observed is consistent with findings that cortical synaptogenesis and motor map reorganization occur during late phases of skill learning (20).”
ResultSpontaneous Events Outline the Realm of Possible Sensory Responses in Neocortical Populations
Luczak, A., Barthó, P., & Harris, K. D. (2009) · Neuron · doi:10.1016/j.neuron.2009.03.014 · Cited by 593
Emergence of a stable cortical map for neuroprosthetic control
Ganguly, K., & Carmena, J. M. (2009) · PLoS Biology · doi:10.1371/journal.pbio.1000153 · Cited by 578 · cited 1×
“Learning has been associated with changes in tuning properties of individual neurons in previous BCI (6, 7) and motor skill learning (21) studies.”
Background
Cited by
Computation Through Neural Population Dynamics
Vyas, S., Golub, M. D., Sussillo, D., & Shenoy, K. V. (2020) · Annual Review of Neuroscience · doi:10.1146/annurev-neuro-092619-094115 · Cited by 671
“A fast-timescale mechanism reassociates existing neural states with new intended behaviors (Golub et al. 2018), and slowertimescale mechanisms drive out-of-repertoire and outside-manifold changes to the neural population dynamics (Oby et al. 2019).”
BackgroundMethodInfluentialSelf-citationLong-term stability of cortical population dynamics underlying consistent behavior
Gallego, J. A., Perich, M. G., Chowdhury, R. H., Solla, S. A., & Miller, L. E. (2020) · Nature Neuroscience · doi:10.1038/s41593-019-0555-4 · Cited by 405
“Recent work has established that the collective dynamics of neural populations are strongly influenced by network connectivity 33–35 , and that long-term learning is needed to alter or extend the manifold 3,22,36 .”
The population doctrine in cognitive neuroscience
Ebitz, R. B., & Hayden, B. Y. (2021) · Neuron · doi:10.1016/j.neuron.2021.07.011 · Cited by 249
Flexible multitask computation in recurrent networks utilizes shared dynamical motifs
Driscoll, L., Shenoy, K., & Sussillo, D. (2022) · doi:10.1101/2022.08.15.503870 · Cited by 217
“We hypothesize that this two-stage process of slow and fast learning could provide some intuition for off-and on-manifold brain-machine interface learning results in nonhuman primates 33–35 .”
BackgroundFlexible multitask computation in recurrent networks utilizes shared dynamical motifs
Driscoll, L. N., Shenoy, K., & Sussillo, D. (2024) · Nature Neuroscience · doi:10.1038/s41593-024-01668-6 · Cited by 214
“We hypothesize that this two-stage process of slow and fast learning could provide some intuition for off-manifold and on-manifold brain–machine interface learning results in non-human primates 36–38 .”
Metadata
- Authors
- Oby, E. R., Golub, M. D., Hennig, J. A., Degenhart, A. D., Tyler-Kabara, E. C., Yu, B. M., Chase, S. M., & Batista, A. P.
- Affiliations
- University of Pittsburgh (US)
- Department of Bioengineering, University of Pittsburgh, Pittsburgh, PA 15213;
- Corresponding author
- Batista, Aaron P.
- ORCID
- Venue
- Proceedings of the National Academy of Sciences
- Publisher
- National Academy of Sciences
- Published
- 2019-06-10
- Volume
- 116
- Issue
- 30
- Pages
- 15210-15215
- ISSN
- 0027-8424 (ISSN-L)
- 1091-6490
- PMC
- PMC6660765
- OpenAlex
- W2949908411
- Semantic Scholar
- 3044bcd133c9cfa8d2512bebf14654b3faf40588
- Cited by
- 221
- References
- 36
- Citations by year
- 2026: 26 · 2025: 30 · 2024: 42 · 2023: 25 · 2022: 39 · 2021: 26 · 2020: 23 · 2019: 8
- FWCI
- 13.86
- Type
- journal article
- Language
- en
- Open access
- hybrid
- doi.org
- Licence
- Locations
- Proceedings of the National Academy of Sciences (publishedVersion, cc-by-nc-nd)
- Europe PMC (PubMed Central) (publishedVersion, cc-by-nc-nd)
- PubMed Central (publishedVersion, cc-by-nc-nd)
- PubMed (publishedVersion)
- Funders
- National Science Foundation (1533672, 1553252, CAREER)
- Burroughs Wellcome Fund
- Pennsylvania Department of Health
- Craig H. Neilsen Foundation (280028)
- National Institutes of Health (NIH T32, NIH-R01)
- National Institute of Neurological Disorders and Stroke (R01NS105318, T32NS007391, R01NS129584, T32NS086749)
- Eunice Kennedy Shriver National Institute of Child Health and Human Development (R01HD090125, R01HD071686)
- Topics
- Life Sciences › Neuroscience › Cognitive Neuroscience › Motor Control and Adaptation
- Life Sciences › Neuroscience › Cognitive Neuroscience › Memory and Neural Mechanisms
- Life Sciences › Neuroscience › Cognitive Neuroscience › Neural dynamics and brain function
- Keywords
- neural activity patterns, long-term learning, brain-computer interface, neuroplasticity, motor skill learning, monkeys, neural decoding, cursor control
- MeSH terms
- Animals, Haplorhini, Learning, Motor Cortex, Motor Skills, Nerve Net, Neurons, Memory, Long-Term, Brain-Computer Interfaces
About these checks
Registry, retraction, Cites and statistics results are computed, not judged, with one exception: a printed reference that no index lists is read once by a model before it counts as a citation error. Claims are extracted by a model and kept only when their quote appears verbatim in the text; each cited source is then checked, with a model’s help, for whether it says what the claim relies on. Those verdicts can be wrong — read the claim’s quote and the cited source before relying on one.
Statistics and arithmetic are recomputed, not judged.
Confidence bands are shown only for fields calibrated on our annotated test set. None is calibrated yet, so no band is shown.
What counts as a claim ›How we measure confidence ›How we check this ›
Are you an author, or do you see a problem with this page? Request a review
How to cite
Cite CoChat for the checks on this page, and the paper for its own findings.
- This page
- CoChat. (2026). Citation check: New neural activity patterns emerge with long-term learning. https://app.cochat.ai/papers/10.1073/pnas.1820296116
- The paper
- Oby, E. R., Golub, M. D., Hennig, J. A., Degenhart, A. D., Tyler-Kabara, E. C., Yu, B. M., Chase, S. M., & Batista, A. P. (2019). New neural activity patterns emerge with long-term learning. Proceedings of the National Academy of Sciences. https://doi.org/10.1073/pnas.1820296116
Data sources
Bibliographic data: Semantic Scholar, OpenAlex, Crossref.
Contains information from the Semantic Scholar Academic Graph Datasets, made available under the ODC Attribution License (ODC-BY 1.0).
Semantic Scholar’s data is described in: Kinney, R., et al. (2023). The Semantic Scholar Open Data Platform. arXiv:2301.10140.
