

The DOI matches its Crossref record; 51 of the 51 references it cites were found in a registry or an index.
Drugging an undruggable pocket on KRAS
Open accessAbstract
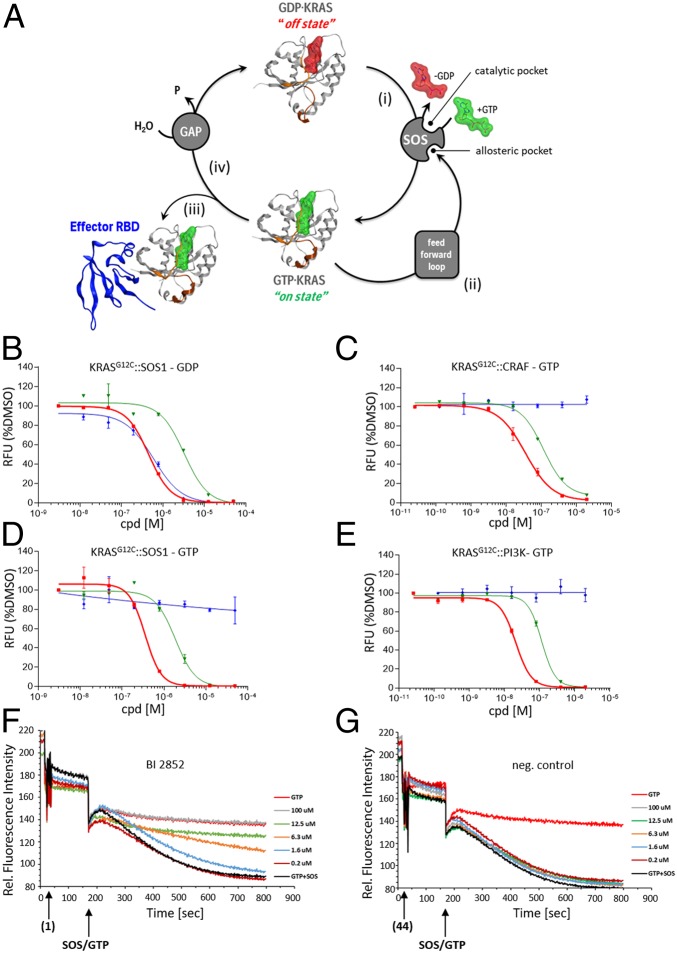
The 3 human RAS genes, KRAS, NRAS, and HRAS, encode 4 different RAS proteins which belong to the protein family of small GTPases that function as binary molecular switches involved in cell signaling. Activating mutations in RAS are among the most common oncogenic drivers in human cancers, with KRAS being the most frequently mutated oncogene. Although KRAS is an excellent drug discovery target for many cancers, and despite decades of research, no therapeutic agent directly targeting RAS has been clinically approved. Using structure-based drug design, we have discovered BI-2852 (1), a KRAS inhibitor that binds with nanomolar affinity to a pocket, thus far perceived to be “undruggable,” between switch I and II on RAS; 1 is mechanistically distinct from covalent KRAS G12C inhibitors because it binds to a different pocket present in both the active and inactive forms of KRAS. In doing so, it blocks all GEF, GAP, and effector interactions with KRAS, leading to inhibition of downstream signaling and an antiproliferative effect in the low micromolar range in KRAS mutant cells. These findings clearly demonstrate that this so-called switch I/II pocket is indeed druggable and provide the scientific community with a chemical probe that simultaneously targets the active and inactive forms of KRAS.
Overview
The claims and statistics of this paper haven’t been checked yet.
Run the check — free, no account needed. It reads the open-access text and checks the sources it cites.
Integrity signals
Registry
Cites
Statistics
Figures
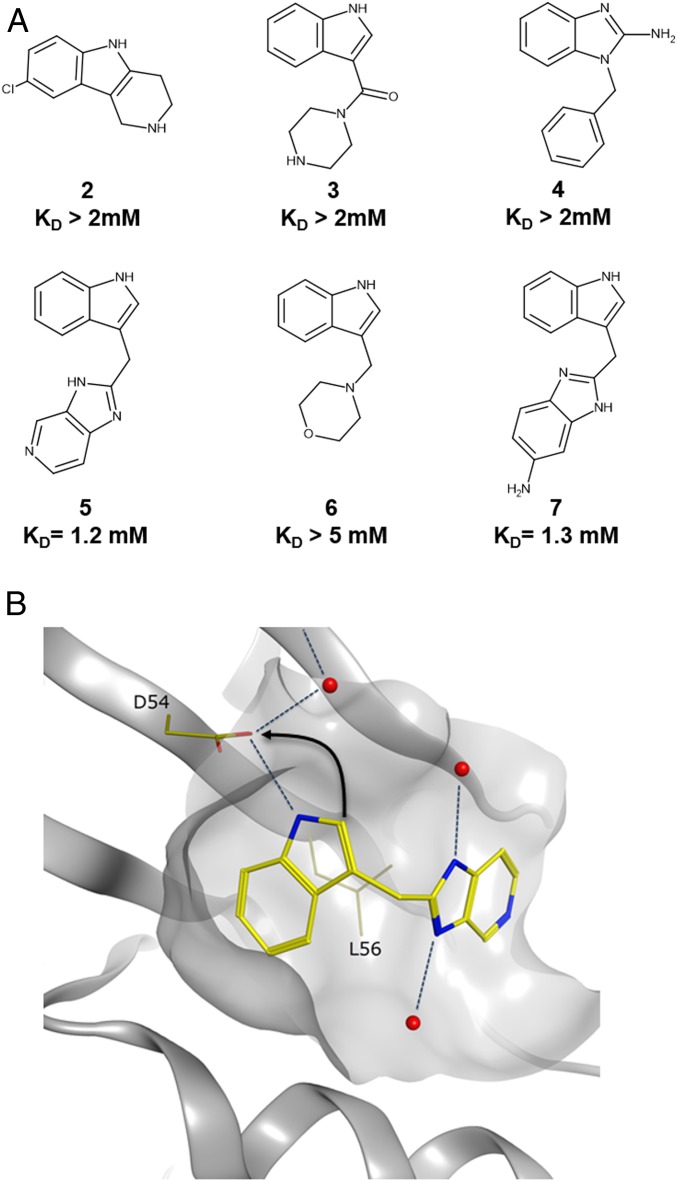
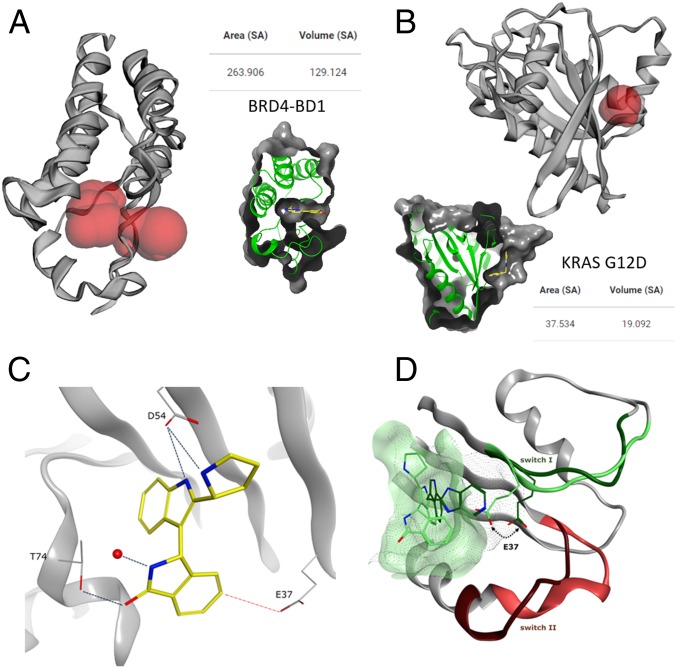
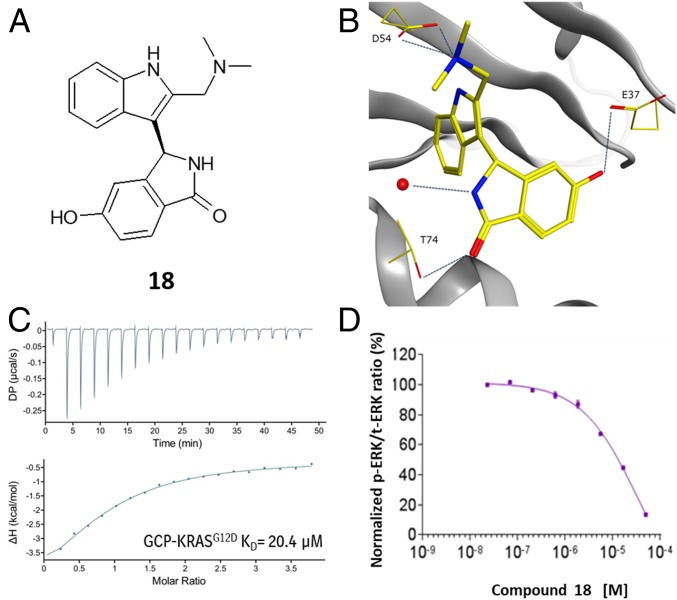
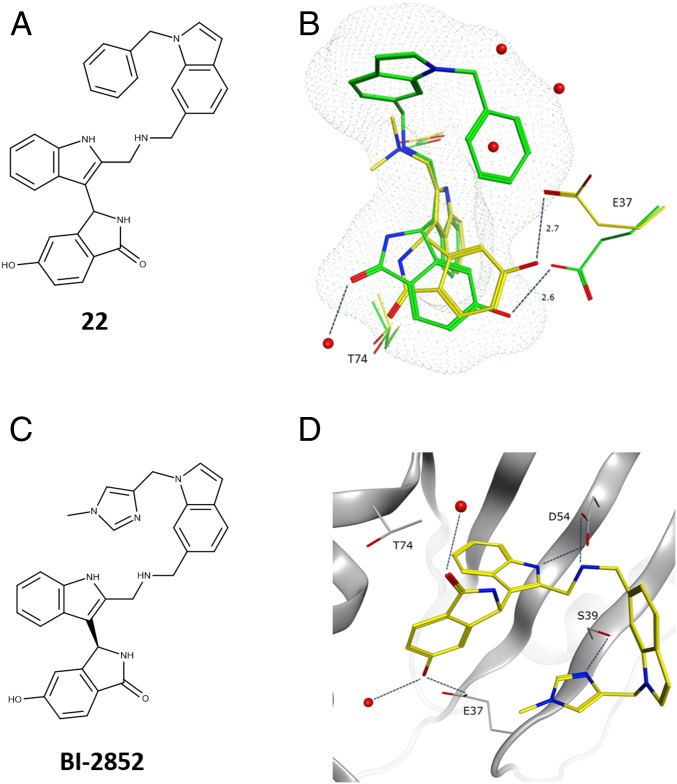
Verification
Claims the paper makes
The claims and statistics of this paper haven’t been checked yet.
Run the check — free, no account needed. It reads the open-access text and checks the sources it cites.
Claims other papers make about this one
Each is checked against this paper’s own text: does it say what the citing paper says it does?
The source backs part of the claim, not all of it — or backs it for a different population, condition or comparison.
In the citing paper
“Other inhibitors, including RMC-9805, 6 TH-Z835, 7 and BI2852, 8 have also been identified.”
From Anti-tumor efficacy of HRS-4642 and its potential combination with proteasome inhibition in KRAS G12D-mutant cancer (2024) · cites this paper as [8]
Experimental — accuracy not yet measuredIn the citing paper
“This approach offers the advantage, shared by MRTX1133, of targeting both the GTP-bound and GDP-bound states of KRAS178,179.”
From The current state of the art and future trends in RAS-targeted cancer therapies (2022) · cites this paper as [178]
In the citing paper
“This pocket was initially described by Kessler et al.178,179 during the development of BI-2852, a small molecule that induces nonfunctional dimerization of KRAS.”
From The current state of the art and future trends in RAS-targeted cancer therapies (2022) · cites this paper as [178]
In the citing paper
“However, an alternative and unique approach of targeting a switch 1/2 pocket is currently being evaluated.”
From The current state of the art and future trends in RAS-targeted cancer therapies (2022) · cites this paper as [178]
In the citing paper
“This non-covalent inhibitor preferentially binds to and with high affinity to the inactive state of KRAS while preserving NRAS and HRAS HRAS [52]. It blocks nucleotide exchange to prevent the activation of wild-type KRAS as well as a wide range of KRAS mutations, including G12A/C/D/F/V/S, G13C/D, V14I, L19F, Q22K, D33E, Q61H, K117N, and A146V/T.”
From KRAS, a New Target for Precision Medicine in Colorectal Cancer? (2024) · cites this paper as [51]
In the citing paper
“Currently, Food and Drug Administration (FDA) has approved an allele-specific covalent inhibitor of KRAS (G12C), AMG510 (sotorasib) having marked clinical responses across multiple tumor types [21–24].”
From Targeting KRAS mutant cancers: from druggable therapy to drug resistance (2022) · cites this paper as [24]
Self-check
Percentages, sums and reported differences re-computed from the paper’s own numbers.
The self-check needs the paper’s full text.
Citations
Cites
Comprehensive molecular profiling of lung adenocarcinoma
The Cancer Genome Atlas Research Network (2014) · Nature · doi:10.1038/nature13385 · Cited by 5,732
CASTp 3.0: computed atlas of surface topography of proteins
Tian, W., Chen, C., Lei, X., Zhao, J., & Liang, J. (2018) · Nucleic Acids Research · doi:10.1093/nar/gky473 · Cited by 2,389
A Comprehensive Survey of Ras Mutations in Cancer
Prior, I. A., Lewis, P. D., & Mattos, C. (2012) · Cancer Research · doi:10.1158/0008-5472.can-11-2612 · Cited by 2,063 · cited 1×
“The most common mutations occur as single-point mutations at codons 12, 13, and 61 (13).”
Pancreatic cancer genomes reveal aberrations in axon guidance pathway genes
Initiative, A. P. C. G., Biankin, A. V., Waddell, N., Kassahn, K. S., Gingras, M.-C., Muthuswamy, L. B., Johns, A. L., Miller, D. K., Wilson, P. J., Patch, A.-M., et al. (2012) · Nature · doi:10.1038/nature11547 · Cited by 2,058
Discovering High-Affinity Ligands for Proteins: SAR by NMR
Shuker, S. B., Hajduk, P. J., Meadows, R. P., & Fesik, S. W. (1996) · Science · doi:10.1126/science.274.5292.1531 · Cited by 2,045
Self-citationThe Guanine Nucleotide-Binding Switch in Three Dimensions
Vetter, I. R., & Wittinghofer, A. (2001) · Science · doi:10.1126/science.1062023 · Cited by 1,875
CASTp: Computed Atlas of Surface Topography of proteins
Binkowski, T. A. (2003) · Nucleic Acids Research · doi:10.1093/nar/gkg512 · Cited by 1,693
The Ras-RasGAP Complex: Structural Basis for GTPase Activation and Its Loss in Oncogenic Ras Mutants
Scheffzek, K., Ahmadian, M. R., Kabsch, W., Wiesmüller, L., Lautwein, A., Schmitz, F., & Wittinghofer, A. (1997) · Science · doi:10.1126/science.277.5324.333 · Cited by 1,543
Mayer, M., & Meyer, B. (2001) · Journal of the American Chemical Society · doi:10.1021/ja0100120 · Cited by 1,201
Self-citationTargeting KRAS mutant cancers with a covalent G12C-specific inhibitor
Janes, M. R., Zhang, J., Li, L.-S., Hansen, R., Peters, U., Guo, X., Chen, Y., Babbar, A., Firdaus, S. J., Darjania, L., et al. (2018) · Cell · doi:10.1016/j.cell.2018.01.006 · Cited by 1,172 · cited 13×
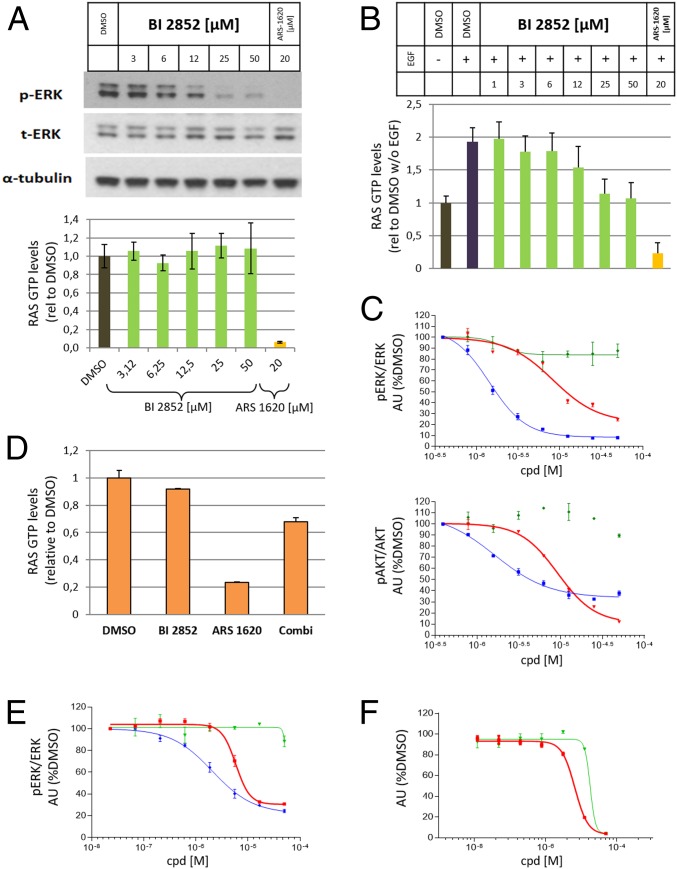
“NCI-H358 cells cultured under high growth factor conditions were treated with increasing concentrations of 1 and ARS-1620 for 2 h.”
Influential
Cited by
Sorted by citations
KRAS Mutation: From Undruggable to Druggable in Cancer
Huang, L., Guo, Z., Wang, F., & Fu, L. (2021) · Signal Transduction and Targeted Therapy · doi:10.1038/s41392-021-00780-4 · Cited by 1,127
RAS-targeted therapies: is the undruggable drugged?
Moore, A. R., Rosenberg, S. C., McCormick, F., & Malek, S. (2020) · Nature Reviews Drug Discovery · doi:10.1038/s41573-020-0068-6 · Cited by 1,103
Overcoming Endocrine Resistance in Breast Cancer
Hanker, A. B., Sudhan, D. R., & Arteaga, C. L. (2020) · Cancer Cell · doi:10.1016/j.ccell.2020.03.009 · Cited by 927
Wang, Y., Zhang, S., Li, F., Zhou, Y., Zhang, Y., Wang, Z., Zhang, R., Zhu, J., Ren, Y., Tan, Y. C., et al. (2019) · Nucleic Acids Research · doi:10.1093/nar/gkz981 · Cited by 798
Identification of MRTX1133, a Noncovalent, Potent, and Selective KRAS G12D Inhibitor
Wang, X., Allen, S., Blake, J. F., Bowcut, V., Briere, D. M., Calinisan, A., Dahlke, J. R., Fell, J. B., Fischer, J. P., Gunn, R. J., et al. (2022) · Journal of Medicinal Chemistry · doi:10.1021/acs.jmedchem.1c01688 · Cited by 769
Metadata
- Authors
- Kessler, D., Gmachl, M., Mantoulidis, A., Martin, L. J., Zoephel, A., Mayer, M., Gollner, A., Covini, D., Fischer, S., Gerstberger, T., Gmaschitz, T., Goodwin, C., Greb, P., Häring, D., Hela, W., Hoffmann, J., Karolyi-Oezguer, J., Knesl, P., Kornigg, S., Koegl, M., Kousek, R., Lamarre, L., Moser, F., Munico-Martinez, S., Peinsipp, C., Phan, J., Rinnenthal, J., Sai, J., Salamon, C., Scherbantin, Y., Schipany, K., Schnitzer, R., Schrenk, A., Sharps, B., Siszler, G., Sun, Q., Waterson, A., Wolkerstorfer, B., Zeeb, M., Pearson, M., Fesik, S. W., & McConnell, D. B.
- Affiliations
- Boehringer Ingelheim (Austria) (AT)
- Vanderbilt University (US)
- Discovery Research, Boehringer Ingelheim Regional Center Vienna GmbH & Co KG, 1120 Vienna, Austria;
- Boehringer Ingelheim (Germany) (DE)
- Corresponding author
- McConnell, Darryl B.
- ORCID
- Venue
- Proceedings of the National Academy of Sciences
- Publisher
- National Academy of Sciences
- Published
- 2019-07-22
- Volume
- 116
- Issue
- 32
- Pages
- 15823-15829
- ISSN
- 0027-8424 (ISSN-L)
- 1091-6490
- PMC
- PMC6689897
- OpenAlex
- W2963086398
- Cited by
- 449
- References
- 51
- Citations by year
- 2026: 52 · 2025: 58 · 2024: 71 · 2023: 66 · 2022: 58 · 2021: 63 · 2020: 69 · 2019: 12
- FWCI
- 17.03
- Type
- journal article
- Language
- en
- Open access
- hybrid
- doi.org
- Licence
- Locations
- Proceedings of the National Academy of Sciences (publishedVersion, cc-by)
- Europe PMC (PubMed Central) (publishedVersion, cc-by)
- PubMed Central (publishedVersion, cc-by)
- PubMed (publishedVersion)
- DORA PSI (Paul Scherrer Institute) (submittedVersion, cc-by)
- OSTI OAI (U.S. Department of Energy Office of Scientific and Technical Information) (submittedVersion)
- Funders
- U.S. Department of Energy (DE‐ AC02‐06CH11357, AC02‐06CH11357, 06CH11357, DE-AC02-)
- Vanderbilt University
- Paul Scherrer Institut
- National Institutes of Health (DE-AC02–06CH11357)
- Office of Science (AC02‐06CH11357, DE-AC02, 06CH11357, DE-AC02-06CH11357)
- National Cancer Institute (P50A095103, DE-AC02-06CH11357, P50CA095103, RC2CA148375, P30CA068485)
- Vanderbilt Institute of Chemical Biology, School of Medicine, Vanderbilt University (P30CA68485)
- Argonne National Laboratory (DE- AC02-06-CH11357, DE-AC02, AC02–06CH11357, 06CH11357)
- Topics
- Life Sciences › Biochemistry, Genetics and Molecular Biology › Molecular Biology › Protein Kinase Regulation and GTPase Signaling
- Life Sciences › Biochemistry, Genetics and Molecular Biology › Molecular Biology › Protein Tyrosine Phosphatases
- Life Sciences › Pharmacology, Toxicology and Pharmaceutics › Drug Discovery › Computational Drug Discovery Methods
- Keywords
- KRAS, Ras GTPase, structure-based drug design, oncogenic Ras mutations, antiproliferative activity, chemical probes
- MeSH terms
- Pharmaceutical Preparations, Guanosine Triphosphate, Humans, Models, Molecular, Proto-Oncogene Proteins p21(ras), Nanoparticles, Drug Discovery
About these checks
Registry, retraction, Cites and statistics results are computed, not judged, with one exception: a printed reference that no index lists is read once by a model before it counts as a citation error. Claims are extracted by a model and kept only when their quote appears verbatim in the text; each cited source is then checked, with a model’s help, for whether it says what the claim relies on. Those verdicts can be wrong — read the claim’s quote and the cited source before relying on one.
Statistics and arithmetic are recomputed, not judged.
Confidence bands are shown only for fields calibrated on our annotated test set. None is calibrated yet, so no band is shown.
What counts as a claim ›How we measure confidence ›How we check this ›
Are you an author, or do you see a problem with this page? Request a review
