

The DOI matches its Crossref record; 75 of the 77 references it cites were found in a registry or an index.
Future of the human climate niche
Open accessAbstract
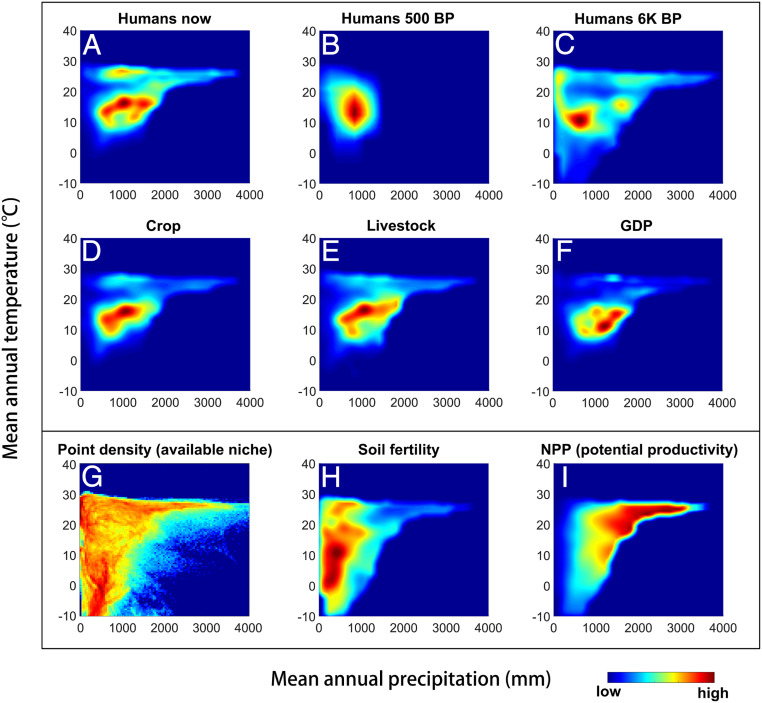
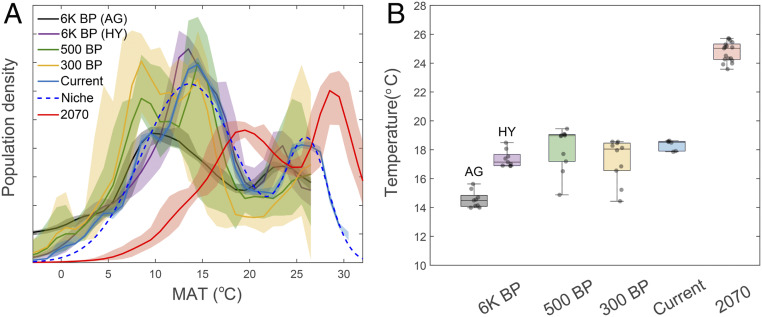
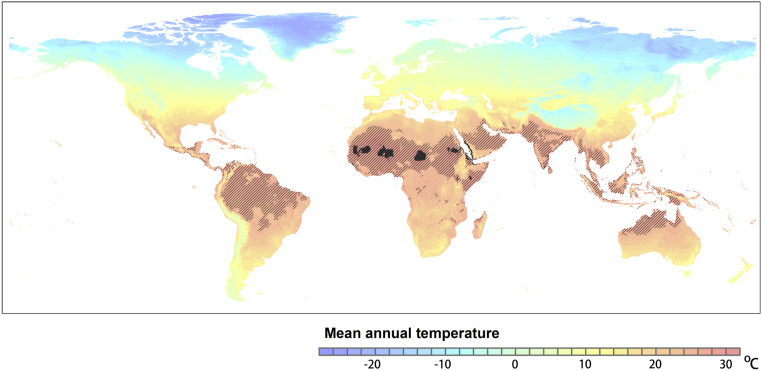
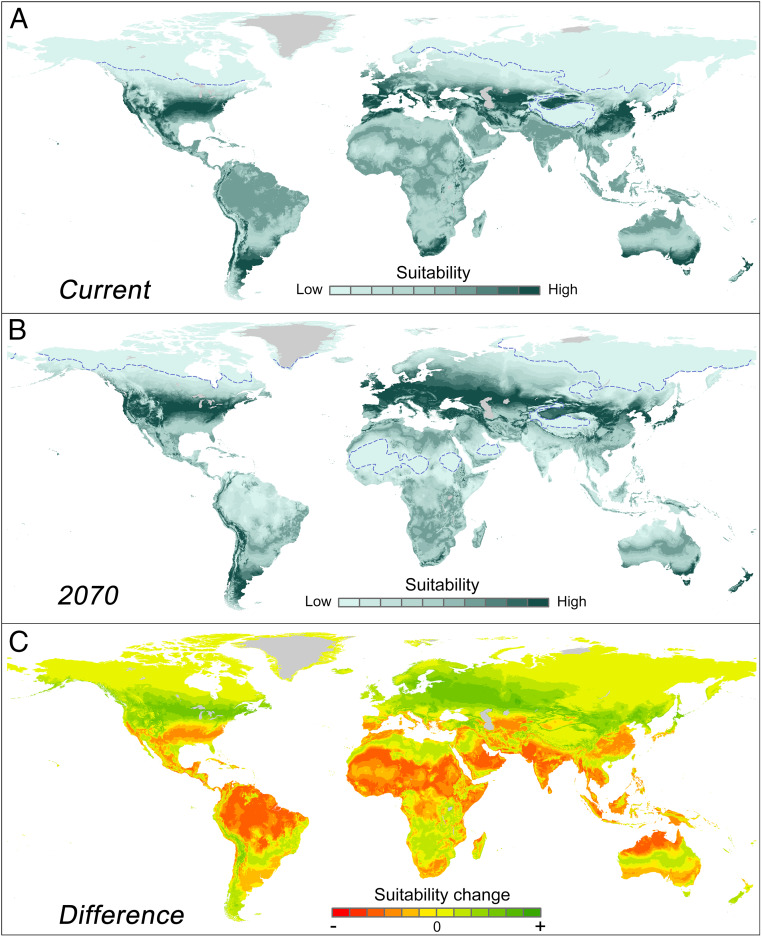
Significance: We show that for thousands of years, humans have concentrated in a surprisingly narrow subset of Earth’s available climates, characterized by mean annual temperatures around ∼13 °C. This distribution likely reflects a human temperature niche related to fundamental constraints. We demonstrate that depending on scenarios of population growth and warming, over the coming 50 y, 1 to 3 billion people are projected to be left outside the climate conditions that have served humanity well over the past 6,000 y. Absent climate mitigation or migration, a substantial part of humanity will be exposed to mean annual temperatures warmer than nearly anywhere today.
Overview
The claims and statistics of this paper haven’t been checked yet.
Run the check — free, no account needed. It reads the open-access text and checks the sources it cites.
Integrity signals
Registry
Cites
Statistics
Figures
Verification
Claims the paper makes
The claims and statistics of this paper haven’t been checked yet.
Run the check — free, no account needed. It reads the open-access text and checks the sources it cites.
Claims other papers make about this one
Each is checked against this paper’s own text: does it say what the citing paper says it does?
The source backs part of the claim, not all of it — or backs it for a different population, condition or comparison.
In the citing paper
“Worst-case scenario models that assume business-as-usual approaches to climate change predict that nearly one-third of the global population will live in extremely hot (uninhabitable) climates, currently found in less than 1% of the earth’s surface mainly in the Sahara.”
From Climate Change, Migration, and Civil Strife. (2020) · cites this paper as [25]
Experimental — accuracy not yet measuredThe source backs part of the claim, not all of it — or backs it for a different population, condition or comparison.
In the citing paper
“A 2019 model suggests that business-as-usual approaches to climate mitigation and population growth may expose one in three humans in this belt to high temperatures currently found only on 0.8% of the earth’s surface [25].”
From Climate Change, Migration, and Civil Strife. (2020) · cites this paper as [25]
Experimental — accuracy not yet measuredThe source backs part of the claim, not all of it — or backs it for a different population, condition or comparison.
In the citing paper
“Maximum temperatures during the dry season follow a similar trend, rising across most of the biome (Extended Data Fig. 2), exposing the forest34 and local peoples35 to potentially unbearable heat.”
From Critical transitions in the Amazon forest system (2024) · cites this paper as [35]
Experimental — accuracy not yet measuredThe check wasn’t confident either way, so it gives no verdict — never disputed.
In the citing paper
“From the 'northern route' entry 27,47 (Fig. 3) into the modern western tip of New Guinea, the main movement corridor is along the southern slopes of the New Guinea highlands (p = 0.9112) linking to southern Sahul via the then-exposed Torres Strait region (p = 0.9171).”
From Landscape rules predict optimal superhighways for the first peopling of sahul (2021) · cites this paper as [47]
Experimental — accuracy not yet measured
Self-check
Percentages, sums and reported differences re-computed from the paper’s own numbers.
The self-check needs the paper’s full text.
Citations
Cites
Very high resolution interpolated climate surfaces for global land areas
Hijmans, R. J., Cameron, S. E., Parra, J. L., Jones, P. G., & Jarvis, A. (2005) · International Journal of Climatology · doi:10.1002/joc.1276 · Cited by 19,860
Why Nations Fail: The Origins of Power, Prosperity and Poverty
Acemoglu, D., & Robinson, J. A. (2012) · ASEAN ECONOMIC BULLETIN · doi:10.1355/ae29-2j · Cited by 5,568
Guns, Germs, and Steel: The Fates of Human Societies.
Hardin, G., & Diamond, J. M. (1997) · Population and Development Review · doi:10.2307/2137390 · Cited by 4,983
Aghion, P., & Durlauf, S. N. (2005) · RePEc: Research Papers in Economics · Cited by 4,447
Mitchell, T. D., & Jones, P. D. (2005) · International Journal of Climatology · doi:10.1002/joc.1181 · Cited by 3,820
The RCP greenhouse gas concentrations and their extensions from 1765 to 2300
Meinshausen, M. A., Smith, S. J., Calvin, K., Daniel, J. S., Kainuma, M., Lamarque, J., Matsumoto, K., Montzka, S. A., Raper, S. C. B., Riahi, K., et al. (2011) · Climatic Change · doi:10.1007/s10584-011-0156-z · Cited by 3,781
Why nations fail: the origins of power, prosperity, and poverty
Acemoğlu, D., & Robinson, J. A. (2012) · Choice Reviews Online · doi:10.5860/choice.50-0390 · Cited by 3,643
Abatzoglou, J. T., Dobrowski, S. Z., Parks, S. A., & Hegewisch, K. C. (2018) · Scientific Data · doi:10.1038/sdata.2017.191 · Cited by 3,529
Watson, R., Albritton, D. L., Barker, T., Baskmakov, I., Canziani, O. F., Christ, R., Ulrich Cubasch, B., Davidson, O., Gitay, H., Griggs, D., et al. (2001) · Cited by 3,473
Institutions as the Fundamental Cause of Long-Run Growth
Acemoğlu, D., Johnson, S., & Robinson, J. A. (2004) · National Bureau of Economic Research · doi:10.3386/w10481 · Cited by 3,169
Cited by
Sorted by citations
Items 601–700 of 860
Elementos de luz e sombra: brise e cobogó
de Sousa, J. A. B. (2022) · LaSUS FAU eBooks · doi:10.29327/579318.1-16
Espelhos d’água além da estética: um climatizador natural
Adário, J. L. (2022) · LaSUS FAU eBooks · doi:10.29327/579318.1-9
Os átrios e a ventilação natural em edif ícios altos
Kuniochi, E. M. U. (2022) · LaSUS FAU eBooks · doi:10.29327/579318.1-20
de Medeiros, A. D. (2022) · LaSUS FAU eBooks · doi:10.29327/579318.1-13
Materiais de construção para um futuro sustentável
Siqueira, F. F. D. S. (2022) · LaSUS FAU eBooks · doi:10.29327/579318.1-34
A iluminação em equipamentos em espaços públicos
Sousa, G. D. B. (2022) · LaSUS FAU eBooks · doi:10.29327/579318.1-14
Dicas bioclimáticas (prefácio)
Romero, M. A. B. (2022) · LaSUS FAU eBooks · doi:10.29327/579318.1-1
A escolha da cobertura para promover mais conforto térmico
Couto, L. (2022) · LaSUS FAU eBooks · doi:10.29327/579318.1-26
Bioconcretos geram bom desempenho térmico
Caldas, L. R., & Dias, R. (2022) · LaSUS FAU eBooks · doi:10.29327/579318.1-35
Uma usina de energia no seu telhado
Cronemberger, J. (2022) · LaSUS FAU eBooks · doi:10.29327/579318.1-29
Vidros de baixa refletância em fachadas
Martins, L. D. O. (2022) · LaSUS FAU eBooks · doi:10.29327/579318.1-25
O potencial dos edifícios de balanço energético nulo
Costa, J. F. W. (2022) · LaSUS FAU eBooks · doi:10.29327/579318.1-33
Ventilação Natural + Ventilação Mecânica = Eficiência Energética
Cordeiro, A. C. B. (2022) · LaSUS FAU eBooks · doi:10.29327/579318.1-31
Sistemas compensatórios de drenagem urbana
Liserre, A. P. A. R., & Reis, R. P. A. (2022) · LaSUS FAU eBooks · doi:10.29327/579318.1-39
Vegetação + Ventilação = Qualidade do Ar
Sales, G. D. L. (2022) · LaSUS FAU eBooks · doi:10.29327/579318.1-19
Umidade e mecanismos higrotérmicos atuantes nos sistemas construtivos
Zanoni, V. A. G. (2022) · LaSUS FAU eBooks · doi:10.29327/579318.1-37
A importância da caracterização higrotérmica para a pesquisa de campo
Rios, R. B. (2022) · LaSUS FAU eBooks · doi:10.29327/579318.1-36
Atenção para a qualidade da iluminação
de Medeiros, A. D. (2022) · LaSUS FAU eBooks · doi:10.29327/579318.1-12
Fachadas vegetadas para mitigação térmica
Souza, C. A. D. S. (2022) · LaSUS FAU eBooks · doi:10.29327/579318.1-6
As diversas funcionalidades do uso de sheds nas coberturas
Faria, R. C. A. (2022) · LaSUS FAU eBooks · doi:10.29327/579318.1-27
A Just Resilience (Pillar Five)
Morrissey, J. E., & Heidkamp, C. P. (2022) · Springer eBooks · doi:10.1007/978-3-031-18958-6_6
Droege, P. (2023) · Elsevier eBooks · doi:10.1016/b978-0-12-820286-9.00018-2
Nascimento, L. L., Silva, J. I. A. O., Souza, C. M. D. M., Ramalho, Â. M. C., Mello, B. J., Nemetz, S. M. M. C. C. D. S., Feldhaus, J. M. D. N., & dos Santos, G. F. (2023) · Revista Brasileira de Geografia Física · doi:10.26848/rbgf.v16.1.p291-309
(2023) · Elsevier eBooks · doi:10.1016/b978-0-443-18775-9.16001-2
Xie, H., Hu, J. H., Yue, X., Zhao, F., Chen, J., van der Hooft, J. J. J., Medema, M. H., Li, P., & Zhang, Q. (2023) · Research Square · doi:10.21203/rs.3.rs-2471999/v2
Climate Change and Disasters in The Three Northern Regions of Ghana
Weobong, C. A.-A., & Dovie, D. B. K. (2023) · Advances in Social Sciences Research Journal · doi:10.14738/assrj.105.14380
Holtorf, C. J., & Högberg, A. (2023) · Elsevier eBooks · doi:10.1016/b978-0-323-90799-6.00112-9
Mobilising central bank digital currency to bend the curve of biodiversity lossPreprint
Millard, J. W. (2023) · doi:10.31219/osf.io/j7phu
Walther, C. C. (2023) · Springer eBooks · doi:10.1007/978-3-031-36043-5_4
Weighill, B., & Byrne, K. (2023) · SSRN Electronic Journal · doi:10.2139/ssrn.4512368
Comment on egusphere-2023-1459
Laybourn‐Langton, L., Evans, J., & Dyke, J. G. (2023) · doi:10.5194/egusphere-2023-1459-rc1
Comment on egusphere-2023-1459
Laybourn, L., Evans, J., & Dyke, J. G. (2023) · doi:10.5194/egusphere-2023-1459-rc2
Laybourn‐Langton, L. (2023) · doi:10.5194/egusphere-2023-1459-ac1
Laybourn‐Langton, L. (2023) · doi:10.5194/egusphere-2023-1459-ac2
World Economic Outlook, October 2020
(2020) · International Monetary Fund eBooks · doi:10.5089/9781513561776.081
World Economic Outlook, October 2020
(2020) · International Monetary Fund eBooks · doi:10.5089/9781513561790.081
(2023) · Cambridge Prisms Coastal Futures · doi:10.1017/cft.2023.23.pr13 · Cited by 1
(2023) · Cambridge Prisms Coastal Futures · doi:10.1017/cft.2023.23.pr9
(2023) · Cambridge Prisms Coastal Futures · doi:10.1017/cft.2023.23.pr8
(2023) · Cambridge Prisms Coastal Futures · doi:10.1017/cft.2023.23.pr6
(2023) · Cambridge Prisms Coastal Futures · doi:10.1017/cft.2023.23.pr5
(2023) · Cambridge Prisms Coastal Futures · doi:10.1017/cft.2023.23.pr15
(2023) · Cambridge Prisms Coastal Futures · doi:10.1017/cft.2023.23.pr14
Day, J. W. (2023) · Cambridge Prisms Coastal Futures · doi:10.1017/cft.2023.23.pr12
(2023) · Cambridge Prisms Coastal Futures · doi:10.1017/cft.2023.23.pr11
(2023) · Cambridge Prisms Coastal Futures · doi:10.1017/cft.2023.23.pr10
Day, J. W. (2023) · Cambridge Prisms Coastal Futures · doi:10.1017/cft.2023.23.pr7
(2023) · Cambridge Prisms Coastal Futures · doi:10.1017/cft.2023.23.pr4
(2023) · Cambridge Prisms Coastal Futures · doi:10.1017/cft.2023.23.pr3
(2022) · Cambridge Prisms Coastal Futures · doi:10.1017/cft.2023.23.pr2
Day, J. W. (2022) · Cambridge Prisms Coastal Futures · doi:10.1017/cft.2023.23.pr1
Barros, Á. M. M. (2021) · UPCommons institutional repository (Universitat Politècnica de Catalunya) · doi:10.5821/dissertation-2117-351669
Insights for Addressing Challenges
Rouse, W. B. (2023) · doi:10.1093/oso/9780198892533.003.0003
Renewable Cooling in BuildingsPreprint
Energie-Agentur, D. (2023) · doi:10.31219/osf.io/j2q5c
Understanding Climate Change as Societal Risk
Granberg, M., & Glover, L. (2023) · Springer eBooks · doi:10.1007/978-3-031-43961-2_5
“Data science” versus physical science: is data technology leading us towards a new synthesis?
Balaji, V. (2023) · Comptes Rendus Géoscience · doi:10.5802/crgeos.24-en
Come hell or high water: climate change through the lens of neurocritical care
Fischer, D. B. (2023) · Intensive Care Medicine · doi:10.1007/s00134-023-07253-y
The Trifurcation of Energy Futures
King, N., & Jones, A. W. (2023) · Springer eBooks · doi:10.1007/978-3-031-46448-5_2
Mendes, J. R., de Leão, I. P., Mendes, M. D. C. P. E. S. C., & Mendes, R. P. (2023) · INfAST. Institute for Anthropocene Studies eBooks · doi:10.21814/1822/87424
miR159c Expression Under Nanoparticle Stress in Flax ( Linum usitatissimum L.) Calli
Kokina, I., Jermaļonoka, M., & Plaksenkova, I. (2023) · Proceedings of the Latvian Academy of Sciences Section B Natural Exact and Applied Sciences · doi:10.2478/prolas-2023-0038
Online/Offline discrepancies in moral judgement among social media users: A mixed methods study
Classen, B. (2024) · Open Access Victoria University of Wellington | Te Herenga Waka (Figshare) · doi:10.26686/wgtn.24993774
Ferrera, M., Miró, J., & Ronchi, S. (2024) · Edward Elgar Publishing eBooks · doi:10.4337/9781035311446.00013
Exploring Climate Resilience: Interdisciplinary perspectives from spatial sciences
Kumer, P., & Davidović, D. (2023) · Journal for Geography · doi:10.18690/rg.18.1.3566
The Impact of Climate Change on National Security
Sotiroski, L. (2024) · International Journal of Sustainable Development and Planning · doi:10.18280/ijsdp.190138 · Cited by 2
(2024) · Duke University Press eBooks · doi:10.1215/9781478027577-015
References and Additional Sources
(2024) · Duke University Press eBooks · doi:10.1215/9781478027577-030
(2024) · Duke University Press eBooks · doi:10.1215/9781478027577-028
(2024) · Duke University Press eBooks · doi:10.1215/9781478027577-004
The 2021 United Nations Climate Report
(2024) · Duke University Press eBooks · doi:10.1215/9781478027577-003
(2024) · Duke University Press eBooks · doi:10.1215/9781478027577-008
(2024) · Duke University Press eBooks · doi:10.1215/9781478027577-007
(2024) · Duke University Press eBooks · doi:10.1215/9781478027577-023
(2024) · Duke University Press eBooks · doi:10.1215/9781478027577-022
(2024) · Duke University Press eBooks · doi:10.1215/9781478027577-021
(2024) · Duke University Press eBooks · doi:10.1215/9781478027577-012
(2024) · Duke University Press eBooks · doi:10.1215/9781478027577-020
(2024) · Duke University Press eBooks · doi:10.1215/9781478027577-019
(2024) · Duke University Press eBooks · doi:10.1215/9781478027577-013
(2024) · Duke University Press eBooks · doi:10.1215/9781478027577-024
(2024) · Duke University Press eBooks · doi:10.1215/9781478027577-014
(2024) · Duke University Press eBooks · doi:10.1215/9781478027577-010
(2024) · Duke University Press eBooks · doi:10.1215/9781478027577-011
(2024) · Duke University Press eBooks · doi:10.1215/9781478027577-018
(2024) · Duke University Press eBooks · doi:10.1215/9781478027577-002
(2024) · Duke University Press eBooks · doi:10.1215/9781478027577-017
(2024) · Duke University Press eBooks · doi:10.1215/9781478027577-016
(2024) · Duke University Press eBooks · doi:10.1215/9781478027577-009
(2024) · Duke University Press eBooks · doi:10.1215/9781478027577-006
(2024) · Duke University Press eBooks · doi:10.1215/9781478027577-005
(2024) · Duke University Press eBooks · doi:10.1215/9781478027577-025
(2024) · Duke University Press eBooks · doi:10.1215/9781478027577-001
(2024) · Duke University Press eBooks · doi:10.1215/9781478027577-026
(2024) · Duke University Press eBooks · doi:10.1215/9781478027577-029
(2024) · Duke University Press eBooks · doi:10.1215/9781478027577-027
Climate Migration in Post-Apocalyptic Narratives on the Mainstream Screen
Koncz, L., & Boas, A. V. (2024) · Religions · doi:10.3390/rel15020231
Disobedience in a Climate of Necessity
Mittiga, R. A. (2024) · doi:10.1093/oso/9780192868879.003.0004
Environmentalism, or Barbarism
Mittiga, R. A. (2024) · doi:10.1093/oso/9780192868879.003.0001
Political Legitimacy, Authoritarianism, and Climate Change
Mittiga, R. A. (2024) · doi:10.1093/oso/9780192868879.003.0003
Metadata
- Authors
- Xu, C., Kohler, T. A., Lenton, T. M., Svenning, J.-C., & Scheffer, M.
- Affiliations
- Nanjing University (CN)
- Crow Canyon Archaeological Center (US)
- University of Exeter (GB)
- Aarhus University (DK)
- Santa Fe Institute (US)
- Corresponding author
- Xu, Chi
- Scheffer, Marten
- Venue
- Proceedings of the National Academy of Sciences
- Publisher
- National Academy of Sciences
- Published
- 2020-05-04
- Volume
- 117
- Issue
- 21
- Pages
- 11350-11355
- ISSN
- 0027-8424 (ISSN-L)
- 1091-6490
- PMC
- PMC7260949
- OpenAlex
- W3021189791
- Cited by
- 862
- References
- 77
- Citations by year
- 2026: 62 · 2025: 102 · 2024: 181 · 2023: 143 · 2022: 160 · 2021: 150 · 2020: 64
- FWCI
- 51.67
- Type
- journal article
- Language
- en
- Open access
- hybrid
- doi.org
- Licence
- Locations
- Proceedings of the National Academy of Sciences (publishedVersion, cc-by-nc-nd)
- PubMed Central (publishedVersion, cc-by-nc-nd)
- PubMed (publishedVersion)
- Socio-Environmental Systems Modeling (acceptedVersion, cc-by-nc-nd)
- Figshare (submittedVersion, cc-by-nc-nd)
- Open Research Exeter (University of Exeter) (submittedVersion, cc-by-nc-nd)
- Data Archiving and Networked Services (DANS) (submittedVersion, cc-by-nc-nd)
- Funders
- national natural s (31770512)
- Leverhulme Trust (RPG-2018-046)
- National Science Foundation (SMA-1637171)
- Villum Fonden (16549)
- Topics
- Physical Sciences › Environmental Science › Health, Toxicology and Mutagenesis › Climate Change and Health Impacts
- Physical Sciences › Environmental Science › Global and Planetary Change › Climate variability and models
- Life Sciences › Agricultural and Biological Sciences › Agronomy and Crop Science › Climate change impacts on agriculture
- Keywords
- mean annual temperature, climate envelope, thermal adaptation, migration, in situ adaptation, agricultural production, economic output, Sahara, human development, climate change mitigation
- MeSH terms
- Africa, Northern, Agriculture, Animals, Humans, Population Density, Population Dynamics, Temperature, Data Mining, Climate Change, Livestock, Human Migration
About these checks
Registry, retraction, Cites and statistics results are computed, not judged, with one exception: a printed reference that no index lists is read once by a model before it counts as a citation error. Claims are extracted by a model and kept only when their quote appears verbatim in the text; each cited source is then checked, with a model’s help, for whether it says what the claim relies on. Those verdicts can be wrong — read the claim’s quote and the cited source before relying on one.
Statistics and arithmetic are recomputed, not judged.
Confidence bands are shown only for fields calibrated on our annotated test set. None is calibrated yet, so no band is shown.
What counts as a claim ›How we measure confidence ›How we check this ›
Are you an author, or do you see a problem with this page? Request a review
