

The DOI matches its Crossref record; 12 of the 12 references it cites were found in a registry or an index.
Evolutionary history of modern Samoans
Abstract
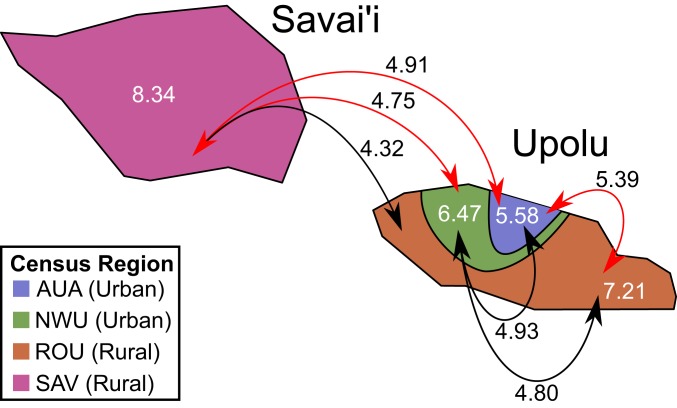
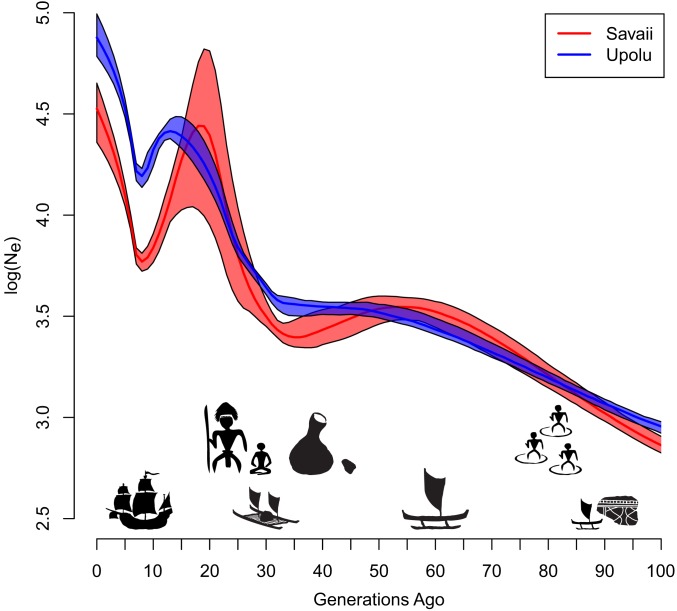
Archaeological studies estimate the initial settlement of Samoa at 2,750 to 2,880 y ago and identify only limited settlement and human modification to the landscape until about 1,000 to 1,500 y ago. At this point, a complex history of migration is thought to have begun with the arrival of people sharing ancestry with Near Oceanic groups (i.e., Austronesian-speaking and Papuan-speaking groups), and was then followed by the arrival of non-Oceanic groups during European colonialism. However, the specifics of this peopling are not entirely clear from the archaeological and anthropological records, and is therefore a focus of continued debate. To shed additional light on the Samoan population history that this peopling reflects, we employ a population genetic approach to analyze 1,197 Samoan high-coverage whole genomes. We identify population splits between the major Samoan islands and detect asymmetrical gene flow to the capital city. We also find an extreme bottleneck until about 1,000 y ago, which is followed by distinct expansions across the islands and subsequent bottlenecks consistent with European colonization. These results provide for an increased understanding of Samoan population history and the dynamics that inform it, and also demonstrate how rapid demographic processes can shape modern genomes.
Overview
The claims and statistics of this paper haven’t been checked yet.
Run the check — free, no account needed. It reads the open-access text and checks the sources it cites.
Integrity signals
Registry
Cites
Statistics
Figures
Verification
Claims the paper makes
The claims and statistics of this paper haven’t been checked yet.
Run the check — free, no account needed. It reads the open-access text and checks the sources it cites.
Claims other papers make about this one
Each is checked against this paper’s own text: does it say what the citing paper says it does?
The source backs part of the claim, not all of it — or backs it for a different population, condition or comparison.
In the citing paper
“Here we apply IBDNe to be Polynesian specific (considering only Polynesian ancestry segments) to remove the confounding effect of admixture (19), since European genetic ancestry on the island reflects French colonization and France’s population history.”
From Message in a bottleneck: Nested founder effects from French Polynesia to Rapa Nui and Hawaiʻi (2026) · cites this paper as [19]
Experimental — accuracy not yet measured
Self-check
Percentages, sums and reported differences re-computed from the paper’s own numbers.
The self-check needs the paper’s full text.
Citations
Cites
Robust relationship inference in genome-wide association studies
Manichaikul, A., Mychaleckyj, J. C., Rich, S. S., Daly, K., Sale, M., & Chen, W.-M. (2010) · Bioinformatics · doi:10.1093/bioinformatics/btq559 · Cited by 3,541
Ancient Admixture in Human History
Patterson, N., Moorjani, P., Luo, Y., Mallick, S., Rohland, N., Zhan, Y., Genschoreck, T., Webster, T., & Reich, D. (2012) · Genetics · doi:10.1534/genetics.112.145037 · Cited by 2,848
Ancient human genomes suggest three ancestral populations for present-day Europeans
Lazaridis, I., Patterson, N., Mittnik, A., Renaud, G., Mallick, S., Kirsanow, K., Sudmant, P. H., Schraiber, J. G., Castellano, S., Lipson, M., et al. (2014) · Nature · doi:10.1038/nature13673 · Cited by 1,357
Inference of Population Structure using Dense Haplotype Data
Lawson, D. J., Hellenthal, G., Myers, S., & Falush, D. (2012) · PLoS Genetics · doi:10.1371/journal.pgen.1002453 · Cited by 1,188
A genomic history of Aboriginal Australia
Malaspinas, A.-S., Westaway, M. C., Muller, C., Sousa, V. C., Lao, O., Alves, I., Bergström, A., Athanasiadis, G., Cheng, J. Y., Crawford, J. E., et al. (2016) · Nature · doi:10.1038/nature18299 · Cited by 650
Wilmshurst, J. M., Hunt, T. L., Lipo, C. P., & Anderson, A. J. (2011) · Proceedings of the National Academy of Sciences · doi:10.1073/pnas.1015876108 · Cited by 593 · cited 2×
“This was then closely followed by the formation of complex Samoan chiefdoms (20) and Samoan voyages to East and West Polynesia (21), which both suggest a major demographic change.”
BackgroundGenomic insights into the peopling of the Southwest Pacific
Skoglund, P., Posth, C., Sirak, K., Spriggs, M., Valentin, F., Bedford, S., Clark, G. R., Reepmeyer, C., Petchey, F., Fernandes, D., et al. (2016) · Nature · doi:10.1038/nature19844 · Cited by 414
Ancestry-specific recent effective population size in the Americas
Browning, S. R., Browning, B. L., Daviglus, M. L., Durazo-Arvizu, R. A., Schneiderman, N., Kaplan, R. C., & Laurie, C. C. (2018) · PLOS Genetics · doi:10.1371/journal.pgen.1007385 · Cited by 187
Self-citationPeopling of the Pacific: A Holistic Anthropological Perspective
Patrick, V. K. (2010) · Annual Review of Anthropology · doi:10.1146/annurev.anthro.012809.104936 · Cited by 167
Genome-wide Ancestry Patterns in Rapanui Suggest Pre-European Admixture with Native Americans
Moreno-Mayar, J. V., Rasmussen, S., Seguin-Orlando, A., Rasmussen, M., Liang, M., Flåm, S. T., Lie, B. A., Gilfillan, G. D., Nielsen, R., Thorsby, E., et al. (2014) · Current Biology · doi:10.1016/j.cub.2014.09.057 · Cited by 74
Research works printed but not linked: 49
- E. Matisoo-Smith, Ancient DNA and the human settlement of the Pacific: A review. J. Hum. Evol. 79, 93–104 (2015). · DOI
- J. F. O’Connell, J. Allen, The process, biotic impact, and global implications of the human colonization of Sahul about 47,000 years ago. J. Archaeol. Sci. 56, 73–84 (2015). · DOI · Paper page
- R. D. Gray, A. J. Drummond, S. J. Greenhill, Language phylogenies reveal expansion pulses and pauses in Pacific settlement. Science 323, 479–483 (2009). · DOI · Paper page
- M. Lipson ., Population turnover in Remote Oceania shortly after initial settlement. Curr. Biol. 28, 1157–1165.e7 (2018). · DOI
- I. Pugach ., The gateway from near into Remote Oceania: New insights from genome-wide data. Mol. Biol. Evol. 35, 871–886 (2018). · DOI
- K. E. Langergraber ., Generation times in wild chimpanzees and gorillas suggest earlier divergence times in great ape and human evolution. Proc. Natl. Acad. Sci. U.S.A. 109, 15716–15721 (2012). · DOI
- D. V. Burley, D. J. Addison, “Tonga and Sāmoa in Oceanic prehistory: Contemporary debates and personal perspectives” in The Oxford Handbook of Prehistoric Oceania, E. E. Cochrane, T. L. Hunt, Eds. (Oxford University Press, New York, NY, 2018), pp. 231–251.
- F. J. Petchey, Radiocarbon determinations from the Mulifanua Lapita site, Upolu, Western Samoa. Radiocarbon 43, 63–68 (2001). · DOI
- J. T. Clark ., Refining the chronology for west polynesian colonization: New data from the Samoan archipelago. J. Archaeol. Sci. Rep. 6, 266–274 (2016).
- T. M. Rieth, A. E. Morrison, D. J. Addison, The temporal and spatial patterning of the initial settlement of Sāmoa. J. Island Coast. Archaeol. 3, 214–239 (2008). · DOI
- E. E. Cochrane, T. M. Rieth, W. R. Dickinson, Plainware ceramics from Sāmoa: Insights into ceramic chronology, cultural transmission, and selection among colonizing populations. J. Anthropol. Archaeol. 32, 499–510 (2013). · DOI
- E. E. Cochrane, T. M. Rieth, Sāmoan artefact provenance reveals limited artefact transfer within and beyond the archipelago. Archaeol. Ocean. 51, 150–157 (2016). · DOI · Paper page
- E. E. Cochrane ., Lack of suitable coastal plains likely influenced Lapita (∼2800 cal. BP) settlement of Sāmoa: Evidence from south-eastern ‘Upolu. Holocene 26, 126–135 (2016). · DOI
- W. R. Dickinson, R. C. Green, Geoarchaeological context of Holocene subsidence at the ferry berth Lapita site, Mulifanua, Upolu, Samoa. Geoarchaeology 13, 239–263 (1998). · DOI
- R. C. Green, “A retrospective view of settlement pattern studies in Samoa” in Pacific Landscapes: Archaeological Approaches, T. Ladefoged, M. Graves, Eds. (The Easter Island Foundation, 2002), pp. 125–152.
- J. T. Clark, “Samoan prehistory in review” in Oceanic Culture History: Essays in Honour of Roger Green, J. Davidson, G. Irwin, F. Leach, A. K. Pawley, D. Brown, Eds. (New Zealand Archaeological Association, Dunedin, New Zealand, 1996), pp. 445–460.
- S. J. Quintus, E. E. Cochrane, Pre-contact Samoan cultivation practices in regional and theoretical perspective. J. Island Coast. Archaeol. 13, 474–500 (2017). · DOI
- L. D. Holmes, Factors contributing to the cultural stability of Samoa. Anthropol. Q. 53, 188–197 (1980). · DOI
- P. S. Meleisea, Lagaga: A Short History of Western Samoa (University of the South Pacific, 1987).
- J. A. Moses, The coolie labour question and German colonial policy in Samoa, 1900-1914. J. Pac. Hist. 8, 101–124 (1973). · DOI
- P. Pirie, “Population growth in the Pacific Islands: The example of Western Samoa” in Man in the Pacific Islands: Essays on Geographical Change in the Pacific Island, R. G. Ward, Eds. (Oxford University Press, Oxford, UK, 1972), pp. 189–218.
- P. N. D. Pirie “The geography of population in Western Samoa ” PhD thesis Australian National University Canberra Australia (1963).
- Samoa Bureau of Statistics, 2016 CENSUS Brief No. 1 (Samoa Bureau of Statistics, 2017).
- D. Taliun . Sequencing of 53 831 diverse genomes from the NHLBI TOPMed program. bioRxiv:563866 (6 March 2019).
- R. L. Minster ., A thrifty variant in CREBRF strongly influences body mass index in Samoans. Nat. Genet. 48, 1049–1054 (2016). · DOI
- N. L. Hawley ., Prevalence of adiposity and associated cardiometabolic risk factors in the Samoan genome-wide association study. Am. J. Hum. Biol. 26, 491–501 (2014). · DOI
- R. C. Green, Linguistic, biological and cultural origins of the initial inhabitants of Remote Oceania. N. Z. J. Archaeol. 17, 5–27 (1997).
- D. H. Alexander, J. Novembre, K. Lange, Fast model-based estimation of ancestry in unrelated individuals. Genome Res. 19, 1655–1664 (2009). · DOI · Paper page
- H. Zhou, D. Alexander, K. Lange, A quasi-Newton acceleration for high-dimensional optimization algorithms. Stat. Comput. 21, 261–273 (2011). · DOI
- G. Hellenthal ., A genetic atlas of human admixture history. Science 343, 747–751 (2014). · DOI · Paper page
- W. Fu .; NHLBI Exome Sequencing Project, Analysis of 6,515 exomes reveals the recent origin of most human protein-coding variants. Nature 493, 216–220 (2013). · DOI
- T. D. O’Connor .; NHLBI GO Exome Sequencing Project; ESP Population Genetics and Statistical Analysis Working Group, Emily Turner, Rare variation facilitates inferences of fine-scale population structure in humans. Mol. Biol. Evol. 32, 653–660 (2015). · DOI
- S. R. Browning, B. L. Browning, Accurate non-parametric estimation of recent effective population size from segments of identity by descent. Am. J. Hum. Genet. 97, 404–418 (2015). · DOI
- P. O’Brien, Tautai: Sāmoa, World History, and the Life of Taʻisi O. F. Nelson (University of Hawaiʻi Press, Honolulu, HI, 2017). · DOI
- R. C. Green, “Pottery from the Lagoon at Mulifanua, Upolu (Report 33)” in Archaeology in Western Samoa, R. C. Green, J. M. Davidson, Eds. (Auckland Institute and Museum, Auckland, New Zealand, 1974), vol. II, pp. 170–175.
- F. J. Petchey “The archaeology of Kudon: Archaeological analysis of Lapita ceramics from Mulifanua Samoa and Sigatoka Fiji " MA thesis University of Auckland Auckland New Zealand (1995).
- P. V. Kirch, J.-L. Rallu, The Growth and Collapse of Pacific Island Societies: Archaeological and Demographic Perspectives (University of Hawaiʻi Press, Honolulu, HI, 2007). · DOI
- D. V. Burley, “Archaeological demography and population growth in the Kingdom of Tonga 950 BC to the historic era” in Long Term Demographic History in the Pacific Islands, P. Kirch, J.-L. Rallu, Eds. (University of Hawaiʻi Press, Honolulu, HI, 2007), pp. 177–202.
- M. T. Carson, Recent Developments in Prehistory. Perspectives on Settlement Chronology, Inter-Community Relations, and Identity Formation, Polynesian Outliers: The State of the Art (University of Pittsburgh, Pittsburgh, PA, 2012).
- E. E. Cochrane, The evolution of migration: The case of Lapita in the Southwest Pacific. J. Archaeol. Method Theory 25, 520–558 (2018). · DOI
- A. Gusev ., Low-pass genome-wide sequencing and variant inference using identity-by-descent in an isolated human population. Genetics 190, 679–689 (2012). · DOI
- H. Li, A statistical framework for SNP calling, mutation discovery, association mapping and population genetical parameter estimation from sequencing data. Bioinformatics 27, 2987–2993 (2011). · DOI
- C. C. Chang ., Second-generation PLINK: Rising to the challenge of larger and richer datasets. Gigascience 4, 7 (2015). · DOI · Paper page
- S. R. Browning, B. L. Browning, Rapid and accurate haplotype phasing and missing-data inference for whole-genome association studies by use of localized haplotype clustering. Am. J. Hum. Genet. 81, 1084–1097 (2007). · DOI
- International HapMap Consortium, The International HapMap project. Nature 426, 789–796 (2003). · DOI · Paper page
- D. Petkova, J. Novembre, M. Stephens, Visualizing spatial population structure with estimated effective migration surfaces. Nat. Genet. 48, 94–100 (2016). · DOI
- D. Prokopenko ., Utilizing the Jaccard index to reveal population stratification in sequencing data: A simulation study and an application to the 1000 genomes project. Bioinformatics 32, 1366–1372 (2016). · DOI
- B. L. Browning, S. R. Browning, Improving the accuracy and efficiency of identity by descent detection in population data. Genetics 194, 459–471 (2013). · DOI
- ESRI, ArcGIS Desktop: Release 10.6 (Environmental Systems Research Institute, Redlands, CA, 2017).
Cited by
Sorted by citations
Sequencing of 53,831 diverse genomes from the NHLBI TOPMed Program
Taliun, D., Harris, D. N., Kessler, M. D., Carlson, J., Szpiech, Z. A., Torres, R., Taliun, S. A. G., Corvelo, A., Gogarten, S. M., Kang, H. M., et al. (2021) · Nature · doi:10.1038/s41586-021-03205-y · Cited by 2,213
Self-citationStructural variation across 138,134 samples in the TOPMed consortium
Jun, G., English, A., Metcalf, G., Yang, J., Chaisson, M., Pankratz, N., Menon, V., Salerno, W., Krasheninina, O., Smith, A., et al. (2023) · doi:10.21203/rs.3.rs-2515453/v1 · Cited by 24
Self-citationMessage in a bottleneck: Nested founder effects from French Polynesia to Rapa Nui and Hawaiʻi
Shanks, C., Huang, E. C., Thomassin, C., Emde, A.-K., Rodière, V., Moraga, M., Sandoval, K., Merriman, T., Pascart, T., Moreno-Estrada, A., et al. (2026) · Science · doi:10.1126/science.aec7662
Metadata
- Authors
- Harris, D. N., Kessler, M. D., Shetty, A. C., Weeks, D. E., Minster, R. L., Browning, S., Cochrane, E. E., Deka, R., Hawley, N. L., Reupena, M. S., Naseri, T., Trans-Omics for Precision Medicine (TOPMed) Consortium, TOPMed Population Genetics Working Group, McGarvey, S. T., & O’Connor, T. D.
- Affiliations
- Institute for Genome Sciences, University of Maryland School of Medicine, Baltimore, MD 21201;
- Department of Human Genetics, Graduate School of Public Health, University of Pittsburgh, Pittsburgh, PA 15261;
- Department of Biostatistics, University of Washington, Seattle, WA 98195;
- Anthropology, The University of Auckland, Auckland 1010, New Zealand;
- Department of Environmental Health, University of Cincinnati College of Medicine, Cincinnati, OH 45267;
- Department of Epidemiology (Chronic Disease), Yale University School of Public Health, New Haven, CT 06520;
- Lutia i Puava ae Mapu i Fagalele, Apia, Samoa 663030;
- Ministry of Health, Government of Samoa, Apia, Samoa 663030;
- International Health Institute, Department of Epidemiology, Brown University School of Public Health, Providence, RI 02912;
- ORCID
- Cochrane, Ethan E.
- Venue
- Proceedings of the National Academy of Sciences
- Publisher
- National Academy of Sciences
- Published
- 2020-04-14
- Volume
- 117
- Issue
- 17
- Pages
- 9458-9465
- ISSN
- 0027-8424
- 1091-6490
- PMC
- PMC7196816
- Cited by
- 41
- References
- 12
- Language
- en
- Funders
- Royal Society of New Zealand (UOA1709)
- HHS | NIH | National Cancer Institute (T32CA154274)
- HHS | NIH | National Human Genome Research Institute (R35-HG010692-01)
- HHS | NIH | National Heart, Lung, and Blood Institute (U01 HL137181-01)
- NIH (R01-HL133040, R01-HL093093)
About these checks
Registry, retraction, Cites and statistics results are computed, not judged, with one exception: a printed reference that no index lists is read once by a model before it counts as a citation error. Claims are extracted by a model and kept only when their quote appears verbatim in the text; each cited source is then checked, with a model’s help, for whether it says what the claim relies on. Those verdicts can be wrong — read the claim’s quote and the cited source before relying on one.
Statistics and arithmetic are recomputed, not judged.
Confidence bands are shown only for fields calibrated on our annotated test set. None is calibrated yet, so no band is shown.
What counts as a claim ›How we measure confidence ›How we check this ›
Are you an author, or do you see a problem with this page? Request a review
How to cite
Cite CoChat for the checks on this page, and the paper for its own findings.
- This page
- CoChat. (2026). Citation check: Evolutionary history of modern Samoans. https://app.cochat.ai/papers/10.1073/pnas.1913157117
- The paper
- Harris, D. N., Kessler, M. D., Shetty, A. C., Weeks, D. E., Minster, R. L., Browning, S., Cochrane, E. E., Deka, R., Hawley, N. L., Reupena, M. S., Naseri, T., Trans-Omics for Precision Medicine (TOPMed) Consortium, TOPMed Population Genetics Working Group, McGarvey, S. T., & O’Connor, T. D. (2020). Evolutionary history of modern Samoans. Proceedings of the National Academy of Sciences. https://doi.org/10.1073/pnas.1913157117
