

The DOI matches its Crossref record; 32 of the 33 references it cites were found in a registry or an index.
Communicating sentiment and outlook reverses inaction against collective risks
Open accessAbstract
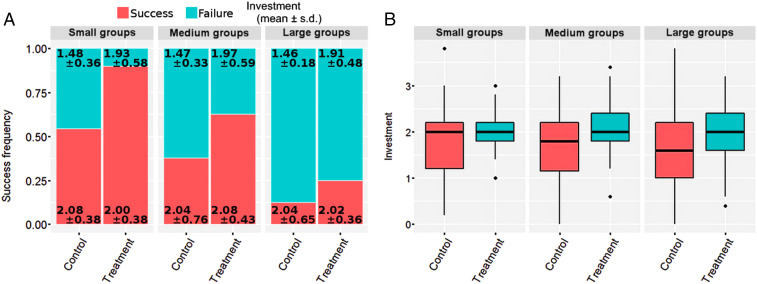
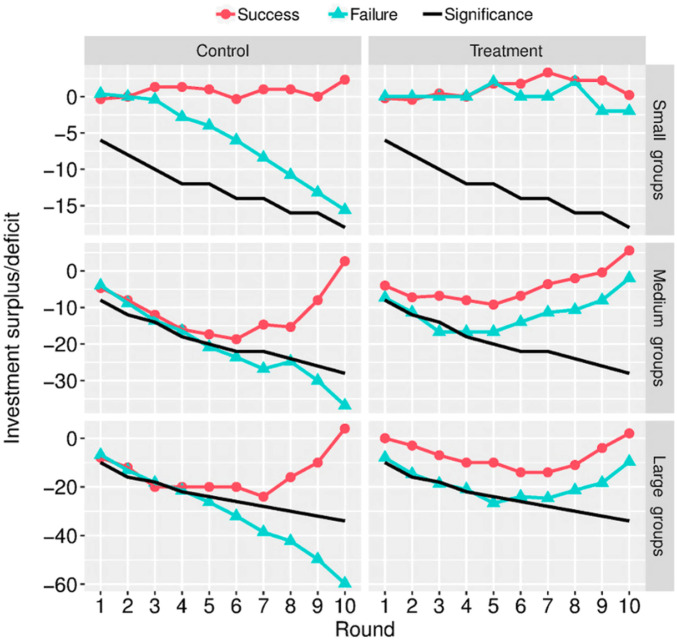
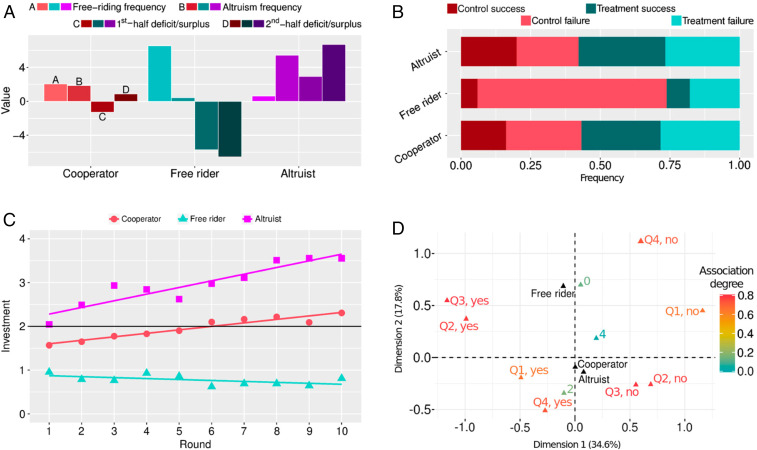
Significance: Collective risks trigger social dilemmas that require balancing selfish interests and common good. One important example is mitigating climate change, wherein without sufficient investments, worldwide negative consequences become increasingly likely. To study the social aspects of this problem, we organized a game experiment that reveals how group size, communication, and behavioral type drive prosocial action. We find that communicating sentiment and outlook leads to more positive outcomes, even among culturally heterogeneous groups. Although genuine free riders remain unfazed by communication, prosocial players better endure accumulated investment deficits, and thus fight off inaction as the failure looms. This suggests that climate negotiations may achieve more by leveraging existing goodwill than persuading skeptics to act.
Overview
The claims and statistics of this paper haven’t been checked yet.
Run the check — free, no account needed. It reads the open-access text and checks the sources it cites.
Integrity signals
Registry
Cites
Statistics
Figures
Verification
Claims the paper makes
The claims and statistics of this paper haven’t been checked yet.
Run the check — free, no account needed. It reads the open-access text and checks the sources it cites.
Claims other papers make about this one
Each is checked against this paper’s own text: does it say what the citing paper says it does?
In the citing paper
“For example, in multiplayer games, cheap talk14,15 and onymity16 sustain reciprocation”
From Deep reinforcement learning can promote sustainable human behaviour in a common-pool resource problem (2025) · cites this paper as [15]
Self-check
Percentages, sums and reported differences re-computed from the paper’s own numbers.
The self-check needs the paper’s full text.
Citations
Cites
A safe operating space for humanity
Rockström, J., Steffen, W., Noone, K., Persson, Å., Chapin, F. S., Lambin, E. F., Lenton, T. M., Scheffer, M., Folke, C., Schellnhuber, H. J., et al. (2009) · Nature · doi:10.1038/461472a · Cited by 13,333
Self-citationA General Framework for Analyzing Sustainability of Social-Ecological Systems
Ostrom, E. (2009) · Science · doi:10.1126/science.1172133 · Cited by 8,656
(1994) · Cited by 5,513
The Struggle to Govern the Commons
Dietz, T., Ostrom, E., & Stern, P. C. (2003) · Science · doi:10.1126/science.1091015 · Cited by 4,209
The Anthropocene: Are Humans Now Overwhelming the Great Forces of Nature
Steffen, W., Crutzen, P. J., & McNeill, J. R. (2007) · AMBIO: A Journal of the Human Environment · doi:10.1579/0044-7447(2007)36[614:taahno]2.0.co;2 · Cited by 3,487
Trajectories of the Earth System in the Anthropocene
Steffen, W., Rockström, J., Richardson, K., Lenton, T. M., Folke, C., Liverman, D., Summerhayes, C. P., Barnosky, A. D., Cornell, S. E., Crucifix, M., et al. (2018) · Proceedings of the National Academy of Sciences · doi:10.1073/pnas.1810141115 · Cited by 3,139 · cited 1×
“Since the Industrial Age, human environmental impacts have become so widespread that we are now in the Anthropocene geological era (1) and, more alarmingly, in the process of exceeding key boundaries of the planetary climate system (2, 3).”
BackgroundSelf-citationAre people conditionally cooperative? Evidence from a public goods experiment
Fischbacher, U., Gächter, S., & Fehr, E. (2001) · Economics Letters · doi:10.1016/s0165-1765(01)00394-9 · Cited by 2,780
Covenants with and without a Sword: Self-Governance Is Possible
Elinor Ostrom, B., Walker, J. M., & Gardner, R. (1992) · American Political Science Review · doi:10.2307/1964229 · Cited by 2,066
oTree - An Open-Source Platform for Laboratory, Online, and Field Experiments
Chen, D. L., Schonger, M., & Wickens, C. D. (2016) · Journal of Behavioral and Experimental Finance · doi:10.1016/j.jbef.2015.12.001 · Cited by 1,981
The Extent and Consequences of P-Hacking in Science
Head, M. L., Holman, L., Lanfear, R., Kahn, A. T., & Jennions, M. D. (2015) · PLOS Biology · doi:10.1371/journal.pbio.1002106 · Cited by 1,388 · cited 1×
“Appendix to avoid spurious results (31).”
Cited by
Sorted by citations
Xia, C., Wang, J., Perc, M., & Wang, Z. (2023) · Physics of Life Reviews · doi:10.1016/j.plrev.2023.05.002 · Cited by 354
Self-citationZhang, Y., Zhao, W., Wang, J., & Yuan, Y. (2024) · Neurocomputing · doi:10.1016/j.neucom.2024.128423 · Cited by 120
Language-based game theory in the age of artificial intelligence
Capraro, V., Paolo, R. D., Perc, M., & Pizziol, V. (2024) · Journal of The Royal Society Interface · doi:10.1098/rsif.2023.0720 · Cited by 97
Self-citationEmergence of Polarized Ideological Opinions in Multidimensional Topic Spaces
Baumann, F., Lorenz-Spreen, P., Sokolov, I. M., & Starnini, M. (2021) · Physical Review X · doi:10.1103/physrevx.11.011012 · Cited by 104
Evolutionary games on simplicial complexes
Guo, H., Jia, D., Sendiña–Nadal, I., Zhang, M., Wang, Z., Li, X., Alfaro-Bittner, K., Moreno, Y., & Boccaletti, S. (2021) · Chaos Solitons & Fractals · doi:10.1016/j.chaos.2021.111103 · Cited by 80
Self-citation
Metadata
- Authors
- Wang, Z., Jusup, M., Guo, H., Shi, L., Geček, S., Anand, M., Perc, M., Bauch, C. T., Kurths, J., Boccaletti, S., & Schellnhuber, H. J.
- Affiliations
- Northwestern Polytechnical University (CN)
- Tokyo Institute of Technology (JP)
- Statistics and Mathematics College, Yunnan University of Finance and Economics, Kunming 650221, China;
- Ruđer Bošković Institute (HR)
- University of Guelph (CA)
- China Medical University (TW)
- University of Waterloo (CA)
- Potsdam Institute for Climate Impact Research (DE)
- Moscow Institute of Physics and Technology (RU)
- Corresponding author
- Wang, Zhen
- Jusup, Marko
- Schellnhuber, Hans Joachim
- ORCID
- Venue
- Proceedings of the National Academy of Sciences
- Publisher
- National Academy of Sciences
- Published
- 2020-07-15
- Volume
- 117
- Issue
- 30
- Pages
- 17650-17655
- ISSN
- 0027-8424 (ISSN-L)
- 1091-6490
- PMC
- PMC7395434
- OpenAlex
- W3042961264
- Cited by
- 185
- References
- 33
- Citations by year
- 2026: 21 · 2025: 39 · 2024: 66 · 2023: 28 · 2022: 13 · 2021: 17 · 2020: 1
- FWCI
- 20.07
- Type
- journal article
- Language
- en
- Open access
- hybrid
- doi.org
- Licence
- Locations
- Proceedings of the National Academy of Sciences (publishedVersion, cc-by)
- PubMed Central (publishedVersion, cc-by)
- PubMed (publishedVersion)
- University of Maribor digital library (University of Maribor) (submittedVersion, cc-by)
- Institutional Repository of the Ruđer Bošković Institute (Ruđer Bošković Institute) (submittedVersion, cc-by)
- RENATE (submittedVersion, cc-by-nc-nd)
- Publication Database PIK (Potsdam Institute for Climate Impact Research (PIK)) (submittedVersion, cc-by)
- RENATE (cc-by)
- Funders
- National Natural Science Foundation of China (31700393, 81961138010, 11931015, 11671348, U1803263)
- Javna Agencija za Raziskovalno Dejavnost RS (J4-9302, P1-0403, J1-9112)
- Hrvatska Zaklada za Znanost (#IP-2018-01-3150-AqADAPT, IP-2018, IP-2018-01-3150, -2018-01-3150, IP-2018-01)
- Fundamental Research Funds for the Central Universities (3102019PJ006, U1803263, 81961138010)
- Topics
- Social Sciences › Economics, Econometrics and Finance › Economics and Econometrics › Experimental Behavioral Economics Studies
- Social Sciences › Sociology and Political Science › Evolutionary Game Theory and Cooperation
- Social Sciences › Economics, Econometrics and Finance › Economics and Econometrics › Climate Change Policy and Economics
- Keywords
- collective action, free-riding, climate change mitigation, social dilemmas, investment behavior, group size, behavioral types, cooperation, altruism
- MeSH terms
- Behavior, Communication, Humans, Models, Theoretical, Climate Change
About these checks
Registry, retraction, Cites and statistics results are computed, not judged, with one exception: a printed reference that no index lists is read once by a model before it counts as a citation error. Claims are extracted by a model and kept only when their quote appears verbatim in the text; each cited source is then checked, with a model’s help, for whether it says what the claim relies on. Those verdicts can be wrong — read the claim’s quote and the cited source before relying on one.
Statistics and arithmetic are recomputed, not judged.
Confidence bands are shown only for fields calibrated on our annotated test set. None is calibrated yet, so no band is shown.
What counts as a claim ›How we measure confidence ›How we check this ›
Are you an author, or do you see a problem with this page? Request a review
