

The DOI matches its Crossref record; 16 of the 17 references it cites were found in a registry or an index, and 1 are not checked yet.
Demographic perspectives on the mortality of COVID-19 and other epidemics
Open accessAbstract
Significance: What would a hypothetical 1 million US deaths in the COVID-19 epidemic mean for mortality of individuals at the population level? Life expectancy for 2020 would drop by 2.9 y. Those dying would lose an average of 11.7 y of expected remaining life, while for the general population the loss of remaining life would be 0.2 y for elders (at age 80) and much less at younger ages. Mortality per person would be less than that of the Spanish flu, but closer to that of the opioid and HIV/AIDS epidemics, while far more concentrated in time. The standard valuation of averting 1.75 million deaths would be many trillions of dollars.
Overview
The claims and statistics of this paper haven’t been checked yet.
Run the check — free, no account needed. It reads the open-access text and checks the sources it cites.
Integrity signals
Registry
Cites
Statistics
Figures
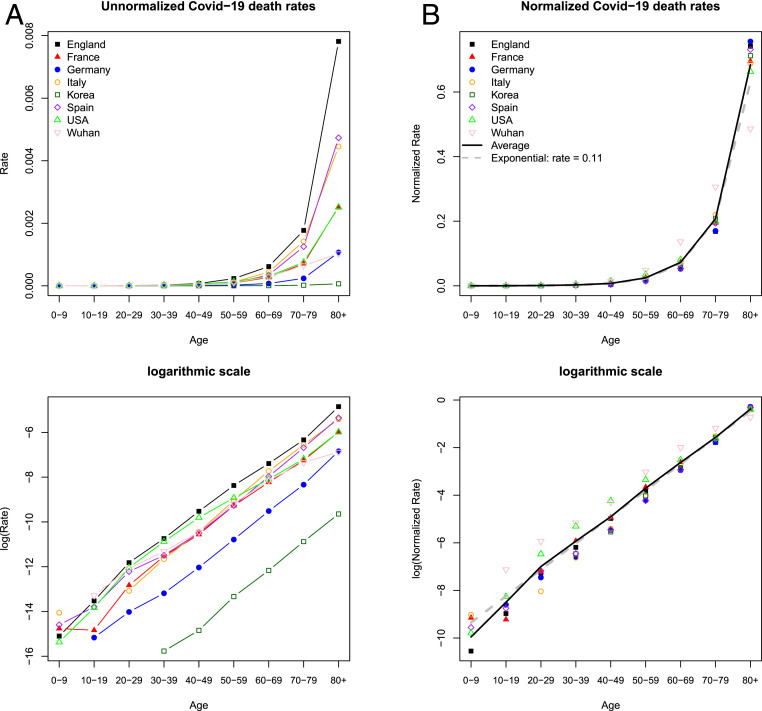
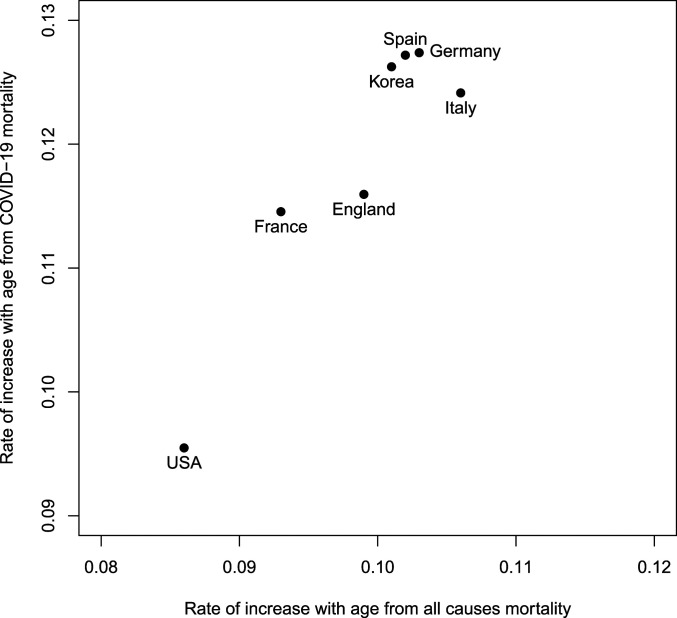
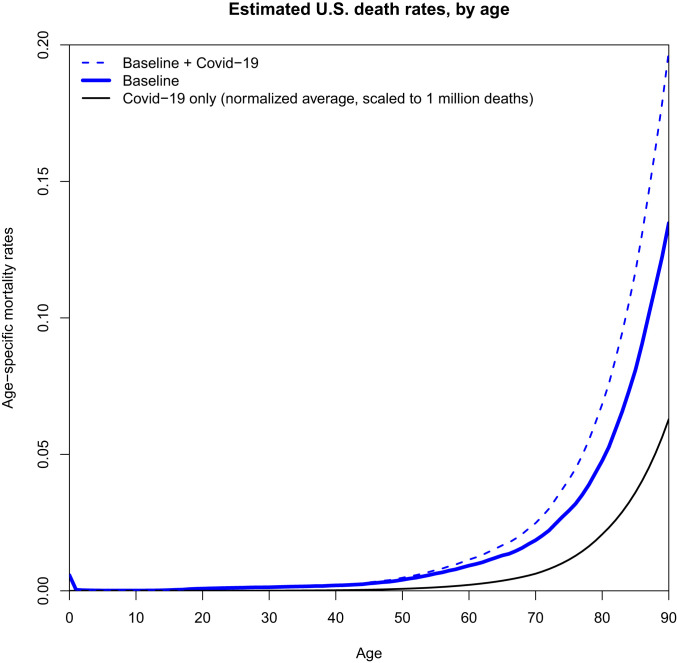
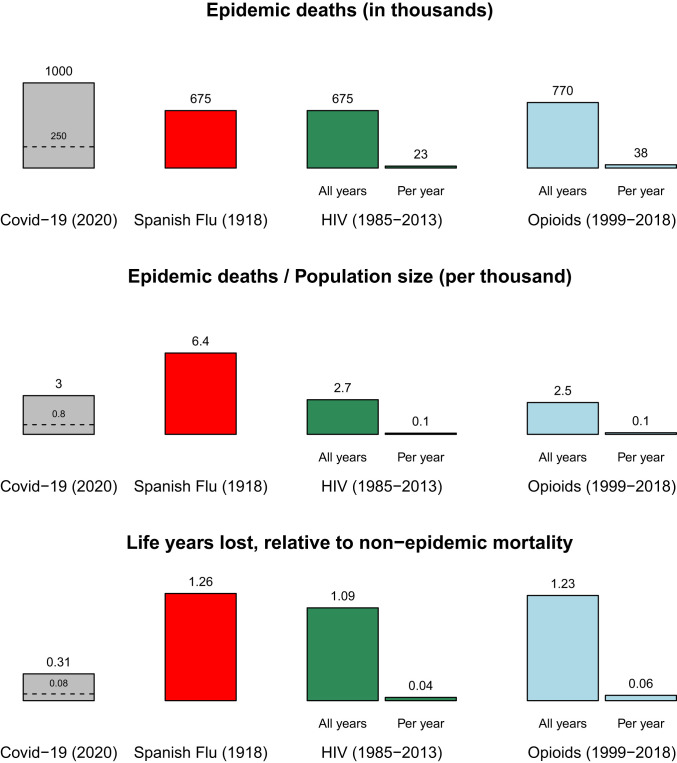
Verification
Claims the paper makes
The claims and statistics of this paper haven’t been checked yet.
Run the check — free, no account needed. It reads the open-access text and checks the sources it cites.
Claims other papers make about this one
Each is checked against this paper’s own text: does it say what the citing paper says it does?
The source backs part of the claim, not all of it — or backs it for a different population, condition or comparison.
In the citing paper
“The Covid‐19 pandemic has compressed deaths in a short time span compared to other epidemics of the posttransitional world (Goldstein and Lee 2020)”
From Demography: Fast and Slow (2022) · cites this paper as Goldstein and Lee 2020
Experimental — accuracy not yet measuredIn the citing paper
“Because the risk of severe disease and death from COVID-19 increases exponentially with age,189 it is not surprising that Africa—and sub-Saharan Africa in particular—has recorded relatively fewer deaths, despite very limited containment policies and generally inadequate health systems.”
From The Lancet Commission on lessons for the future from the COVID-19 pandemic (2022) · cites this paper as [189]
Self-check
Percentages, sums and reported differences re-computed from the paper’s own numbers.
The self-check needs the paper’s full text.
Citations
Cites
Ferguson, N. M., Laydon, D. J., Nedjati-Gilani, G. L., Imai, N., Ainslie, K. E. C., Baguelin, M., Bhatia, S., Boonyasiri, A., Cucunubá, Z. M., Cuomo-Dannenburg, G., et al. (2020) · Spiral (Imperial College London) · doi:10.25561/77482 · Cited by 3,619
CDC Weekly, C., & The Novel Coronavirus Pneumonia Emergency Response Epidemiology Team (2020) · China CDC Weekly · doi:10.46234/ccdcw2020.032 · Cited by 2,889
The Novel Coronavirus Pneumonia Emergency Response Epidemiology Team (2020) · PubMed · Cited by 1,277
The Macroeconomics of Epidemics
Eichenbaum, M., Rebelo, S. T., & Trabandt, M. (2020) · National Bureau of Economic Research · doi:10.3386/w26882 · Cited by 950
Eubank, S., Eckstrand, I. A., Lewis, B. L., Venkatramanan, S., MARATHE, M. V., & Barrett, C. L. (2020) · Bulletin of Mathematical Biology · doi:10.1007/s11538-020-00726-x · Cited by 882
Pandemics Depress the Economy, Public Health Interventions Do Not: Evidence from the 1918 Flu
Correia, S., Luck, S., & Verner, E. (2020) · The Journal of Economic History · doi:10.1017/s0022050722000407 · Cited by 528
Pandemics Depress the Economy, Public Health Interventions Do Not: Evidence from the 1918 FluPreprint
Correia, S., Luck, S., & Verner, E. (2020) · SSRN Electronic Journal · doi:10.2139/ssrn.3561560 · Cited by 437
Edwards, R. D., & Tuljapurkar, S. D. (2005) · Population and Development Review · doi:10.1111/j.1728-4457.2005.00092.x · Cited by 309
Dynamics of life expectancy and life span equality
Aburto, J. M., Villavicencio, F., Basellini, U., Kjærgaard, S., & Vaupel, J. W. (2020) · Proceedings of the National Academy of Sciences · doi:10.1073/pnas.1915884117 · Cited by 254
Research works printed but not linked: 1
- Institute for Clinical and Economic Review 2020-2023 value assessment framework. https://icer-review.org/wp-content/uploads/2019/05/ICER_2020_2023_VAF_013120-4.pdf. Accessed 31 March 2020.
Cited by
Sorted by citations
A literature review of the economics of COVID-19
Brodeur, A., Gray, D., Islam, A., & Bhuiyan, S. (2021) · Journal of Economic Surveys · doi:10.1111/joes.12423 · Cited by 976
The Lancet Commission on lessons for the future from the COVID-19 pandemic
Sachs, J. D., Karim, S. S. A., Aknin, L., Allen, J., Brosbøl, K., Colombo, F., Barron, G. C., Espinosa, M. F., Gaspar, V., Gaviria, A., et al. (2022) · The Lancet · doi:10.1016/s0140-6736(22)01585-9 · Cited by 842
Aburto, J. M., Schöley, J., Kashnitsky, I., Zhang, L., Rahal, C., Missov, T. I., Mills, M. C., Dowd, J. B., & Kashyap, R. (2022) · International Journal of Epidemiology · doi:10.1093/ije/dyab207 · Cited by 531
The COVID-19 pandemic and human fertility
Aassve, A., Cavalli, N., Mencarini, L., Plach, S., & Bacci, M. L. (2020) · Science · doi:10.1126/science.abc9520 · Cited by 274
Mahamat‐Saleh, Y., Fiolet, T., Rebeaud, M. E., Mulot, M., Guihur, A., Fatouhi, D. E., Laouali, N., Peiffer‐Smadja, N., Aune, D., & Severi, G. (2021) · BMJ Open · doi:10.1136/bmjopen-2021-052777 · Cited by 205
Metadata
- Authors
- Goldstein, J. R., & Lee, R. D.
- Affiliations
- University of California, Berkeley (US)
- Corresponding author
- Goldstein, Joshua R.
- Lee, Ronald D.
- Venue
- Proceedings of the National Academy of Sciences
- Publisher
- National Academy of Sciences
- Published
- 2020-08-20
- Volume
- 117
- Issue
- 36
- Pages
- 22035-22041
- ISSN
- 0027-8424 (ISSN-L)
- 1091-6490
- PMC
- PMC7486771
- OpenAlex
- W3017550043
- Cited by
- 287
- References
- 16
- Citations by year
- 2026: 8 · 2025: 25 · 2024: 29 · 2023: 38 · 2022: 71 · 2021: 94 · 2020: 22
- FWCI
- 84.79
- Type
- journal article
- Language
- en
- Update notices
- correction (2020-11-02)
- Open access
- hybrid
- doi.org
- Licence
- Locations
- Proceedings of the National Academy of Sciences (publishedVersion, cc-by-nc-nd)
- PubMed Central (publishedVersion, cc-by-nc-nd)
- PubMed (publishedVersion)
- eScholarship (California Digital Library) (submittedVersion, cc-by-nc-nd)
- Funders
- HHS | NIH | National Institute on Aging (5P30AG012839, R01AG058940)
- HHS | NIH | Eunice Kennedy Shriver National Institute of Child Health and Human Development (P2CHD072964)
- Topics
- Social Sciences › Demography › Insurance, Mortality, Demography, Risk Management
- Physical Sciences › Mathematics › Modeling and Simulation › COVID-19 epidemiological studies
- Health Sciences › Medicine › Epidemiology › Healthcare Systems and Public Health
- Keywords
- COVID-19 mortality, age-specific mortality, period life expectancy, years of life lost, HIV/AIDS epidemic, opioid overdose epidemic, 1918 influenza pandemic, all-cause mortality
- MeSH terms
- Betacoronavirus, COVID-19, SARS-CoV-2, Demography, Humans, Life Expectancy, Mortality, Pneumonia, Viral, United States, Cost of Illness, Coronavirus Infections, History, 20th Century, History, 21st Century, Epidemics, Pandemics
About these checks
Registry, retraction, Cites and statistics results are computed, not judged, with one exception: a printed reference that no index lists is read once by a model before it counts as a citation error. Claims are extracted by a model and kept only when their quote appears verbatim in the text; each cited source is then checked, with a model’s help, for whether it says what the claim relies on. Those verdicts can be wrong — read the claim’s quote and the cited source before relying on one.
Statistics and arithmetic are recomputed, not judged.
Confidence bands are shown only for fields calibrated on our annotated test set. None is calibrated yet, so no band is shown.
What counts as a claim ›How we measure confidence ›How we check this ›
Are you an author, or do you see a problem with this page? Request a review
