

The DOI matches its Crossref record; 83 of the 85 references it cites were found in a registry or an index.
Secreted β-Amyloid Precursor Protein Counteracts the Proapoptotic Action of Mutant Presenilin-1 by Activation of NF-κB and Stabilization of Calcium Homeostasis
Open accessAbstract
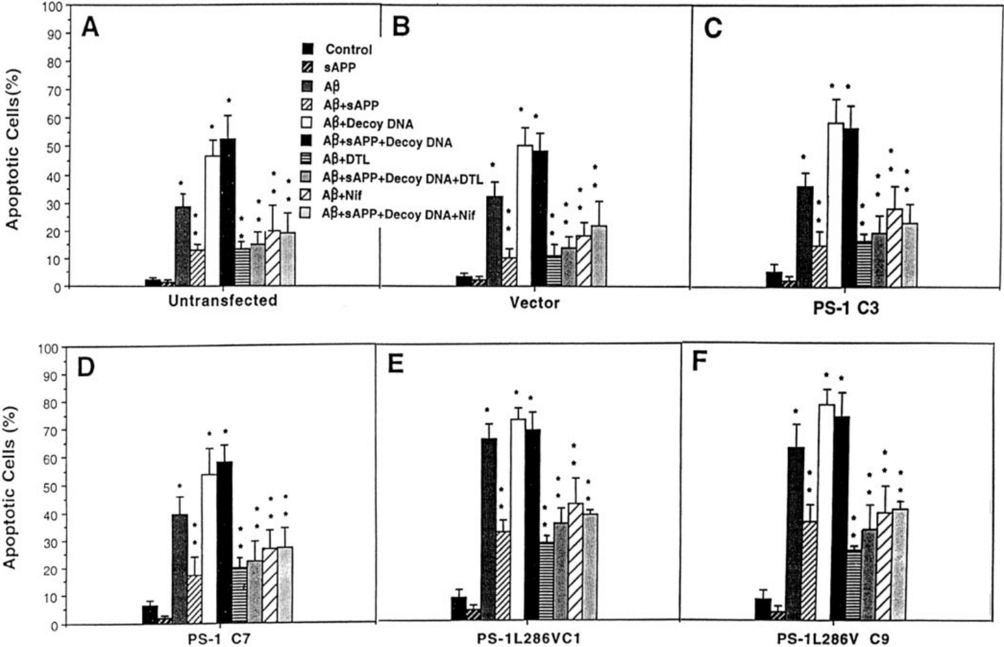
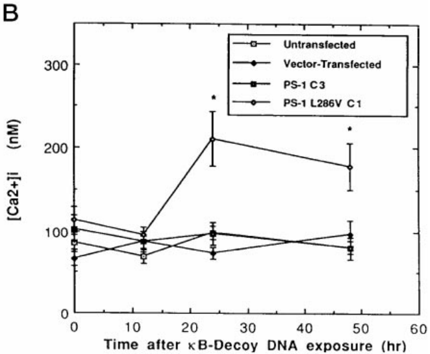
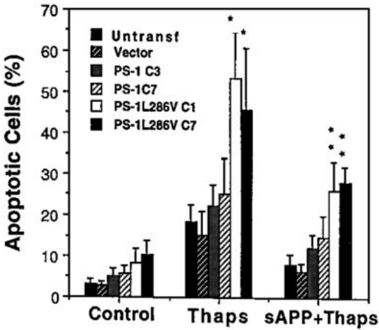
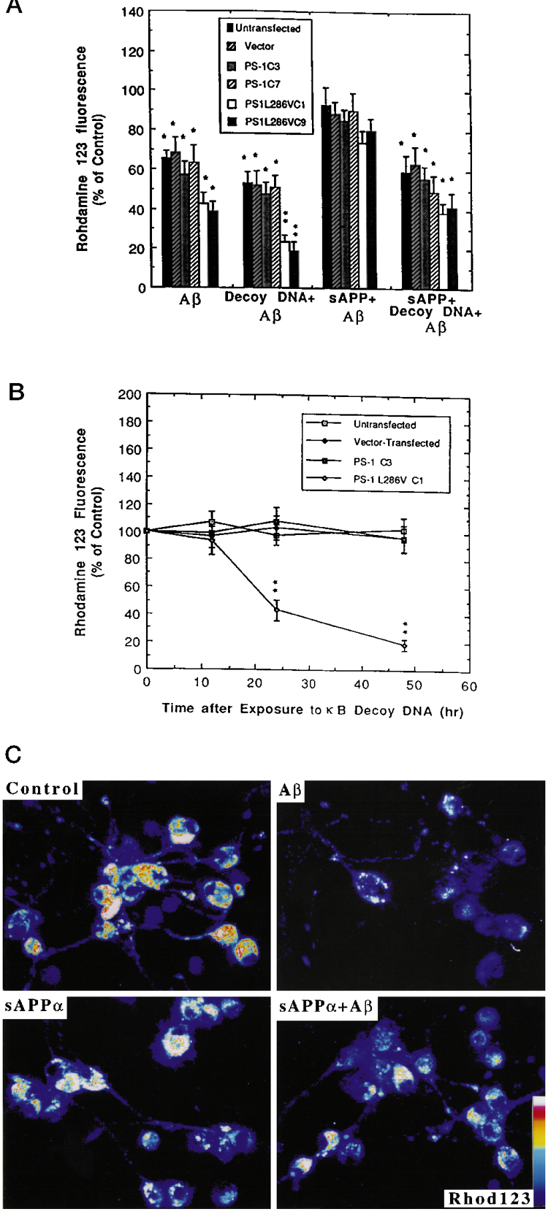
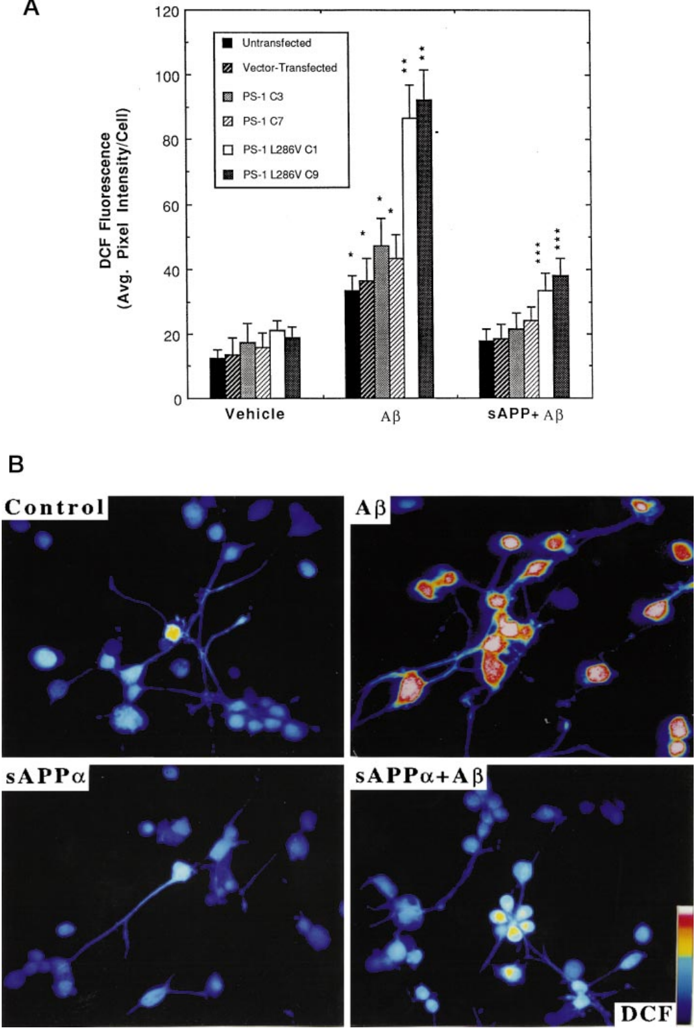
Mutations in the presenilin-1 (PS-1) gene account for approximately 50% of the cases of autosomal dominant, early onset, inherited forms of Alzheimer's disease (AD). PS-1 is an integral membrane protein expressed in neurons and is localized primarily in the endoplasmic reticulum (ER). PS-1 mutations may promote neuronal degeneration by altering the processing of the beta-amyloid precursor protein (APP) and/or by engaging apoptotic pathways. Alternative processing of APP in AD may increase production of neurotoxic amyloid beta-peptide (Abeta) and reduce production of the neuroprotective alpha-secretase-derived form of APP (sAPPalpha). In differentiated PC12 cells expressing an AD-linked PS-1 mutation (L286V), sAPPalpha activated the transcription factor NF-kappaB and prevented apoptosis induced by Abeta. Treatment of cells with kappaB decoy DNA blocked the antiapoptotic action of sAPPalpha, demonstrating the requirement for NF-kappaB activation in the cytoprotective action of sAPPalpha. Cells expressing mutant PS-1 exhibited an aberrant pattern of NF-kappaB activity following exposure to Abeta, which was characterized by enhanced early activation of NF-kappaB followed by a prolonged depression of activity. Blockade of NF-kappaB activity in cells expressing mutant PS-1 by kappaB decoy DNA was associated with enhanced Abeta-induced increases of [Ca2+]i and mitochondrial dysfunction. Treatment of cells with sAPPalpha stabilized [Ca2+]i and mitochondrial function and suppressed oxidative stress by a mechanism involving activation of NF-kappaB. Blockade of ER calcium release prevented (and stimulation of ER calcium release by thapsigargin induced) apoptosis in cells expressing mutant PS-1, suggesting a pivotal role for ER calcium release in the proapoptotic action of mutant PS-1. Finally, a role for NF-kappaB in preventing apoptosis induced by ER calcium release was demonstrated by data showing that sAPPalpha prevents thapsigargin-induced apoptosis, an effect blocked by kappaB decoy DNA. We conclude that sAPPalpha stabilizes cellular calcium homeostasis and protects neural cells against the proapoptotic action of mutant PS-1 by a mechanism involving activation of NF-kappaB. The data further suggest that PS-1 mutations result in aberrant NF-kappaB regulation that may render neurons vulnerable to apoptosis.
Overview
The claims and statistics of this paper haven’t been checked yet.
Run the check — free, no account needed. It reads the open-access text and checks the sources it cites.
Integrity signals
Registry
Cites
Statistics
Figures
Verification
Claims the paper makes
The claims and statistics of this paper haven’t been checked yet.
Run the check — free, no account needed. It reads the open-access text and checks the sources it cites.
Claims other papers make about this one
Each is checked against this paper’s own text: does it say what the citing paper says it does?
In the citing paper
“These analyses indicated significant Aβ42-mediated upregulation in the expression of a family of genes encoding the cytokines IL-1β, CEX-1, and TNF-α, COX-2, B94, and the proapoptotic Bax and Bik proteins (Guo et al., 1998; Metcalfe et al., 2004; Tarte et al., 2004).”
From Docosanoids and elovanoids from omega-3 fatty acids are pro-homeostatic modulators of inflammatory responses, cell damage and neuroprotection (2018) · cites this paper as Guo et al., 1998
In the citing paper
“The amyloid plaque of AD shows Aβ40/Aβ42 enriched ratio (Guo et al., 1998; Selkoe and Kopan, 2003)”
From Docosanoids and elovanoids from omega-3 fatty acids are pro-homeostatic modulators of inflammatory responses, cell damage and neuroprotection (2018) · cites this paper as Guo et al., 1998
In the citing paper
“sAPPα promotes neuritogenesis and long-term survival of neurons in culture and protects brain cells against the toxicity of Aβ40 and Aβ42 peptides and excitotoxic and ischemic injury both in cell cultures and in vivo (Guo et al., 1998; Stein and Johnson, 2003).”
From Docosanoids and elovanoids from omega-3 fatty acids are pro-homeostatic modulators of inflammatory responses, cell damage and neuroprotection (2018) · cites this paper as Guo et al., 1998
In the citing paper
“sAPPα also protect neural cells against the proapoptotic thapsigargin, an inhibitor of the endoplasmic reticulum Ca2+-ATPase, and the adverse effect of thapsigargin can be abolished in cells overexpressing antiapoptotic Bcl-2 (Guo et al., 1998).”
From Docosanoids and elovanoids from omega-3 fatty acids are pro-homeostatic modulators of inflammatory responses, cell damage and neuroprotection (2018) · cites this paper as Guo et al., 1998
In the citing paper
“Furthermore, NPD1 biosynthesis is enhanced by the neurotrophic peptide sAPPα, a 612-amino acid fragment derived from α-secretase-mediated cleavage of βAPP (Guo et al., 1998; Selkoe and Kopan, 2003).”
From Docosanoids and elovanoids from omega-3 fatty acids are pro-homeostatic modulators of inflammatory responses, cell damage and neuroprotection (2018) · cites this paper as Guo et al., 1998
Self-check
Percentages, sums and reported differences re-computed from the paper’s own numbers.
The self-check needs the paper’s full text.
Citations
Cites
Cloning of a gene bearing missense mutations in early-onset familial Alzheimer's disease
Sherrington, R., Rogaev, E. I., Liang, Y., Rogaeva, E. A., Levesque, G., Ikeda, M., Chi, H., Lin, C., Li, G., Holman, K., et al. (1995) · Nature · doi:10.1038/375754a0 · Cited by 4,051
An Essential Role for NF-κB in Preventing TNF-α-Induced Cell Death
Beg, A. A., & Baltimore, D. (1996) · Science · doi:10.1126/science.274.5288.782 · Cited by 3,047
Scheuner, D., Eckman, C., Jensen, M., Song, X., Citron, M., Suzuki, N., Bird, T. D., Hardy, J., Hutton, M., Kukull, W., et al. (1996) · Nature Medicine · doi:10.1038/nm0896-864 · Cited by 2,599
Suppression of TNF-α-Induced Apoptosis by NF-κB
Antwerp, D. J. V., Martin, S. J., Kafri, T., Green, D. R., & Verma, I. M. (1996) · Science · doi:10.1126/science.274.5288.787 · Cited by 2,581
Oxidative stress hypothesis in Alzheimer’s disease
Markesbery, W. R. (1997) · Free Radical Biology and Medicine · doi:10.1016/s0891-5849(96)00629-6 · Cited by 2,383
Hydrogen peroxide mediates amyloid β protein toxicity
Behl, C. (1994) · Cell · doi:10.1016/0092-8674(94)90131-7 · Cited by 2,074
Differential activation of transcription factors induced by Ca2+ response amplitude and duration
Dolmetsch, R. E., Lewis, R. S., Goodnow, C. C., & Healy, J. I. (1997) · Nature · doi:10.1038/386855a0 · Cited by 1,763
Mattson, M. P., Cheng, B., Davis, D. G., Bryant, K., Lieberburg, I. M., & Rydel, R. E. (1992) · Journal of Neuroscience · doi:10.1523/jneurosci.12-02-00376.1992 · Cited by 1,633
Self-citationDifferential activation of transcription factors induced by Ca2+ response amplitude and duration
Dolmetsch, R. E., Lewis, R. S., Goodnow, C. C., & Healy, J. I. (1997) · Nature · doi:10.1038/40912 · Cited by 1,521
Increased amyloid-β42(43) in brains of mice expressing mutant presenilin 1
Duff, K., Eckman, C., Zehr, C., Yu, X., Prada, C.-M., Pérez‐Tur, J., Hutton, M., Buée, L., Harigaya, Y., Yager, D., et al. (1996) · Nature · doi:10.1038/383710a0 · Cited by 1,486
Research works printed but not linked: 4
- Cribbs, 1996, Am. J. Pathol., 148, 1797
- Murphy, 1996, Am. J. Pathol., 149, 1839
- Giannakopoulos, 1997, Am. J. Pathol., 150, 429
- Marin, 1996, Oncogene, 12, 2259
Cited by
Sorted by citations
Control of apoptosis by Rel/NF-κB transcription factors
Barkett, M., & Gilmore, T. D. (1999) · Oncogene · doi:10.1038/sj.onc.1203238 · Cited by 1,202
Korte, S. M., Koolhaas, J. M., Wingfield, J. C., & McEwen, B. S. (2005) · Neuroscience & Biobehavioral Reviews · doi:10.1016/j.neubiorev.2004.08.009 · Cited by 1,097
Calcium dyshomeostasis and intracellular signalling in alzheimer's disease
LaFerla, F. M. (2002) · Nature reviews. Neuroscience · doi:10.1038/nrn960 · Cited by 988
NF-κB in neuronal plasticity and neurodegenerative disorders
Mattson, M. P., & Camandola, S. (2001) · Journal of Clinical Investigation · doi:10.1172/jci11916 · Cited by 877
Self-citationLukiw, W. J. (2005) · Journal of Clinical Investigation · doi:10.1172/jci25420 · Cited by 897
Metadata
- Authors
- Guo, Q., Robinson, N., & Mattson, M. P.
- Affiliations
- University of Kentucky (US)
- Corresponding author
- Mattson, Mark P.
- Venue
- Journal of Biological Chemistry
- Publisher
- Elsevier BV
- Published
- 1998-05
- Volume
- 273
- Issue
- 20
- Pages
- 12341-12351
- ISSN
- 0021-9258 (ISSN-L)
- OpenAlex
- W2055585878
- Cited by
- 196
- References
- 85
- Citations by year
- 2026: 2 · 2022: 2 · 2021: 5 · 2020: 3 · 2019: 3 · 2018: 3 · 2017: 5 · 2016: 7 · 2015: 4 · 2014: 1 · 2013: 5 · 2012: 5
- FWCI
- 13.93
- Type
- journal article
- Language
- en
- Open access
- hybrid
- doi.org
- Licence
- Locations
- Journal of Biological Chemistry (publishedVersion, cc-by)
- PubMed (publishedVersion)
- Funders
- National Institutes of Health (5r01ag014554-07, 5r01ns035253-03, NS35253, AG05144, AG14554)
- National Institute on Aging (P50AG005144, AG14554, AG-05144)
- National Institute of Neurological Disorders and Stroke (NS 35253)
- Topics
- Life Sciences › Neuroscience › Cellular and Molecular Neuroscience › Alzheimer's disease research and treatments
- Life Sciences › Biochemistry, Genetics and Molecular Biology › Cancer Research › NF-κB Signaling Pathways
- Life Sciences › Neuroscience › Neurology › Neuroinflammation and Neurodegeneration Mechanisms
- Keywords
- presenilin 1, amyloid precursor protein, sAPPα, NF-κB, apoptosis, Alzheimer's disease, calcium homeostasis, endoplasmic reticulum calcium release, thapsigargin, mitochondrial dysfunction, oxidative stress, amyloid-beta, PC12 cells
- MeSH terms
- Animals, Calcium, Homeostasis, Humans, Membrane Proteins, Mutation, Amyloid beta-Peptides, NF-kappa B, Amyloid beta-Protein Precursor, PC12 Cells, Apoptosis, Rats, Presenilin-1
About these checks
Registry, retraction, Cites and statistics results are computed, not judged, with one exception: a printed reference that no index lists is read once by a model before it counts as a citation error. Claims are extracted by a model and kept only when their quote appears verbatim in the text; each cited source is then checked, with a model’s help, for whether it says what the claim relies on. Those verdicts can be wrong — read the claim’s quote and the cited source before relying on one.
Statistics and arithmetic are recomputed, not judged.
Confidence bands are shown only for fields calibrated on our annotated test set. None is calibrated yet, so no band is shown.
What counts as a claim ›How we measure confidence ›How we check this ›
Are you an author, or do you see a problem with this page? Request a review
