Student or educator? Sign up with your school email and get 6 months of Pro free.
Cited by 60

The DOI matches its Crossref record; 53 of the 53 references it cites were found in a registry or an index.

ER stress is not elevated in the 5XFAD mouse model of Alzheimer's disease

Sadleir, Katherine R., Popovic, Jelena, Vassar, Robert·2018·Journal of Biological Chemistry

Abstract

Alzheimer's disease mouse models that overexpress amyloid precursor protein (APP) and presenilin 1 (PS1) form β-amyloid (Aβ) plaques, a hallmark Alzheimer's disease lesion. It has been assumed that the neuroinflammation, synaptic dysfunction, neurodegeneration, and cognitive impairment observed in these mice are caused by cerebral Aβ accumulation. However, it is also possible that accumulation of the overexpressed transmembrane proteins APP and PS1 in the endoplasmic reticulum (ER) triggers chronic ER stress and activation of the unfolded protein response (UPR). The 5XFAD mouse, a widely used amyloid pathology model, overexpresses APP and PS1, displays aggressive amyloid pathology, and has been reported to exhibit ER stress. To systematically evaluate whether 5XFAD mice have increased ER stress, here we used biochemical approaches to assess a comprehensive panel of UPR markers. We report that APP and PS1 levels are 1.8- and 1.5-fold, respectively, of those in 5XFAD compared with nontransgenic brains, indicating that transgenes are not massively overexpressed in 5XFAD mice. Using immunoblotting, we quantified UPR protein levels in nontransgenic, 5XFAD, and 5XFAD;BACE1 −/− mice at 4, 6, and 9 months of age. Importantly, we did not observe elevation of the ER stress markers p-eIF2α, ATF4, CHOP, p-IRE1α, or BiP at any age in 5XFAD or 5XFAD;BACE1 −/− compared with nontransgenic mice. Despite lacking Aβ generation, 5XFAD;BACE1 −/− mice still expressed APP and PS1 transgenes, indicating that their overexpression does not cause ER stress. These results reveal the absence of ER stress in 5XFAD mice, suggesting that artifactual phenotypes associated with overexpression-induced ER stress are not a concern in this model.

Overview

The claims and statistics of this paper haven’t been checked yet.

Run the check — free, no account needed. It reads the open-access text and checks the sources it cites.

A few free checks a day · papers already verified open instantly · results are public

Integrity signals

Registry

Crossref · 10.1074/jbc.ra118.005769

Cites

53 of 53 references verified0 citation errors · 0 not checkable

Statistics

Figures

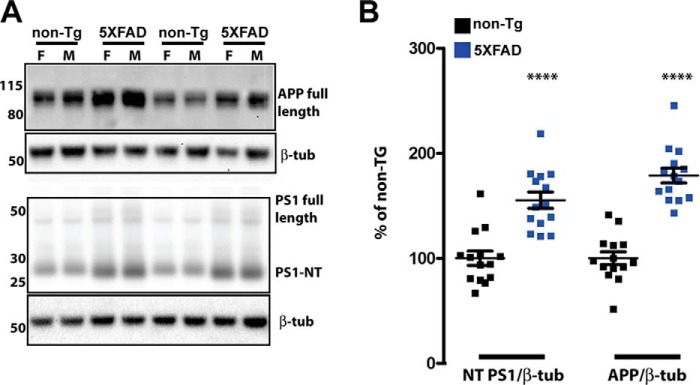
Figure 1. APP and the PS1 N-terminal fragment are increased 0.8- and 0.5-fold compared with the control in 5XFAD mice at 4 months of age. A, representative immunoblots of APP and PS1 in brain homogenates of 5XFAD and non-Tg mice. 20 μg of brain homogenate from non-Tg and 5XFAD mice was separated on a 4–12% BisTris gradient gel, transferred to PVDF, and then incubated with APP or PS1 antibodies that recognize both mouse and human proteins (Table 1). The numbers on left represent molecular mass in kilodaltons. F, female; M, male; β-tub, β3 tubulin. B, quantification of APP and PS1 immunoblot signals described in A, normalized to β3 tubulin and expressed as percentage of the non-Tg control. In 5XFAD mice, total APP is 1.8-fold of total APP in nontransgenic mice, whereas the total PS1 N-terminal fragment is 1.5-fold of that in nontransgenic controls (two-tailed Student's t test, p < 0.0001). n = 9 females and 7 males of each genotype; ****, p < 0.0001 (two-tailed Student's t test); error bars = S.E.
Figure 1. APP and the PS1 N-terminal fragment are increased 0.8- and 0.5-fold compared with the control in 5XFAD mice at 4 months of age. A, representative immunoblots of APP and PS1 in brain homogenates of 5XFAD and non-Tg mice. 20 μg of brain homogenate from non-Tg and 5XFAD mice was separated on a 4–12% BisTris gradient gel, transferred to PVDF, and then incubated with APP or PS1 antibodies that recognize both mouse and human proteins (Table 1). The numbers on left represent molecular mass in kilodaltons. F, female; M, male; β-tub, β3 tubulin. B, quantification of APP and PS1 immunoblot signals described in A, normalized to β3 tubulin and expressed as percentage of the non-Tg control. In 5XFAD mice, total APP is 1.8-fold of total APP in nontransgenic mice, whereas the total PS1 N-terminal fragment is 1.5-fold of that in nontransgenic controls (two-tailed Student's t test, p < 0.0001). n = 9 females and 7 males of each genotype; ****, p < 0.0001 (two-tailed Student's t test); error bars = S.E.CC BY · PubMed Central
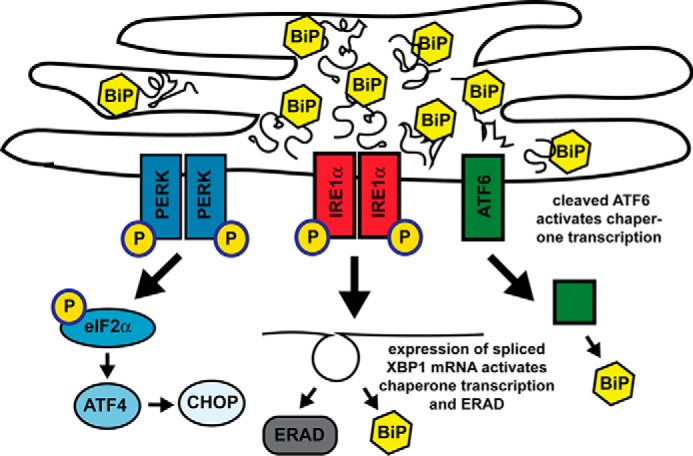
Figure 2. Three arms of ER stress. Shown is a schematic of the ER under conditions of high folding stress, when BiP is fully occupied with folded or misfolded proteins and cannot bind the ER stress sensors PERK, IRE1, and ATF6, causing them to activate the three arms of the UPR. In the first arm, p-PERK phosphorylates eIF2α, decreasing global translation but activating translation of the transcriptional activator ATF4, which induces the transcription factors CHOP and XBP1 and expression of the genes for chaperones, antioxidants, and apoptosis factors. In the second arm, p-IRE1 splices XBP1 mRNA to generate the transcription factor XBP1, which up-regulates the expression of genes for chaperones, lipogenesis, and ER-associated protein degeneration (ERAD) components. In the third arm, ATF6 translocates to the Golgi, where it is cleaved, generating transcription factor ATF6(N), which activates expression of chaperone and XBP1 genes.
Figure 2. Three arms of ER stress. Shown is a schematic of the ER under conditions of high folding stress, when BiP is fully occupied with folded or misfolded proteins and cannot bind the ER stress sensors PERK, IRE1, and ATF6, causing them to activate the three arms of the UPR. In the first arm, p-PERK phosphorylates eIF2α, decreasing global translation but activating translation of the transcriptional activator ATF4, which induces the transcription factors CHOP and XBP1 and expression of the genes for chaperones, antioxidants, and apoptosis factors. In the second arm, p-IRE1 splices XBP1 mRNA to generate the transcription factor XBP1, which up-regulates the expression of genes for chaperones, lipogenesis, and ER-associated protein degeneration (ERAD) components. In the third arm, ATF6 translocates to the Golgi, where it is cleaved, generating transcription factor ATF6(N), which activates expression of chaperone and XBP1 genes.CC BY · PubMed Central
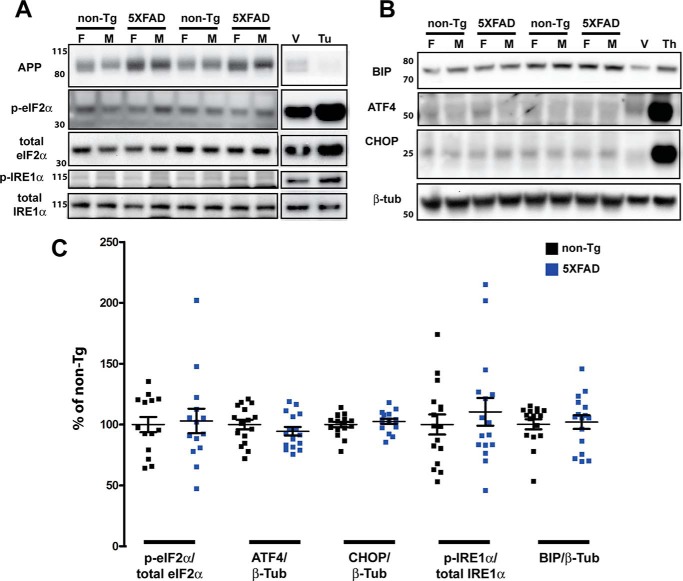
Figure 3. No elevation of UPR at 4 months in 5XFAD compared with nontransgenic mice. A and B, representative immunoblots of 30 μg of brain homogenate (APP, p-eIF2α, and total eIF2α) or 50 μg of brain homogenate (p-IRE1α, total IRE1α, BIP, ATF4, and CHOP) from 4-month-old non-Tg and 5XFAD mice separated on a 4–12% BisTris gradient gel, transferred to PVDF, and then incubated with antibodies recognizing the indicated proteins. To validate the antibodies used to detect induction of the UPR, immunoblots included 10 μg (A) or 20 μg (B) of lysate from murine primary cortical neurons treated with 5 μg/ml tunicamycin (tu) or DMSO vehicle (V) for 5 h (A) or 1 μm thapsigargin (Th) or DMSO vehicle for 24 h (B), in which Bip, CHOP, ATF4, and the phosphorylated forms of eIF2α and IRE1α were increased as expected. APP, which has a short t½ (51), is decreased by tunicamycin because of inhibition of global translation (A). Note that brains from either 5XFAD or non-Tg mice have low levels of UPR induction compared with vehicle-treated primary neurons. The numbers on the left represent molecular mass in kilodaltons. F, female; M, male. C, quantification of the protein immunoblot signals described in A and B, normalized to the indicated control proteins and expressed as percent of the 6-month-old non-Tg level. By two-tailed Student's t test, there is no significant difference between nontransgenic and 5XFAD mice (n = 9 females and 7 males of each genotype) for any protein analyzed. Error bars = S.E.
Figure 3. No elevation of UPR at 4 months in 5XFAD compared with nontransgenic mice. A and B, representative immunoblots of 30 μg of brain homogenate (APP, p-eIF2α, and total eIF2α) or 50 μg of brain homogenate (p-IRE1α, total IRE1α, BIP, ATF4, and CHOP) from 4-month-old non-Tg and 5XFAD mice separated on a 4–12% BisTris gradient gel, transferred to PVDF, and then incubated with antibodies recognizing the indicated proteins. To validate the antibodies used to detect induction of the UPR, immunoblots included 10 μg (A) or 20 μg (B) of lysate from murine primary cortical neurons treated with 5 μg/ml tunicamycin (tu) or DMSO vehicle (V) for 5 h (A) or 1 μm thapsigargin (Th) or DMSO vehicle for 24 h (B), in which Bip, CHOP, ATF4, and the phosphorylated forms of eIF2α and IRE1α were increased as expected. APP, which has a short t½ (51), is decreased by tunicamycin because of inhibition of global translation (A). Note that brains from either 5XFAD or non-Tg mice have low levels of UPR induction compared with vehicle-treated primary neurons. The numbers on the left represent molecular mass in kilodaltons. F, female; M, male. C, quantification of the protein immunoblot signals described in A and B, normalized to the indicated control proteins and expressed as percent of the 6-month-old non-Tg level. By two-tailed Student's t test, there is no significant difference between nontransgenic and 5XFAD mice (n = 9 females and 7 males of each genotype) for any protein analyzed. Error bars = S.E.CC BY · PubMed Central
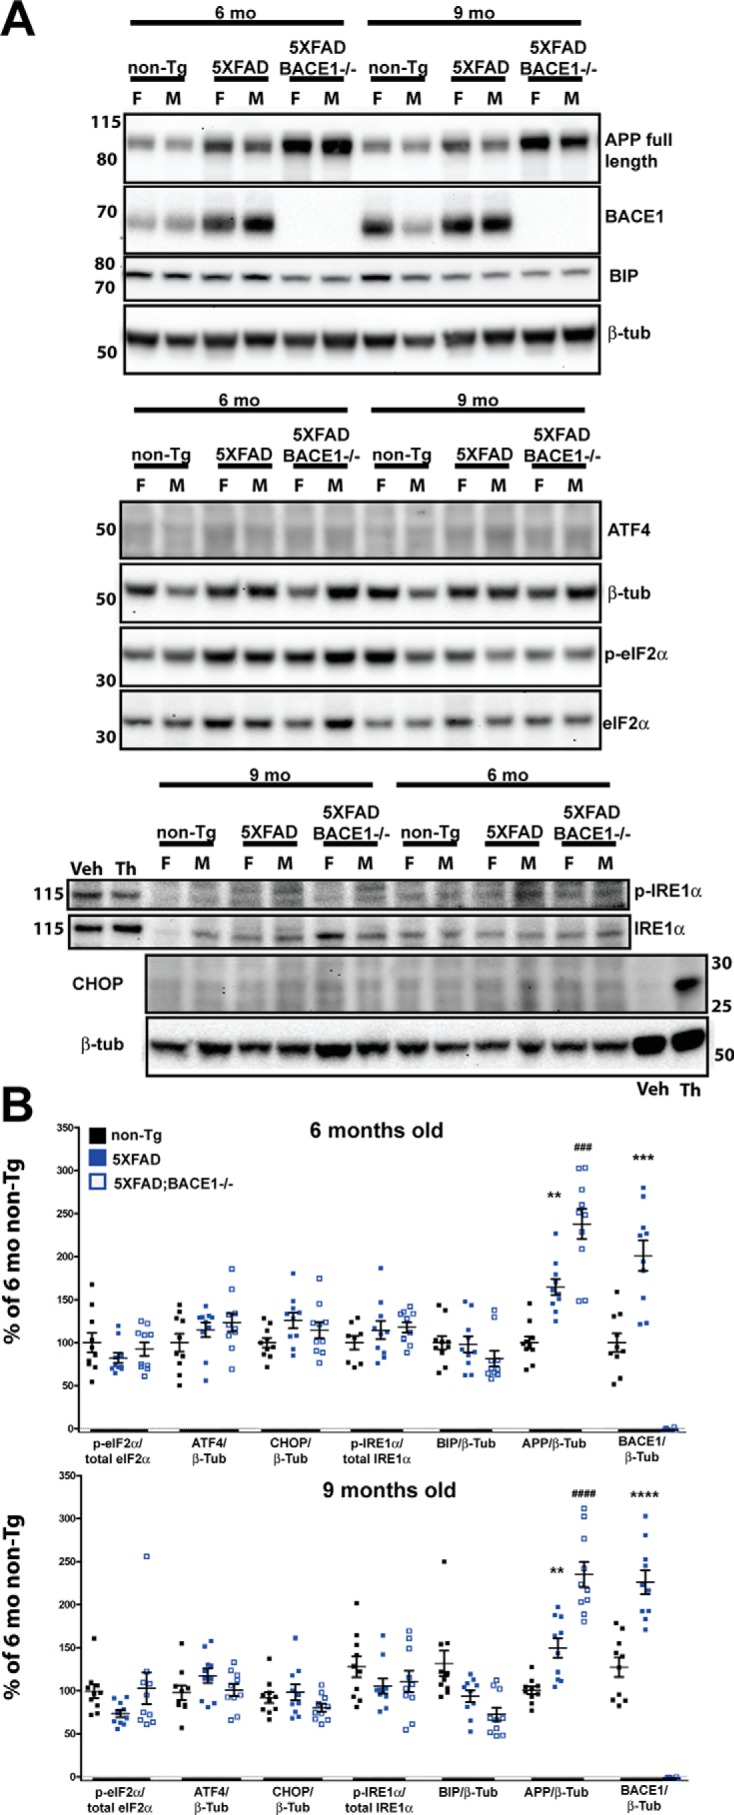
Figure 4. No elevation of UPR at 6 and 9 months in 5XFAD compared with nontransgenic mice. A, representative immunoblots showing 30 μg of brain homogenate (top and center panels) or 50 μg of brain homogenate (bottom panel) from non-Tg, 5XFAD, and 5XFAD;BACE1−/− mice for each age (6 and 9 months) was separated on a 4–12% BisTris gradient gel, transferred to PVDF, and then incubated with antibodies recognizing the indicated proteins. 20 μg of lysate from murine primary cortical neurons treated with 1 μm thapsigargin (Th) or DMSO vehicle (Veh) for 24 h was included in the bottom blot as a positive control for p-IRE1α and CHOP. Immunoblot analysis of APP and BACE1 was included to confirm genotyping. The numbers on the left represent molecular mass in kilodaltons. F, female; M, male. B, quantification of the immunoblot signals described in A, normalized to the indicated control proteins and expressed as percent of the 6-month-old non-Tg level. By ANOVA, there is no significant difference in the levels of any UPR proteins between 5XFAD, 5XFAD;BACE1−/−, and nontransgenic mice (n = 5 females and 5 males of each genotype). In comparison, APP is significantly elevated in 5XFAD mice compared with nontransgenic mice as expected (*) and in 5XFAD;BACE1−/− mice compared with 5XFAD mice (#) because of the loss of BACE1 processing. BACE1 is also significantly elevated in 5XFAD mice compared with nontransgenic mice (*) as expected (28). Note that BACE1 is undetectable in 5XFAD;BACE1−/− mice. These results confirm that our immunoblotting technique can detect significant differences of more than or approximately equal to 1.5-fold. **, p < 0.01; *** and ###, p < 0.001; **** and ####, p < 0.0001. Error bars = S.E.
Figure 4. No elevation of UPR at 6 and 9 months in 5XFAD compared with nontransgenic mice. A, representative immunoblots showing 30 μg of brain homogenate (top and center panels) or 50 μg of brain homogenate (bottom panel) from non-Tg, 5XFAD, and 5XFAD;BACE1−/− mice for each age (6 and 9 months) was separated on a 4–12% BisTris gradient gel, transferred to PVDF, and then incubated with antibodies recognizing the indicated proteins. 20 μg of lysate from murine primary cortical neurons treated with 1 μm thapsigargin (Th) or DMSO vehicle (Veh) for 24 h was included in the bottom blot as a positive control for p-IRE1α and CHOP. Immunoblot analysis of APP and BACE1 was included to confirm genotyping. The numbers on the left represent molecular mass in kilodaltons. F, female; M, male. B, quantification of the immunoblot signals described in A, normalized to the indicated control proteins and expressed as percent of the 6-month-old non-Tg level. By ANOVA, there is no significant difference in the levels of any UPR proteins between 5XFAD, 5XFAD;BACE1−/−, and nontransgenic mice (n = 5 females and 5 males of each genotype). In comparison, APP is significantly elevated in 5XFAD mice compared with nontransgenic mice as expected (*) and in 5XFAD;BACE1−/− mice compared with 5XFAD mice (#) because of the loss of BACE1 processing. BACE1 is also significantly elevated in 5XFAD mice compared with nontransgenic mice (*) as expected (28). Note that BACE1 is undetectable in 5XFAD;BACE1−/− mice. These results confirm that our immunoblotting technique can detect significant differences of more than or approximately equal to 1.5-fold. **, p < 0.01; *** and ###, p < 0.001; **** and ####, p < 0.0001. Error bars = S.E.CC BY · PubMed Central
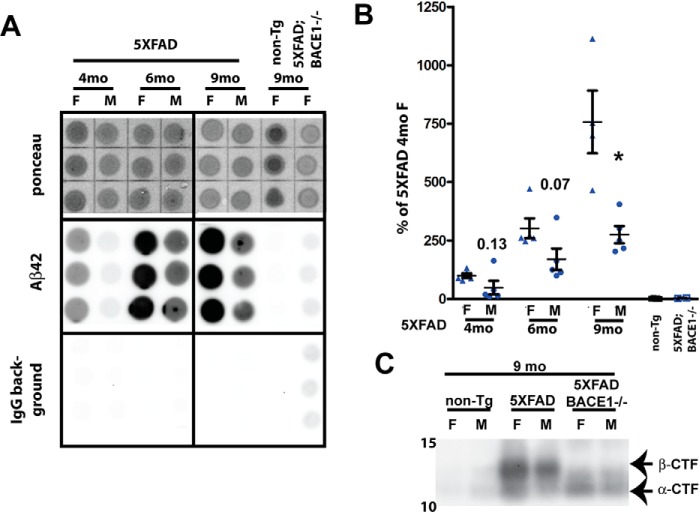
Figure 5. Aβ42 and APP β-CTF are elevated in aged 5XFAD mice but do not induce UPR. A, representative dot blots showing Ponceau staining, the Aβ42 immunosignal, and the IgG secondary background of brain homogenates from 5XFAD (6 and 9 months old) and negative control non-Tg and 5XFAD;BACE1−/− (9 months old) mice extracted in guanidine and 3.9 μg of protein spotted in triplicate on gridded nitrocellulose membranes. Two identical membranes were made. One was incubated with anti-Aβ42 antibody followed by anti-rabbit IgG–horseradish peroxidase secondary antibody, and the other was incubated with secondary antibody only (IgG background). F, female; M, male. B, quantification of Aβ42 dot blot signals described in A. The IgG secondary antibody background was subtracted from the Aβ42 signal, which was then normalized to Ponceau stain intensity and expressed as percentage of the female 5XFAD level at 4 months of age. Aβ42 levels increase over time from 4 to 9 months but, in males, are only ∼40–60% of those in females at a given age, although the difference is significant only at 9 months because of large variation between mice. Numbers represent p values at 4 and 6 months; *, p < 0.05 at 9 months (two-tailed Student's t test). n = 5 females and 5 males for each genotype. Error bars = S.E. C, immunoblot analysis of homogenates from representative brains of 9-month-old mice using antibody Y188 recognizing the C terminus of APP confirms that APP β-CTF, although barely detectable in nontransgenic mice, is elevated in 5XFAD mice and absent from 5XFAD;BACE1−/− mice, which still have notable amounts of APP α-CTF because of α-secretase cleavage.
Figure 5. Aβ42 and APP β-CTF are elevated in aged 5XFAD mice but do not induce UPR. A, representative dot blots showing Ponceau staining, the Aβ42 immunosignal, and the IgG secondary background of brain homogenates from 5XFAD (6 and 9 months old) and negative control non-Tg and 5XFAD;BACE1−/− (9 months old) mice extracted in guanidine and 3.9 μg of protein spotted in triplicate on gridded nitrocellulose membranes. Two identical membranes were made. One was incubated with anti-Aβ42 antibody followed by anti-rabbit IgG–horseradish peroxidase secondary antibody, and the other was incubated with secondary antibody only (IgG background). F, female; M, male. B, quantification of Aβ42 dot blot signals described in A. The IgG secondary antibody background was subtracted from the Aβ42 signal, which was then normalized to Ponceau stain intensity and expressed as percentage of the female 5XFAD level at 4 months of age. Aβ42 levels increase over time from 4 to 9 months but, in males, are only ∼40–60% of those in females at a given age, although the difference is significant only at 9 months because of large variation between mice. Numbers represent p values at 4 and 6 months; *, p < 0.05 at 9 months (two-tailed Student's t test). n = 5 females and 5 males for each genotype. Error bars = S.E. C, immunoblot analysis of homogenates from representative brains of 9-month-old mice using antibody Y188 recognizing the C terminus of APP confirms that APP β-CTF, although barely detectable in nontransgenic mice, is elevated in 5XFAD mice and absent from 5XFAD;BACE1−/− mice, which still have notable amounts of APP α-CTF because of α-secretase cleavage.CC BY · PubMed Central

Verification

Claims the paper makes

The claims and statistics of this paper haven’t been checked yet.

Run the check — free, no account needed. It reads the open-access text and checks the sources it cites.

A few free checks a day · papers already verified open instantly · results are public

Claims other papers make about this one

Each is checked against this paper’s own text: does it say what the citing paper says it does?

Self-check

Percentages, sums and reported differences re-computed from the paper’s own numbers.

The self-check needs the paper’s full text.

Citations

Cites

Show all 53 references

Cited by

Metadata

Authors
Sadleir, K. R., Popovic, J., & Vassar, R.
Venue
Journal of Biological Chemistry
Publisher
Elsevier BV
Published
2018-11
Volume
293
Issue
48
Pages
18434-18443
ISSN
0021-9258
Cited by
60
References
53
Language
en
Licence
Funders
HHS | National Institutes of Health (NIH) (R01 AG030142, R01 AG1022560)

About these checks

Registry, retraction, Cites and statistics results are computed, not judged, with one exception: a printed reference that no index lists is read once by a model before it counts as a citation error. Claims are extracted by a model and kept only when their quote appears verbatim in the text; each cited source is then checked, with a model’s help, for whether it says what the claim relies on. Those verdicts can be wrong — read the claim’s quote and the cited source before relying on one.

Statistics and arithmetic are recomputed, not judged.

Confidence bands are shown only for fields calibrated on our annotated test set. None is calibrated yet, so no band is shown.

What counts as a claim ›How we measure confidence ›How we check this ›

Are you an author, or do you see a problem with this page? Request a review

Data sources

Bibliographic data: Semantic Scholar, OpenAlex, Crossref.

Contains information from the Semantic Scholar Academic Graph Datasets, made available under the ODC Attribution License (ODC-BY 1.0).

Semantic Scholar’s data is described in: Kinney, R., et al. (2023). The Semantic Scholar Open Data Platform. arXiv:2301.10140.