

The DOI matches its Crossref record; 41 of the 41 references it cites were found in a registry or an index.
Women in Antiquity: An Analysis of Gender and Publishing in a Global Archaeology Journal
Abstract
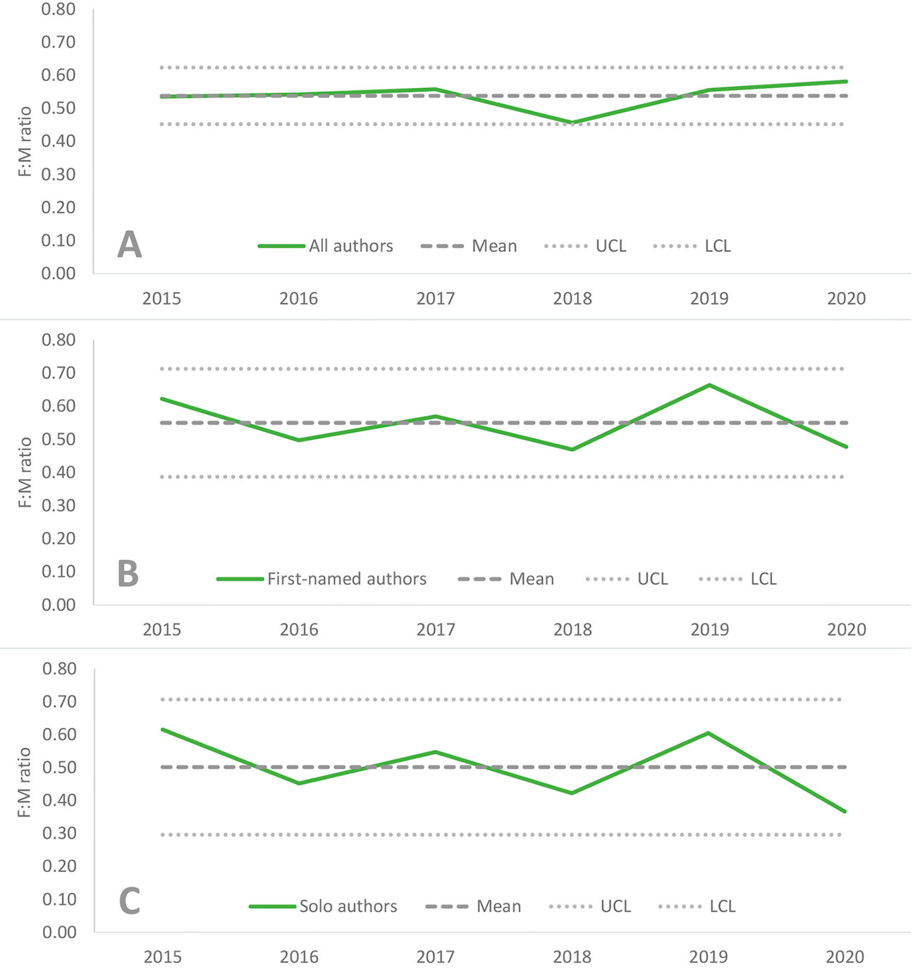
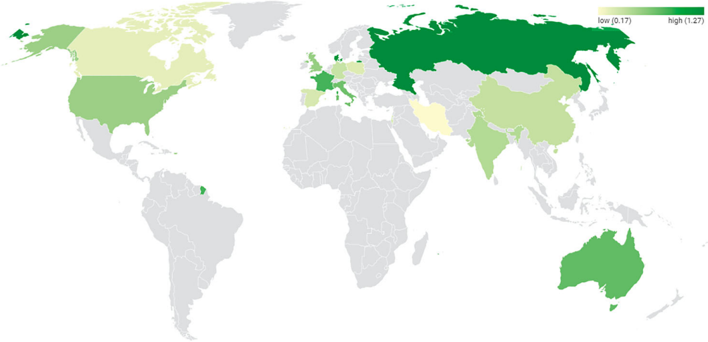
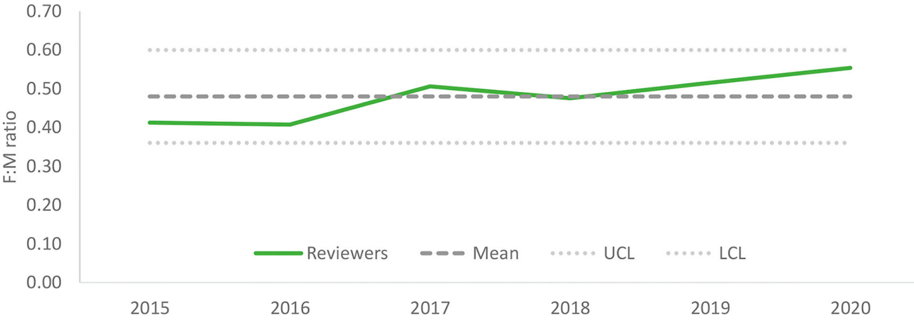
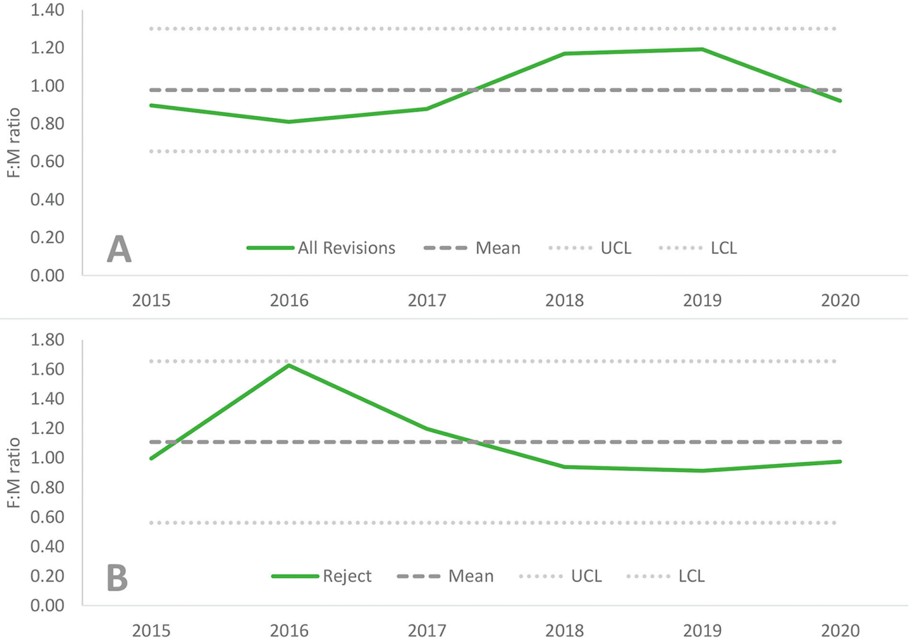
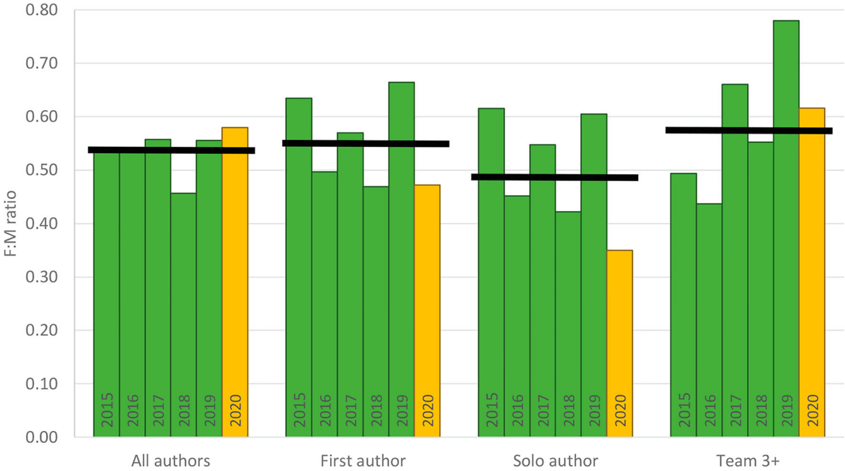
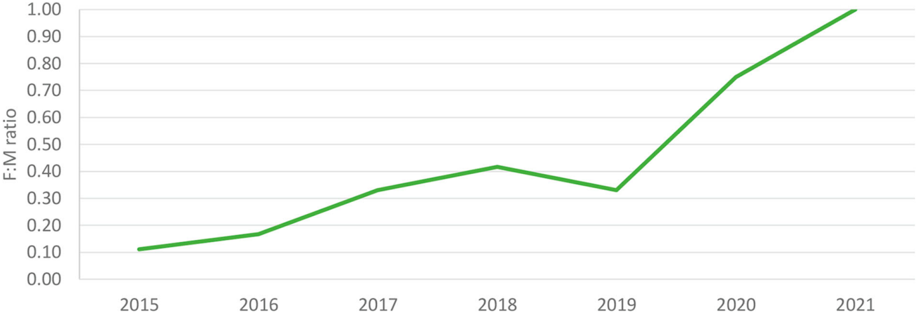
Studies of archaeology publishing demonstrate a persistent imbalance in the ratio of male and female authors. We present an analysis of the world archaeology journal Antiquity using submissions and editorial decisions data (2015–2020). We identify a recurrent ratio of one female for every two male authors across measures including all listed authors, solo and first-named authors, and team authorship. Disaggregating author gender by country and region of corresponding author, however, reveals substantial variation, opening a new avenue for understanding of global trends in archaeology publishing. We also assess peer review and editorial decision-making in relation to author gender, finding no evidence of bias and, using the 2020 data, we look for any potential gendered impact of Covid-19, finding solo female authors may have been more affected than those working in teams. We contextualize the results in relation to initiatives to diversify authorship, including capacity-building programs for early career researchers.
Overview
The claims and statistics of this paper haven’t been checked yet.
Run the check — free, no account needed. It reads the open-access text and checks the sources it cites.
Integrity signals
Registry
Cites
Statistics
Figures


Verification
Claims the paper makes
The claims and statistics of this paper haven’t been checked yet.
Run the check — free, no account needed. It reads the open-access text and checks the sources it cites.
Claims other papers make about this one
Each is checked against this paper’s own text: does it say what the citing paper says it does?
In the citing paper
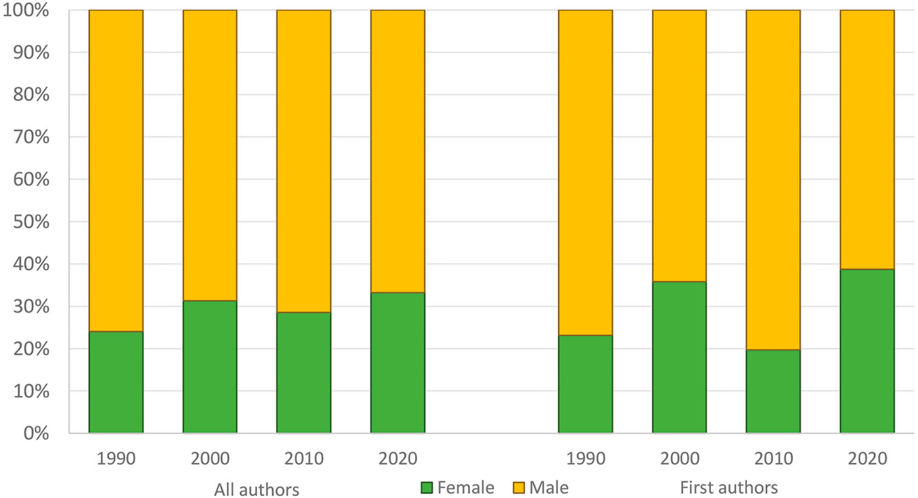
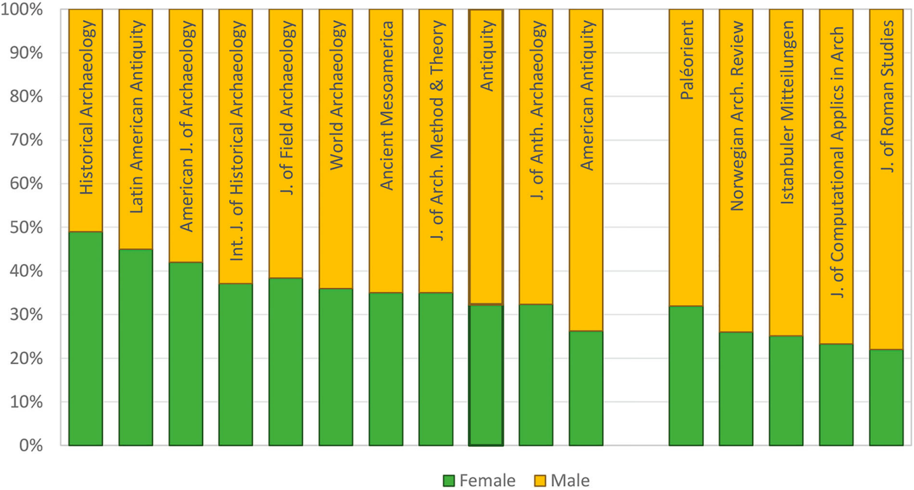
“Unfortunately, these rates parallel the gender disparities observed in other archaeological journals where female authorship has, with few exceptions, remained around 20-40% over the past four decades (see Fig. 2 in Hanscam & Witcher, 2023).”
From The African Archaeological Review Turns Forty: Some Reflections on the Past, Present, and Future (2023) · cites this paper as Hanscam & Witcher, 2023
Self-check
Percentages, sums and reported differences re-computed from the paper’s own numbers.
The self-check needs the paper’s full text.
Citations
Cites
Engendering Archaeology: Women and Prehistory
Dyson, S. L., Gero, J. M., & Conkey, M. W. (1992) · Journal of Interdisciplinary History · doi:10.2307/205279 · Cited by 1,073
The unequal impact of parenthood in academia
Morgan, A. C., Way, S. F., Hoefer, M. J. D., Larremore, D. B., Galešić, M., & Clauset, A. J. (2021) · Science Advances · doi:10.1126/sciadv.abd1996 · Cited by 350
Hendon, J. A. (1997) · American Anthropologist · doi:10.1525/aa.1997.99.3.647 · Cited by 213
Socio-Politics and the Woman-at-Home Ideology
Gero, J. M. (1985) · American Antiquity · doi:10.2307/280492 · Cited by 212
Pandemic burnout is rampant in academia
Gewin, V. (2021) · Nature · doi:10.1038/d41586-021-00663-2 · Cited by 149
Out of Africa: The underrepresentation of African authors in high-impact geoscience literature
North, M. A., Hastie, W. W., & Hoyer, L. (2020) · Earth-Science Reviews · doi:10.1016/j.earscirev.2020.103262 · Cited by 144
Threats to objectivity in peer review: the case of gender
Kaatz, A., Gutierrez, B., & Carnes, M. L. (2014) · Trends in Pharmacological Sciences · doi:10.1016/j.tips.2014.06.005 · Cited by 135
Exploring Gender Through Archaeology: Selected Papers from the 1991 Boone Conference
Claassen, C. P., & Beaudry, M. C. (1992) · Cited by 92
Gender inequalities among authors who contributed equally
Broderick, N. A., & Casadevall, A. (2019) · eLife · doi:10.7554/elife.36399 · Cited by 91
Gendered Citation Practices inAmerican Antiquityand Other Archaeology Journals
Hutson, S. R. (2002) · American Antiquity · doi:10.2307/2694570 · Cited by 87
Women's archaeology? Political feminism, gender theory and historical revision
Gilchrist, R. (1991) · Antiquity · doi:10.1017/s0003598x00080091 · Cited by 86
The career cost of COVID-19 to female researchers, and how science should respond
Gewin, V. L. (2020) · Nature · doi:10.1038/d41586-020-02183-x · Cited by 84
Open-access publishing fees deter researchers in the global south
Kwon, D. (2022) · Nature · doi:10.1038/d41586-022-00342-w · Cited by 81
Who Writes about Archaeology? An Intersectional Study of Authorship in Archaeological Journals
Heath-Stout, L. E. (2020) · American Antiquity · doi:10.1017/aaq.2020.28 · Cited by 80
A Critical Evaluation of Recent Gendered Publishing Trends in American Archaeology
Bardolph, D. N. (2014) · American Antiquity · doi:10.7183/0002-7316.79.3.522 · Cited by 79
Fulkerson, T. J., & Tushingham, S. (2019) · American Antiquity · doi:10.1017/aaq.2019.35 · Cited by 55
Tushingham, S., Fulkerson, T. J., & Hill, K. (2017) · PLoS ONE · doi:10.1371/journal.pone.0188403 · Cited by 53
COVID-19 gender policy changes support female scientists and improve research quality
Witteman, H. O., Haverfield, J., & Tannenbaum, C. (2021) · Proceedings of the National Academy of Sciences · doi:10.1073/pnas.2023476118 · Cited by 45
WHY DO FEWER WOMEN THAN MEN APPLY FOR GRANTS AFTER THEIR PHDS?
Goldstein, L. G., Mills, B. J., Herr, S., Burkholder, J. E., Aiello, L. C., & Thornton, C. (2018) · American Antiquity · doi:10.1017/aaq.2017.73 · Cited by 43
Discovering the Archaeologists of Europe 2012-14: Transnational Report
Atchinson, K., Alphas, E., Ameels, V., Bentz, M., Borş, C., Cella, E., Cleary, K., Costa, C., Damián, P., Diniz, M., et al. (2014) · Bangor University Research Portal (Bangor University) · Cited by 42
Prestige or Perish: Publishing Decisions in Academic Archaeology
Beck, J., Gjesfjeld, E., & Chrisomalis, S. (2021) · American Antiquity · doi:10.1017/aaq.2021.64 · Cited by 41
A “Leaky” Pipeline and Chilly Climate in Archaeology in Canada
Overholtzer, L., & Jalbert, C. L. (2021) · American Antiquity · doi:10.1017/aaq.2020.107 · Cited by 40
Sociopolitics in Southeastern Archaeology: The Role of Gender in Scholarly Authorship
Bardolph, D. N., & VanDerwarker, A. M. (2016) · Southeastern Archaeology · doi:10.1080/0734578x.2015.1113101 · Cited by 36
Stratton, S. K. (2016) · Journal of Archaeological Method and Theory · doi:10.1007/s10816-016-9290-2 · Cited by 36
VanDerwarker, A. M., Brown, K. M., Gonzalez, T., & Radde, H. (2018) · California Archaeology · doi:10.1080/1947461x.2018.1535791 · Cited by 34
Gender and medieval archaeology: storming the castle
Dempsey, K. (2019) · Antiquity · doi:10.15184/aqy.2019.13 · Cited by 27
Heath-Stout, L. E. (2020) · Journal of Field Archaeology · doi:10.1080/00934690.2020.1719295 · Cited by 25
Sinclair, A. (2016) · Internet Archaeology · doi:10.11141/ia.42.8 · Cited by 21
Gender stereotypes in archaeology. A short reflection in image and text
Coltofean, L., & Matić, U. (2021) · Cited by 19
Landscape for a good feminist. An archaeological review
Tomášková, S. (2011) · Archaeological Dialogues · doi:10.1017/s1380203811000158 · Cited by 18
Bardolph, D. N. (2018) · California Archaeology · doi:10.1080/1947461x.2018.1535813 · Cited by 18
Rebalancing Roman Archaeology: from disciplinary inertia to decolonial and inclusive action
Kamash, Z. (2021) · Theoretical Roman Archaeology Journal · doi:10.16995/traj.4330 · Cited by 18
Non-Binary and Intersex Visibility and Erasure in Roman Archaeology
Power, M. (2020) · Theoretical Roman Archaeology Journal · doi:10.16995/traj.422 · Cited by 17
Norwegian Archaeological Review1968–2008: True Trends?
Bjerck, H. B. (2008) · Norwegian Archaeological Review · doi:10.1080/00293650802203941 · Cited by 15
Under-Representation in Contemporary Archaeology
Hamilton, S., & Hamilton, S. (2014) · Papers from the Institute of Archaeology · doi:10.5334/pia.469 · Cited by 9
Gender Bias and the Journal of Roman Studies
Kelly, C. J., Thonemann, P., Borg, B. E., Hillner, J., Lavan, M., Morley, Ν., Mullen, A., Orlandi, S., Pillinger, E., PRAG, J. R. W., et al. (2019) · The Journal of Roman Studies · doi:10.1017/s0075435819000935 · Cited by 5
Gamble, L. H. (2020) · American Antiquity · doi:10.1017/aaq.2020.21 · Cited by 5
Johnson, P. S. (2022) · Journal of Computer Applications in Archaeology · doi:10.5334/jcaa.84 · Cited by 5
Australian Archaeology in Profile: A Survey of Working Archaeologists
Ulm, S., Nichols, S., & Dalley, C. (2012) · One world archaeology · doi:10.1007/978-1-4614-5529-5_3 · Cited by 3
Discourse Through the Looking Glass: Gender in the Language of Archaeological Journals
Leiuen, C. D. (2015) · Archaeologies · doi:10.1007/s11759-015-9284-9 · Cited by 3
Gamble, L. H. (2021) · American Antiquity · doi:10.1017/aaq.2021.26 · Cited by 3
Research works printed but not linked: 4
- Aitchison K., 2021, Profiling the Profession
- D’Anna M. B., 2021, Pearls, Politics and Pistachios: Essays in Anthropology and Memories on the Occasion of Susan Pollock’s 65th Birthday, 557
- Eve M. P., 2021, Reading Peer Review: PLOS ONE and Institutional Change in Academia
- Rautman A. E., 2012, SAA Archaeological Record, 12, 25
Cited by
The African Archaeological Review Turns Forty: Some Reflections on the Past, Present, and Future
Gokee, C., & Ogundiran, A. (2023) · African Archaeological Review · doi:10.1007/s10437-023-09521-0 · Cited by 8
Metadata
- Authors
- Hanscam, E., & Witcher, R.
- Venue
- Journal of Field Archaeology
- Publisher
- Informa UK Limited
- Published
- 2022-11-16
- Volume
- 48
- Issue
- 2
- Pages
- 87-101
- ISSN
- 0093-4690
- 2042-4582
- Cited by
- 19
- References
- 41
- Language
- en
- Funders
- the Antiquity Trust
- British Academy (WW2021100224)
About these checks
Registry, retraction, Cites and statistics results are computed, not judged, with one exception: a printed reference that no index lists is read once by a model before it counts as a citation error. Claims are extracted by a model and kept only when their quote appears verbatim in the text; each cited source is then checked, with a model’s help, for whether it says what the claim relies on. Those verdicts can be wrong — read the claim’s quote and the cited source before relying on one.
Statistics and arithmetic are recomputed, not judged.
Confidence bands are shown only for fields calibrated on our annotated test set. None is calibrated yet, so no band is shown.
What counts as a claim ›How we measure confidence ›How we check this ›
Are you an author, or do you see a problem with this page? Request a review
Data sources
Bibliographic data: Semantic Scholar, OpenAlex, Crossref.
Contains information from the Semantic Scholar Academic Graph Datasets, made available under the ODC Attribution License (ODC-BY 1.0).
Semantic Scholar’s data is described in: Kinney, R., et al. (2023). The Semantic Scholar Open Data Platform. arXiv:2301.10140.
